DXY Yearly Analysis
- Where is price?
Price is in Area2, below the static yearly EBOT and above the yearly live EBOT. Direction is down, slope is down. Price is in a c-wave down, congestion target has been acheived. Flow (bearish) is strong, as the candle is long and the close is relatively close to the low of the candle.
- What is it doing?
2022 candle broke the congestion confines of the 2021 candle (high of this candle is higher than the latest trend high), closing above the PLdot and extending the upward move and 2023 and 2024 candles were trend up candles as they closed on the same side of the PLdot. 2022 after exhausting, demonstrated that the Area5 is strong resistance and 2025 candle clearly demonstrated the force of this resistance. 2025 candle now is a congestion entrance candle, posing the boundaries for the following candles and implying that we shall have most probably congestion action trading in the consecutive yearly DXY candles.
- What is next?
The 2025 congestion entrance implies that the DXY is likely entering a phase of Congestion Action on the yearly chart.
1. Congestion Confines :
- Resistance (Dotted Line) : 2022 High (approx. 114.78 ).
- Support (Block Level) : 2025 Low ( 96.218 ).
2. Primary Scenario (Congestion Action) :
- The market is expected to oscillate between these two levels (114.78 and 96.218) over the coming years, with yearly closes alternating above and below the live yearly PLdot (currently at 103.34).
- The main objective of a Congestion Action Trade is to move from the bottom of the envelope to the top and vice versa, utilizing the support/resistance levels created by the envelope (EBOT, PLdot, ETOP) and the block/dotted line levels.
3. Alternative Scenario (Congestion Exit) :
- Congestion Action ends when one of the confines is broken, leading to a Congestion Exit , which is the prelude to a new trend.
- Bullish Exit : A yearly close above the Dotted Line (114.78) would signal a resumption of the uptrend.
- Bearish Exit : A yearly close below the Block Level (96.218) would signal the start of a new downtrend.
4. Importance of the Block Level :
- The Block Level at 96.218 is the initial support for this congestion. The Block Level is potentially the most difficult trade and its strength depends on the Higher Time Period (HTP) (5 year TF - unfortunately TradingView does not go yet above 12M intervals).
- As long as this level holds, Congestion Action remains the most probable scenario.
Happy New Year to the global trading community! 🎉📈
May your risk be measured , your conviction be tested (but not punished) , and your wins be larger than your losses .
May you respect your stops, trust your process, and remember that the market doesn’t owe us anything .
And here’s the catch:
May you be just as proud of the trades you didn’t take as the ones you did.
Here’s to a year of discipline over ego, patience over prediction, and survival first — profits second.
Cheers to the next session and happy 2026. 🥂📊
Multiple Time Frame Analysis

USDCHF - Buy the Retrace?Daily Chart
The daily structure on USDCHF remains bearish, both in the swing view and the fractal view. Price is currently testing a daily FVG, but this zone feels weak considering there is another daily bullish FVG below, aligned with an untested daily BB. That deeper zone is where I would ideally like to see price react to the downside from in the future.
For now, price just swept the equal lows resting beneath and immediately reacted to the upside — a potential sign of short-term relief before any continuation lower.
4H Chart
On the 4H chart, we don’t get many standout signals — however, we can clearly see a shift in fractal structure. Notably, the previous bearish fractal break appears to have been a liquidity play, as the very next candle shifted the structure back to bullish.
From my perspective, this opens the door for a countertrend long, with my entry positioned around the 0.50 retracement of the current bullish 4H fractal structure.
My SL is placed below the protected low that already swept liquidity, and my TP sits at 2R, aligned with the 4H BB.
Risk: 0.5%, since:
it’s a countertrend setup,
DXY is choppy and not strongly bullish,
and we still have a daily bearish FVG overhead.

GOOGL – Trendline Break, Pullback & Key Levels to WatchGOOGL maintains a bullish structure on the Daily timeframe — however, lower-timeframe price action has shifted into a more sensitive zone.
On the 4H chart, the ascending trendline has now broken, and price is actively pulling back to retest that structure.
The current area to observe is the $317 – $327 supply zone, where sell orders were previously triggered.
What stands out during this pullback is the decline in trading volume, suggesting buyers are losing momentum while price retraces.
As long as this zone is not engulfed (ENG), the expectation remains toward a corrective push — first into the $300 pocket.
If momentum accelerates during the correction, price may extend toward the second green zone marked on the chart, where a fresh decision awaits.
GOOGL is now positioned in a phase where patience and timing can make a meaningful difference.
For traders who follow structure and order-flow, the coming moves could define the next opportunity window.
📌 Regular updates will follow as the chart develops — staying connected ensures you won’t miss the next key shift.
`P NASDAQ:GOOGL NASDAQ:GOOGL ouryaabdi

NZDUSD - Bulls Said ‘BRB’, I WaitDaily Chart
The daily structure remains bullish, and price has just taken liquidity at an important level before tapping into an unmitigated daily BB, where we’re now seeing a solid reaction.
Price has already reached the 0.50 retracement of the current daily fractal leg, filled a nearby daily FVG, and is now resting below another daily FVG — a zone where long setups could develop if price retraces deeper.
4H Chart
Since the daily trend is bullish, the overall directional bias remains upward. However, the 4H fractal structure is currently bearish, meaning the ongoing move is likely a retracement within the higher-timeframe trend.
The key now is to see how deep this retracement goes before the market resumes higher.
The current 4H bearish fractal has left behind another 4H bearish FVG, from which additional short-term selling pressure may appear. The risk here is that if the current fractal low breaks, the fractal structure will flip, making the 4H FVG less relevant as bulls could simply override it.
The ideal scenario for longs would be to see continued bearish momentum during the Asia session, allowing price to tag the major 4H POIs (FVG + OB), while also tapping into the daily bullish FVG.
From that confluence, I’ll monitor fractal structure shifts to time potential long entries back in line with the bullish daily trend.

Gold has given a new high but has dropped back into supportNot an easy situation here on gold but the zones are pretty well defined. We are looking to see how gold treats the bearish supply recently created above the range, as well as monitor how the lows are being treated coming into the new year.
We are expecting much bullish discovery on the horizon as there is no real indication it will slow its growth curve as of yet.
Be sure to subscribe for more clear breakdowns

XAUUSDWelcome to my TradingView profile.
All content shared here is strictly for educational and informational purposes only. This analysis documents market behavior through the lens of price structure, liquidity delivery, and institutional order-flow concepts. Nothing presented should be interpreted as financial advice or a trade recommendation.
🔍 Market Structure Observation
Gold has recently delivered a strong impulsive expansion, indicating decisive participation and aggressive repricing. Such moves are rarely random; they often occur after liquidity has been efficiently engineered and absorbed at lower levels.
Following the expansion, price transitioned into a controlled pullback, suggesting a pause in momentum rather than immediate structural failure.
🧠 Demand Zone Context
The highlighted demand zone represents the origin of the impulsive leg — an area where imbalance previously entered the market with conviction. From an institutional perspective, this zone acts as a reference point, not a signal.
If price revisits this area, the quality of the reaction (acceptance, rejection, or absorption) will provide valuable insight into whether buy-side strength remains present or whether distribution is underway.
⚖️ Probabilistic Framework
Markets operate on probabilities, not predictions.
At current levels:
Continuation remains possible if demand is respected
Deeper retracement remains valid if imbalance seeks fuller mitigation
Consolidation may occur as liquidity redistributes
All scenarios remain open until price confirms or invalidates them.
📌 Purpose of This Channel
This channel is built around:
•Structure over indicators
•Liquidity over emotion
•Process over outcome
•Education over hype
There will be no signals, no guarantees, and no performance claims.
Only clean charts, disciplined reasoning, and transparent execution logic.
If you appreciate objective analysis, institutional market logic, and a rule-based approach, you’re welcome to follow and engage.
Let price tell the story.

Bitcoin enters 2-day Gaussian channel, 3 months of sideways?Bitcoin has officially entered the 2-day Gaussian Channel, a technical event that has historically coincided with prolonged sideways price action. Looking left, past instances suggest this phase can last several months, often frustrating both bulls and bears before a clear trend emerges.
Key Observations
Price is currently trading inside the 2D Gaussian channel. Historically, this has led to ranging/sideways price behaviour rather than immediate trend continuation.
The sideways trading range can take up to 90 (red circles), meaning the end of November before a meaningful direction change in price action.
Potential Scenarios
Bullish Case – Price action has not yet confirmed the sideways trading period. A 2 day candle must close on or above $114k by August 31st.
Bearish Case – failure to close above $114k by August 31st would confirm the sideways trading period. Furthermore it would confirm the end of the Bitcoin bull market, the technical cycle ends now in 30 days.
The end of the bull market?!
Unless you think this time is different, every cycle prior has ended in 526 days or less post halving, leaving the market with 30 days until the technical top. That's why whales have been gladly using retail exit liquidity those past few weeks. They have a plan, retail has influencers.
Conclusion
The entry into the 2-day Gaussian channel signals a likely multi month sideways market for Bitcoin. Patience will be key, traders should prepare for a rangebound environment while positioning for the eventual breakout.
Ww
⚠️ Disclaimer: This is not financial advice. For educational purposes only. Do your own research and manage risk appropriately.

Chapter 7 — HOW-TO: MARAL Supports Traders in Live MarketsChapter 7 — How -TO : MARAL Supports Traders in Live Markets (v1.1.0)
Execution Discipline, Risk Control, and Greed Management (Educational Framework)
MARAL — Execution Workflow (Build v1.1.0 — Optional Modules) is a discretionary decision-support framework built in Pine Script for TradingView.
It standardizes live execution through a repeatable workflow:
Context → Qualification → Management → Action (EDC).
✅ No automation. No trade execution. No signal service. No performance guarantees.
MARAL is designed to reduce the biggest live-market problems: overtrading, greed, impulsive entries, timeframe conflict, and weak post-entry control.
7.1 Why Traders Fail Live (Even With “Correct” Concepts)
Many traders understand structure/liquidity ideas — yet still lose because execution breaks down:
Anticipation entries (entering before permission)
Timeframe conflict under pressure (HTF bias ignored by LTF noise)
Unclear invalidation (“Where exactly am I wrong?”)
Weak post-entry control (holding too long, panic exits, SL shifting)
Greed loops (overtrade after wins, revenge after losses)
MARAL is built to control decisions under stress by converting market information into clear states and actionable gates.
7.2 MARAL’s Live Execution Architecture (Boards + Optional Modules)
A) Context Board (Market Environment)
Answers: “Is this a trade-worthy environment?”
Summarizes direction, HTF bias (1H/4H/D), structure, momentum, volatility (ATR%), trend strength (ADX), scoring, liquidity context, plus optional layers such as session/LTF bias/participation.
B) Qualification Gate (Pre-Entry Permission)
Answers: “Do I have permission NOW?”
Blocks trades unless HTF/structure/momentum/regime/liquidity/alignment requirements are acceptable, then issues:
ENTRY PERMISSION: ENTER / WAIT / SKIP.
C) Management Desk (Post-Entry Control)
Answers: “How do I manage this trade without emotion?”
Monitors trade health, phase, obstacles, exit pressure, score trend, risk state, trade age, SL mode, and action state.
D) EDC — Execution Decision Core (Unified State Summary)
Answers: “What is the correct action right now?”
Compresses the entire workflow into:
SETUP → ENTRY PERMISSION → LIQUIDITY → TRADE STATUS → ACTION STATE.
Optional v1.1.0 Modules (Advanced Live Support)
ECI Panel (Execution Confidence Index)
Session Context (ACTIVE / TRANSITIONAL / DEAD)
LTF Execution Bias (15m & 5m) + LTF Exec quality
Divergence as Risk Modifier (context only; no entry trigger)
Post-Entry Stress (Manual Tracker)
Scalp Execution & Exit Panel (permission-locked)
7.3 How MARAL Controls Greed in Live Markets
Greed is not solved by motivation — it is solved by rules + visibility.
MARAL reduces greed through:
WAIT discipline (no permission = no trade)
Setup scoring + grade (filters “almost-good” entries)
Liquidity context & obstacles (prevents holding into walls)
Exit pressure + score trend (prevents emotional holding)
Post-entry stress tracking (controls behavior after entry)
Scalp permission lock (prevents fast-market overtrading)
The result is not “more trades.”
The result is better decisions and fewer mistakes.
7.4 Key Live-Market Features (How to Use MARAL Correctly)
1) Permission-First Execution (ENTER / WAIT / SKIP)
ENTER = minimum execution quality is met
WAIT = context is not confirmed (do not force entries)
SKIP = environment is unsuitable (chop/regime weakness/conflict)
2) Alignment Score + Grade (Quality Control)
Grades are execution quality labels, not predictions.
Higher grades generally reflect cleaner agreement across direction, momentum, HTF context, structure, and liquidity environment.
3) Liquidity Context + Obstacle Ahead (Risk Awareness)
Highlights sensitive zones (PDH/PDL and swing liquidity).
This helps avoid entering into traps or holding into “walls”.
4) MTF/LTF Diagnostics (Timeframe Discipline)
MTF Status: ALIGNED / MIXED / CONFLICT
LTF Exec (optional): SUPPORTIVE / WEAK / RISKY / AVOID
5) Management Desk (Post-Entry Control)
MARAL continues beyond entries:
Trade Status: VALID / RISKY / WEAK
Exit Pressure: LOW / RISING / HIGH
Action State: HOLD / TIGHT SL / SCALE OUT / EXIT
7.5 Core Filters (Copy-Safe Disclosure)
MARAL uses 6 core market filters + multiple execution intelligence layers (structure, displacement, scoring/grades, MTF/LTF diagnostics, and post-entry management).
7.6 Post-Entry Stress (Manual Tracker) — Deep Live Explanation
Why this module exists
Most traders lose control after entry (panic, greed, SL shifting, refusing to exit, adding emotionally).
Post-Entry Stress converts post-entry behavior into objective states:
✅ RISK STATE: LOW / MED / HIGH
✅ ACTION: HOLD / REDUCE / PROTECT / EXIT
This is not a signal engine. It is a discipline engine.
What you input (manual)
Tracking ON/OFF — enable only when you have a real position
Direction — Long or Short
Entry Price — your actual filled entry (not candle close)
Stop Loss (recommended) — your planned SL (manual or ATR-based)
What it monitors (conceptually)
MAE (ATR) — adverse excursion measured in ATR units (stress magnitude)
MFE (ATR) — favorable excursion measured in ATR units (progress magnitude)
Rejection pressure (wick aggression)
Volatility expansion
Opposing pressure (conditions flipping against your trade)
SL safety context (when SL is provided)
How to read it live
LOW → trade is behaving normally → HOLD
MED → stress building → REDUCE / PROTECT (rule-based)
HIGH → risk is dominant → PROTECT / EXIT
SL compromised → trade is compromised → EXIT
Professional rule:
If the stop is compromised, the trade is compromised.
7.7 MARAL v1.1.0 Feature Index — 56 User-Facing Features (Panels)
A) Context Board — 18 Features (Environment + Alignment)
1.DIRECTION — Bullish / Bearish / Neutral bias derived from the master scoring engine.
2.H1 CONTEXT — HTF1 bias state (ON/OFF; Bull/Bear/Neutral).
3.H4 CONTEXT — HTF2 bias state (ON/OFF; Bull/Bear/Neutral).
4.DAILY CONTEXT — Daily bias state (ON/OFF; Bull/Bear/Neutral).
5.STRUCTURE — Bull Struct / Bear Struct / Neutral Struct (swing structure mapping).
6.MOMENTUM — UF-RSI momentum state: BULL / BEAR / NEUTRAL.
7.VOLATILITY (ATR%) — ATR as % of price for stability/regime awareness.
8.TREND STRENGTH (ADX) — ADX-based trend quality reading.
9.LONG SCORE + Grade — Long alignment score + grade (A++/A+/A/B/No-Trade).
10.SHORT SCORE + Grade — Short alignment score + grade (A++/A+/A/B/No-Trade).
11.ALIGNMENT SCORE — master execution score used for live filtering.
12.LIQUIDITY CONTEXT — HIGH / NEUTRAL / LOW (event/near/eventless context).
13.PARTICIPATION (optional) — STRONG / NEUTRAL / WEAK (participation quality context).
14.MTF STATUS — ALIGNED / MIXED / CONFLICT (timeframe agreement diagnostic).
15.SESSION (optional) — ACTIVE / TRANSITIONAL / DEAD / OFF (session context).
16.15m BIAS (optional) — 15-minute execution bias state (Bull/Bear/Neutral).
17.5m BIAS (optional) — 5-minute execution bias state (Bull/Bear/Neutral).
18.LTF EXEC (optional) — SUPPORTIVE / WEAK / RISKY / AVOID (micro execution quality).
B) Qualification Gate — 8 Features (Permission to Execute)
19.SETUP — LONG / SHORT / WAIT based on qualified candidate conditions.
20.HTF CONTEXT — OK / WARN / BAD (direction compatibility check).
21.STRUCTURE — OK / WARN / BAD (structure confirmation strength).
22.MOMENTUM — OK / WARN / BAD (momentum confirmation + chop avoidance).
23.VOL/REGIME — OK / WARN / BAD (volatility + trend regime suitability).
24.LIQUIDITY — HIGH / NEUTRAL / LOW (execution safety context).
25.ALIGNMENT — score vs threshold (example: 78 / 65).
26.ENTRY PERMISSION — ENTER / WAIT / SKIP (final execution gate).
C) Management Desk — 11 Features (Post-Entry Control)
27.TRADE STATUS — VALID / RISKY / WEAK (idea health state).
28.MARKET PHASE — IMPULSE / PULLBACK / CONTINUATION / RANGE (phase awareness).
29.OBSTACLE AHEAD — YES / NO (PDH/PDL or swing proximity risk).
30.EXIT PRESSURE — HIGH / RISING / LOW (risk escalation logic).
31.MOMENTUM HEALTH — STRONG / WEAKENING / WEAK / NEUTRAL (post-entry momentum state)
32.SCORE TREND — IMPROVING / DETERIORATING / STABLE (quality drift).
33.RISK STATE — OVEREXTENDED / NORMAL (distance vs volatility).
34.TRADE AGE — FRESH / MID / LATE (time-in-trade awareness).
35.SL MODE — BE OK / TIGHT / NORMAL (stop behavior guidance).
36.ACTION STATE — HOLD / TIGHT SL / SCALE OUT / EXIT (rule-based action).
37.ACTIVE WINDOW — ON / OFF (management window after last setup).
D) EDC — Execution Decision Core — 5 Features (Unified Action)
38.EDC: SETUP — LONG / SHORT / WAIT.
39.EDC: ENTRY PERMISSION — ENTER / WAIT / SKIP.
40.EDC: LIQUIDITY — HIGH / NEUTRAL / LOW.
41.EDC: TRADE STATUS — VALID / RISKY / WEAK / —.
42.EDC: ACTION STATE — HOLD / TIGHT SL / SCALE OUT / EXIT / —.
E) ECI Panel (Optional) — 3 Features (Execution Confidence)
43.ECI SCORE + Grade — confidence context derived from alignment score (graded).
44.RISK MOD (optional) — POSITIVE / NEGATIVE / NEUTRAL (divergence-based modifier).
45.CAP NOTES — automatic constraints summary (why quality is capped).
F) Post-Entry Stress Panel (Optional Manual Tracker) — 6 Features
46.TRACKING — ON / OFF (manual tracker state).
47.DIRECTION — Long / Short (tracked position side).
48.MAE (ATR) — adverse excursion measured in ATR units (stress magnitude).
49.MFE (ATR) — favorable excursion measured in ATR units (progress magnitude).
50.RISK STATE — LOW / MED / HIGH (stress classification).
51.ACTION — HOLD / REDUCE / PROTECT / EXIT (stress-driven behavior).
G) Scalp Exec Panel (Optional; Permission-Locked) — 5 Features
52.SCALP ENTRY — PERMITTED / BLOCKED (strict permission lock).
53.ENTRY QUALITY — A / B / C (execution quality classification).
54.MGMT — HOLD / PROTECT / PARTIAL / EXIT (fast management instruction).
55.SL CONTEXT — VALID / AT-RISK / COMPROMISED / — (stop safety context).
56.PARTICIPATION — STRONG / NEUTRAL / WEAK / OFF (context-only quality).
7.8 Visual & On-Chart Execution Tools (Built-In)
Risk Planning (optional): Auto SL + TP1 + TP2 + TP3 (ATR-based)
PDH/PDL reference lines
Swing liquidity points (pivot highs/lows)
Optional state markers (LONG/SHORT)
Candle coloring by bias
7.9 Professional Clarity (What MARAL Is / Is Not)
MARAL supports traders by:
enforcing permission-based execution (ENTER / WAIT / SKIP)
reducing overtrading through gating + scoring
standardizing post-entry management via Trade Status + Action State
showing risk early (exit pressure, obstacles, deterioration)
enabling disciplined scalping via permission locks (optional)
MARAL does not:
predict the future
guarantee outcomes
execute trades
replace learning, discipline, or risk management
full maral panel togather for USD/GOLD
Permission first. Risk always. Discipline forever.
This script and the content in this chapter are provided strictly for educational and informational purposes.
Note : Discretionary decision-support only: MARAL is a chart-analysis workflow designed to help traders structure their decision process (context → qualification → management).
Not financial advice: Nothing here is investment advice, trading advice, or a recommendation to buy/sell any asset.No automation / no execution: The script does not place trades, execute orders, or provide any guaranteed “signal service.”No guarantees: Trading involves significant risk. Past performance does not predict future results. Any examples shown are for learning only.User responsibility: You are solely responsible for your own decisions, risk management, position sizing, and compliance with your local regulations and broker rules.
Use at your own risk. Trade responsibly.
#TradingView #PineScript #TradingEducation #Execution #TradingPsychology #RiskManagement #Discipline #NoTradeZone #Overtrading #GreedControl #TradeManagement #MarketStructure #Liquidity #SmartMoney #ICT #MTFAnalysis #PriceAction #ATR #ADX #RSI #Scalping #IntradayTrading #Forex #Crypto #Stocks

EBay Bidders May Be ActiveEBay has squeezed into a tight range, but some traders may think the e-commerce stock is getting bid higher.
The first patterns on today’s chart are the price gap from October 30 and the October 10 weekly close of $88.55. EBAY has been trapped below both price areas and is now approaching them. Could a breakout through resistance follow?
Second, Bollinger Bandwidth in the lower study shows how prices have squeezed into a tight range. That period of compression may also create potential for movement to resume.
Third, MACD is rising and the 8-day exponential moving average (EMA) crossed above the 21-day EMA. Those signals may reflect increased bullishness in the short term.
Finally, prices are back above the 50-day simple moving average (SMA). They also stayed above the 200-day SMA, which could suggest the longer-term trend is still pointing upward.
TradeStation has, for decades, advanced the trading industry, providing access to stocks, options and futures. If you're born to trade, we could be for you. See our Overview for more.
Past performance, whether actual or indicated by historical tests of strategies, is no guarantee of future performance or success. There is a possibility that you may sustain a loss equal to or greater than your entire investment regardless of which asset class you trade (equities, options or futures); therefore, you should not invest or risk money that you cannot afford to lose. Online trading is not suitable for all investors. View the document titled Characteristics and Risks of Standardized Options at www.TradeStation.com . Before trading any asset class, customers must read the relevant risk disclosure statements on www.TradeStation.com . System access and trade placement and execution may be delayed or fail due to market volatility and volume, quote delays, system and software errors, Internet traffic, outages and other factors.
Securities and futures trading is offered to self-directed customers by TradeStation Securities, Inc., a broker-dealer registered with the Securities and Exchange Commission and a futures commission merchant licensed with the Commodity Futures Trading Commission). TradeStation Securities is a member of the Financial Industry Regulatory Authority, the National Futures Association, and a number of exchanges.
TradeStation Securities, Inc. and TradeStation Technologies, Inc. are each wholly owned subsidiaries of TradeStation Group, Inc., both operating, and providing products and services, under the TradeStation brand and trademark. When applying for, or purchasing, accounts, subscriptions, products and services, it is important that you know which company you will be dealing with. Visit www.TradeStation.com for further important information explaining what this means.

XAUUSD Currently on Gold price I can see that price is in a downtrend ,I’m looking 👀 at price under 4,377 , because under that level sellers have more control

ETHUSD - Is the bear market over for ETH?I am considering that the bear market is not over, we see bears stepping in for the remaining of the month / year.
We have clear bearish reactions from the daily FVG / 4h FVG with both fractal structures on both timeframes beeing bearish.
I am expecting that ETH will continue it's movement for at least the 4h bullish FVG connection, where i will be moving my SL to BE and let the trade run with 0 risk.
The last low, in my point of view, is far from beeing protected and we can see another round of sells before anything else.

USDCAD - Dip Buy → Then Sell?Daily Chart
On the daily chart, the market remains bearish — both in the swing view and fractal view.
Below the most recent low, we have a daily demand zone / OB, which could provide a future swing long opportunity if price reaches it.
For now, however, a countertrend long makes sense before any deeper move lower, as price appears overextended and may push higher to fill the daily FVG and connect with the 0.50 retracement of the current downside leg.
4H Chart
The 4H chart aligns with the daily perspective, but with one important detail:
fractal structure turned bullish today after reacting to an old daily FVG, adding weight to a countertrend long idea.
We currently see a reaction at the bearish daily FVG, meaning sellers are still active — but I expect price to push higher, potentially to complete the FVG fill and connect with the 4H BB.
That’s the zone where I would look for shorts in line with the higher-timeframe trend.
Until then, the long retracement setup remains valid.

Nifty Playbook W1-Day 2 (Dec 30, 2025) – Quick Market UpdateMarket in a chokehold around 25,900–26,000. Yesterday closed ~25,942 (-0.38%).
Technicals
• Resistance: 3H close at overhead supply (26,100–26,200).
• Support: Strong at 25,700–25,800 (1D/4H confluence).
• Bias: Range-bound, mildly bullish above 25,800. Dips likely to test support then bounce; breakdown below 25,800 signals caution.
Options Flow
Puts have solid ITM/ATM support; calls show weak backing and heavy resistance. Flip mechanism: put support break could trigger call upside.
FII/DII- FIIs net selling heavily; DII inflows 3–4x stronger, providing cushion.
Feels bubble-like with stretched valuations + thin volumes. Stay selective, manage risk tightly. Bulls need close above 26,200 & PR1X Below 199.7 ; watch 25,800 downside closely.

USDCHF - Bias BearishUSDCHF is carrying a bearish bias for today based on higher-timeframe daily price action.
The previous daily candle showed clear signs of selling pressure at premium levels, confirming that sellers are in control. This aligns with a bearish daily narrative, suggesting that price is more likely to seek lower levels rather than continue higher.
As long as price remains below yesterday’s key highs, the expectation is for bearish continuation, with any intraday retracements viewed as potential sell opportunities in line with the daily bias.
Looking the fact that the weekly profile is inline with the daily, adds extra level of conviction.
So during active trading session, we wait for Internal Range Liquidity to be mitigated (such case the 1h FVG as seen in the video), and then can confidently apply the ICT 2022 Module.
📌 Bias only. Execution is refined on lower timeframes.

EURNZD Retest of Triple Top Neckline.(D1) Price is in downtrend making new lower highs and lower lows.
(D1) 50 EMA acting as Resistance at the Key Level.
(D1) Price formed triple top at (2.04376 - 2.03839) which price confirmed by breaking the neckline at (2.02947 - 2.02612) and price later retested the neckline in the 4H.
(4H) Price is in (50% - 61.8%) Fib Zone which represents a deep pullback to the triple top neckline.

USDJPY H4 Pullback and Bullish Continuation Toward 157.7📝 Description
USDJPY on H4 is trading inside a bullish corrective leg after a strong impulse. Price has reacted cleanly from H4 BPR + FVG, holding above discount and showing signs of continuation rather than reversal. Structure remains bullish as long as price stays supported above the recent mitigation zone.
________________________________________
📈 Signal / Analysis
Primary Bias: Bullish continuation while above 156.00–156.10
Long Setup (Preferred):
• Entry (Buy): 156.3
• Stop Loss: Below 156
• TP1: 156.85
• TP2: 157.25
• TP3: 157.68 (HTF liquidity)
________________________________________
🎯 ICT & SMC Notes
• Strong bullish impulse followed by healthy pullback
• Price respecting H4 BPR + FVG confluence
• BSL resting above recent highs
• No bearish CHOCH on HTF
________________________________________
🧩 Summary
This looks like a classic pullback-for-continuation setup. As long as price holds above the mitigation zone, odds favor a push toward 157.2 and 157.7 liquidity. Shorts only make sense if structure breaks.
________________________________________
🌍 Fundamental Notes / Sentiment
USDJPY remains sensitive to US yields and BOJ expectations. Any delay in BOJ tightening or strength in US data can fuel further upside, keeping the bullish continuation scenario intact.
________________________________________
⚠️ Risk Disclosure
Trading involves substantial risk and may result in capital loss. This analysis is for educational purposes only and does not constitute financial advice. Always apply proper risk management, predefined stop-loss levels, and disciplined position sizing aligned with your trading plan.

AUDUSD - Trap Set, Bears ReadyDaily Chart
AUDUSD remains in a strong bullish swing and fractal structure. Although price has just tapped into the daily bullish FVG, the current POI sits within the premium area of the fractal leg, suggesting that a deeper retracement would offer a healthier correction before continuation.
Price recently swept major daily liquidity highs, and we are now seeing the first signs of a reaction.
Below the current daily FVG, and inside the discounted zone where I want to position longs, we have another daily bullish FVG overlapping a daily OB — a strong long-term demand confluence if price retraces deeper.
4H Chart
On the 4H chart, the double liquidity sweep becomes more visible — first on the daily structure, then again on the 4H where early buyers were liquidated.
The fractal structure has shifted bearish, but at this stage I consider the confirmation weak.
Why? Because the break came through a rollover candle, not a clean body break. I would prefer a full body close below the previous day’s low to validate the bearish fractal break.
If that happens, my plan is to draw a Fibonacci retracement and look for entries at the premium area of the break (around 0.50) to target the next 4H POI — the Breaker Block, which lies inside the current daily FVG.
Despite being a countertrend idea, the confluence is strong enough for me to consider risk.
Additional Notes
On the 1H chart, the entry aligns nicely with a supply zone formed by the 1H fractal break, covered by:
1H FVG
1H OB at the top
The only concern: the 1H reacted after liquidating a 1H bullish OB inside a daily bullish FVG, which adds some complexity — but does not invalidate the setup.

GBPUSD - Bullish ContinuationHTF structure remains bullish with price respecting higher-timeframe flow. The market continues to hold strength, and the overall narrative hasn’t changed — buyers remain in control.
Two positions are currently active, both aligned with the prevailing structure. I’m now simply waiting for continuation delivery as price works through its next phase. No rush, no forcing entries — just letting the market unfold as intended.
Structure is respected, bias remains intact, and momentum favors continuation.
Patience is key.
Tracking is the edge.
Let’s go. 🔥

AUDCAD - Bullish BiasHTF (4H) remains within a bullish range, consolidating near highs with strong volume support favoring continuation.
On the 30M, the OB has been mitigated from the marked zone, and we’re seeing LTF reaction off that area.
LTF (5M): still tracking alignment — waiting for a clean sweep into the OB before executing. Once that happens, I’ll look for confirmation to enter.
Patience is key.
Tracking is the edge.
Let’s go. 🔥

USDCAD - Bullish BiasHTF (4H) structure remains bullish. I’ve mapped it from the Daily to get a broader perspective — liquidity has been taken, leading price into a strong OB after the trap was set.
On the 30M, I’m watching for a midterm market structure shift. Once that confirms, I’ll define the internal OB and prepare for execution.
LTF (5M): after midterm alignment, I’ll wait for price to mitigate the zone, then look for a clear MSS and pullback into demand to take buy entries.
Until then, patience is key.
Tracking is the edge.
Let’s get it. 🔥

USDCHF - Bullish BiasHTF (4H) structure remains bullish, printing the same tape as last week — nothing has changed. Bulls remain in control as price was driven into a strong internal structure OB after taking out major IDM.
On the 30M, price has mitigated the OB with strong reaction off the wick, showing respect for the zone and confirming participation through volume.
LTF (5M): market structure shifts are forming, but after the initial sweep, probability isn’t fully aligned yet. I’m watching for deeper discounted territory and cleaner alignment across timeframes before engaging. All prior OBs have been mitigated — now it’s about patience and confirmation.
Until everything syncs up, I’m waiting.
Patience is key.
Tracking is the edge.
Let’s go. 🔥

Nifty Playbook W1 (as of Dec 29, 2025)Nifty playbook Week 1 (as of Dec 29, 2025):
• Dotted projectile lines → My exhaustion zones (VAR-based) — where momentum typically fades and reversals kick in.
• Range lines → My standard expected up/down volatility range.
• Key S/R lines (some marked by specific candle timeframe closes) → Strong support/resistance levels for added conviction.
Playbook summary: Now just watch the chart dance. Wait for price to interact with exhaustion zones + range boundaries + key S/R. When confirmation hits, execute the flip mechanism exactly as outlined in my 23 Dec idea (reversal trade on exhaustion failure or breakout).
Stay patient — the market will show its hand.

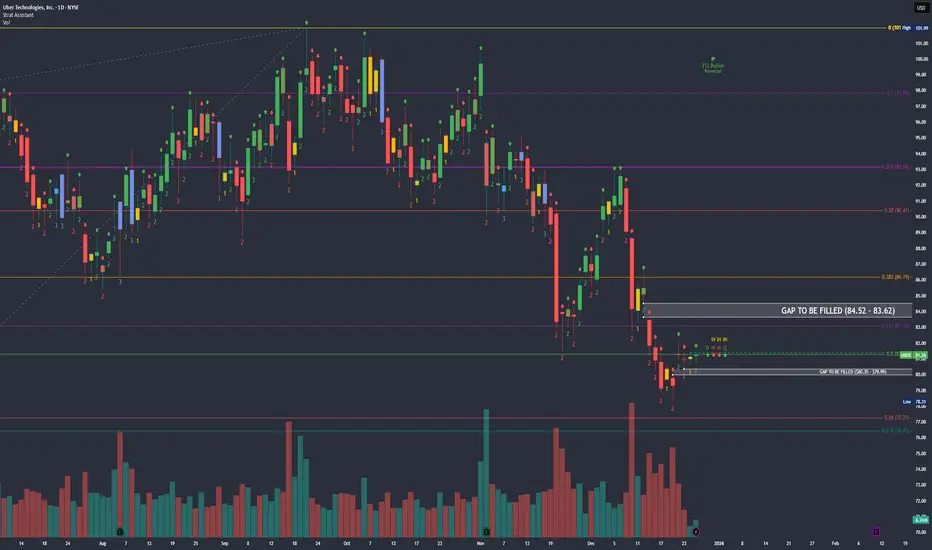
$UBER Daily: 2u Continuation Above $81.50 Resistance Break📊 POSITION: $85c 03/20/26 @ $4.28 | Current Stock Price: $81.26
🎯 PT: $8.56 (+100%) | SL: Below $80.68
━━━━━━━━━━━━━━━━━━━━━━━━━━━━━━━━━━━━
📈 MULTI-TIMEFRAME STRUCTURE
WEEKLY: 3-2d-1 Inside Week (Consolidation)
- Bullish trigger: Break above $82.25
- Bearish invalidation: Close below $80.35 → Target $78.30
- Status: Coiling for directional move
2-DAY: 3-1-2u Pattern
- 2u continuation setup above $81.50
- Watching for confirmation candle
DAILY: 2d-1-2u Structure (CHART SHOWN)
- Key resistance: $81.50 (Previous Day High) - breakout = continuation
- Critical support: $81.09 (previous day midpoint)
- Below $81.09 on multiple timeframes → Bearish to $80.68 (Previous Day Low)
- Further downside: $80.50 → $80.00
- Upside gap-fill target: $83.62-$84.52
━━━━━━━━━━━━━━━━━━━━━━━━━━━━━━━━━━━━
🎯 FIBONACCI ANALYSIS
Long-Term Fib (ATL → ATH):
- Swing: $13.71 (03/18/20) → $101.99 (09/22/25)
- Current zone: 0.214-0.28 retracement ($77.27-$83.10)
- Holding bullish all-time Fibonacci support
Recent Swing Fib:
- Swing: $60.63 (04/07/25) → $101.99 (ATH)
- Current: 0.5-0.618 golden pocket ($76.43-$81.31)
- Price finding support at key retracement zone
━━━━━━━━━━━━━━━━━━━━━━━━━━━━━━━━━━━━
📍 KEY LEVELS
Resistance:
$81.50 (PDH - breakout trigger)
$82.25 (weekly bullish confirmation)
$83.62-$84.52 (gap fill zone)
Support:
$81.09 (daily midpoint)
$80.68 (PDL - stop-loss level)
$80.00 (psychological support)
━━━━━━━━━━━━━━━━━━━━━━━━━━━━━━━━━━━━
💡 TRADE THESIS
Price consolidating at confluence of multiple Fibonacci support zones while forming a 1-2u-2u continuation pattern. Clean risk/reward with defined invalidation below $80.68. Break above $81.50 triggers 2u continuation toward gap fill at $83-84.
Entry rationale:
✓ Multi-timeframe alignment (Weekly inside bar, 2D/Daily 2u setup)
✓ Golden pocket Fibonacci support (0.5-0.618)
✓ Long-term Fibonacci support holding
✓ Clear upside gap to fill
✓ Defined risk below $80.68
━━━━━━━━━━━━━━━━━━━━━━━━━━━━━━━━━━━━
⚠️ RISK MANAGEMENT
- Contract: 81 DTE (03/20/26 expiry)
- Stop-loss: Price close below $80.68
- Profit targets: Breakeven at +25% of contract price, trailing half at +50%, exit at +100%
- Position size: Appropriate for 81 DTE timeframe
*Not financial advice.
*Trade at your own risk.