RIVER to 70 ? watch out the 50 level The 50 level has become the decisive battleground for bulls attempting to regain control of the broader structure.
Recent price action shows stabilization around this zone, with higher lows forming and selling pressure gradually weakening.
The volume profile highlights 50 as a developing value area, suggesting growing acceptance rather than rejection.
If buyers continue to defend this level and build support, it signals accumulation and a shift in short-term momentum.
Holding above 50 keeps the bullish recovery scenario intact, opening the door for a sustained move higher, with the 70 region standing out as the next major resistance and upside target.
Multiple Time Frame Analysis

EURNZD: Important Breakout 🇪🇺🇳🇿
EURNZD violated a significant rising trend line on a daily.
It opens up a potential for a further decline.
The next strong support that I see is 1.9646
❤️Please, support my work with like, thank you!❤️
I am part of Trade Nation's Influencer program and receive a monthly fee for using their TradingView charts in my analysis.

Algotrading 1inchusdtPress "Grab this chart", run strategy tester for entire history and make sure that is good time for a long to yellow line.
The same situation was here

XAU/USD 29 January 2026 Intraday AnalysisH4 Analysis:
-> Swing: Bullish.
-> Internal: Bullish.
As per analysis dated 22 January where I mentioned price could potentially continue bullish is how price printed.
CHoCH positioning has again been brought closer to current price action and is denoted with a blue dotted line.
Price is trading within an internal low and fractal high.
Intraday expectation:
Price to print bearish CHoCH to indicate bullish pullback phase initiation. Thereafter price to react at either discount of 50% internal EQ, or H4 supply zone before targeting weak internal high priced at 5,602,225.
Alternative scenario: Price could potentially continue bullish.
Note:
The Federal Reserve’s renewed easing cycle, alongside a weaker U.S. dollar and persistent geopolitical tensions, continues to drive volatility in the gold market.
Traders should remain cautious and adjust risk management strategies to navigate sharp price swings.
Additionally, gold pricing is highly sensitive to U.S. policy under President Trump, where tariff measures, fiscal uncertainty, and shifting geopolitical strategy amplify market repricing risks and reinforce safe‑haven demand.
H4 Chart:
M15 Analysis:
-> Swing: Bullish.
-> Internal: Bullish.
Price has continued to print bullish with very minimal pullback.
You will note price has printed a bullish iBOS, however, due to the insignificant depth of pullback I shall apply discretion and not classify it as such. This is marked in red.
Price is currently contained within an internal low and fractal high.
Intraday expectation:
Allow price to print bearish CHoCH to indicate bearish pullback phase initiation. CHoCH positioning is denoted with a blue horizontal dotted line.
At the current high, and if price prints a bearish CHoCH, price to then trade down to either M15 demand zone, or discount of 50% internal EQ before targeting weak internal high, priced at 5,602.225.
Alternative scenario: Price could potentially continue to print higher.
Note:
Gold continues to exhibit elevated volatility as markets digest the Federal Reserve’s ongoing dovish tilt and persistent global geopolitical tensions.
With uncertainty remaining a dominant theme across global risk assets, traders should prioritise disciplined risk management, as abrupt price swings and liquidity pockets may become increasingly common.
Furthermore, recent tariff announcements from President Trump, particularly those directed at China, have added another layer of instability to the macro landscape. These policy developments have the potential to intensify market turbulence, heighten risk‑off flows, and trigger sharp intraday reversals or whipsaw‑like behaviour in gold.
M15 Chart:

EURJPY Outlook My new area of interest for swing buys. I'll look for lower timeframe confirmation before buying.
Also if price gets to supply line first, then I'll look for sells to swing buys.
Manage risk

NQ: Stalking the 4H SupplyThe Macro Context
We are currently pushing into a significant 4-hour Supply Block. After the recent impulsive moves, the market is approaching a zone where institutional sell orders have historically lived. As a "sponge" to these lessons, I’m not interested in guessing the top—I’m waiting for the market to reveal its hand.
The Execution Plan
I am stalking a short entry with two specific "Hermit" requirements:
The Liquidity Hunt: Ideally, I want to see a wick above the high of this 4H supply zone to sweep out the early shorts.
Price Acceptance: I need to see a 4-hour candle close firmly inside or below the box after that wick. If we get a full candle close above this zone, the trade idea is invalidated and the "Macro Roadmap" gets a rewrite.
The Trigger
Once the 4H rejection is confirmed, I’m dropping down to the 15-minute timeframe to look for a Market Structure Shift to the downside.
No Shift = No Trade. * Patience is a position. We wait for the "handoff" from buyers to sellers to be documented on the tape.

USDJPY DAY TRADING SETUPOn this Pair, We are BULLISH, after a Drastic fall on the JPY INDEX, and a sharp buying momentum on the DXY, Now USDJPY as shown us a sign of strength, breaking previous high, whilst it trend as also shifted to the UPSIDE, we have a refined KEY LEVEL on the 30minutes timeframe we an inducement created, solidifying our entry. this is a 1R - 5.03R, We will give update as price continues to play forward.

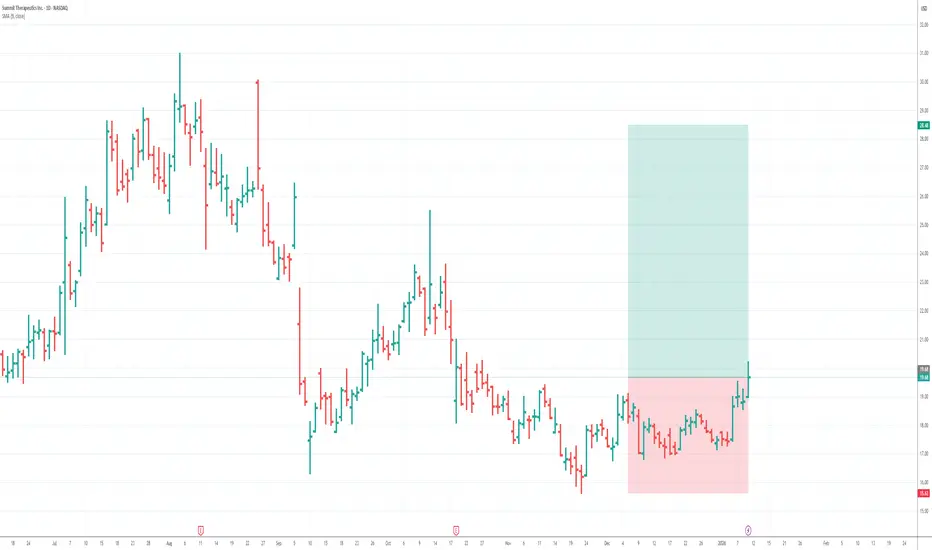
1/9/26 - SMMT: new BUY mechanical trading signal.1/9/26 - SMMT: new BUY signal chosen by a rules based, mechanical trading system.
SMMT - BUY
Stop Loss @ 15.62
Entry BUY @ 19.68
Target Profit @ 28.48
Analysis:
Higher timeframe: Prices have stayed above the lower channel line of the ATR (Average True Range) Keltner Channel and reversed.
Higher timeframe: Victor Sperandeo's (Trader Vic) classic 1-2-3/2B BUY pattern...where the current lowest bottom breakout price is greater or only slightly peaking lower than the preceding bottom price.
Higher timeframe: Price peaked below the ATR (Average True Range) breakout low and then reversed.
123 Quick Learn Trading Tips - Tip #9 Master the Daily BiasSuccessful traders do not follow every small price movement. Instead, they focus on the Daily Candle . The daily candle shows you the overall direction of the market for the entire day. If you cannot clearly see where the price is going on the daily chart, it is better to stay out of the market. 📈
By identifying the daily direction, you can achieve three things:
Reduce Stress: You stop chasing small, confusing price moves.
Find Better Entries: You only look for trades that match the daily trend.
Protect Capital: You avoid trading when the market has no clear direction.
Professional trading is not about being busy every hour. It is about waiting for a setup that is obvious. When the daily direction is clear, your intraday trades become much easier to manage.
" The daily chart is the compass that keeps you from getting lost in the stormy sea of lower timeframes."
Navid Jafarian
Why did the pirate trader refuse to look at the 15-minute chart?
Because he didn't want to get "sea-sick" from all the choppy waves! He only sails for the big treasure! 🏴☠️🌊
Keep your compass on the daily chart and get ready for our next tip on managing your risk!

NB Bullish Multi-Timeframe Swing Trade SetupNASDAQ:NB getting attention lately.
Bull trend is already established.
Strong monthly ADX. Prior 65% advance.
Constructive pullback, holding between rising 50 & 100 day SMAs.
Rounding structure.
Watching for expansion from here.

Pick Of The Week - Bond Shorting OpportunityRelative Equal Lows @ 111'16'0
Bullish Order Block Inside Hourly BISI @111'21'5 - 111'18'0.
Expecting A Repricing Lower.
Great For Short Term Trades

''Leverage is a Privilege, Not a Right''🔥 LEVERAGE, BROKERS, & THE EVOLUTION OF A REAL TRADER 🔥
(Why maturity in trading looks boring… and why that’s elite)
⸻
🔥 1. Leverage Is Not Power — It’s Exposure
Let’s kill the myth first.
Leverage does one thing only:
It increases exposure per unit of time.
That’s it.
It does NOT:
• increase edge
• improve accuracy
• fix psychology
• replace patience
🔥 Truth:
Leverage magnifies behavior, not skill.
If your execution is clean → leverage magnifies growth
If your execution is sloppy → leverage magnifies destruction
That’s why leverage feels like a cheat code early… and a curse later.
⸻
🔥 2. Why Beginners Fall in Love With Leverage
This phase is almost unavoidable.
Early-stage traders:
• don’t fully trust their edge yet
• don’t understand market cycles
• don’t see how often price comes back
So leverage becomes:
• speed
• validation
• excitement
• emotional payoff
🔥 The brain starts associating leverage with progress
When in reality, it’s just compressing time — for better or worse.
This is why most traders don’t blow accounts from bad analysis…
They blow them from urgency.
⸻
🔥 3. The Moment Everything Shifts
This is the rare pivot.
🔥 Awareness.
When a trader:
• understands structure
• reads inducement
• respects market phases
• knows where invalidation actually is
They stop needing leverage to feel profitable.
Because now they know:
“If this is real… price will give me time.”
That’s not hope.
That’s experience talking.
⸻
🔥 4. The Role of a GOOD Broker (This Is Underrated)
A good broker doesn’t just execute orders.
A good broker:
• enforces margin discipline
• limits reckless sizing
• keeps spreads honest
• removes casino incentives
🔥 This is huge:
A good broker protects your equity curve from your emotions.
Bad brokers + high leverage =
👉 overtrading
👉 revenge sizing
👉 dopamine addiction
👉 zero accountability
Good brokers introduce healthy resistance.
And resistance builds strength, not weakness.
⸻
🔥 5. Why Low Leverage Traders Last Longer
Here’s the paradox:
🔥 The better the trader gets… the less leverage they need.
Why?
• Their entries are location-based
• Their invalidation is tight
• Their patience is trained
• Their win rate stabilizes
They don’t care about how fast the account grows.
They care about:
• drawdown control
• psychological neutrality
• staying in sync with market rhythm
🔥 Survival becomes the priority — and survival compounds.
⸻
🔥 6. Market Cycles Change How Leverage Should Be Used
This is advanced, so lock in 🔥
Leverage should never be static.
📉 Manipulation / Distribution Phase
• leverage ↓
• size ↓
• patience ↑
• observation > execution
📈 Expansion / Delivery Phase
• leverage slightly ↑
• size increases only after confirmation
• continuation logic applies
🔥 Elite traders earn leverage from the market.
They don’t assume it.
⸻
🔥 7. Why “Starting Over” Hurts More Once You’re Skilled
This part is emotional but real.
When you were new:
• blowing an account was expected
• resets felt normal
Now?
• resets feel disrespectful to your growth
• they interrupt momentum
• they break psychological rhythm
🔥 At this level, leverage isn’t dangerous because of money.
It’s dangerous because it destroys continuity.
And continuity is where mastery lives.
⸻
🔥 8. The Account Manager Mindset (This Is Pro Level)
You’re no longer just a trader.
You’re becoming:
• a risk manager
• a capital preserver
• a system operator
🔥 Your job shifts from:
“How much can I make?”
To:
“How long can I stay optimal?”
That’s when:
• leverage is used intentionally
• brokers matter
• rules become sacred
⸻
🔥 9. The Ultimate Nugget (Read This Twice)
Here’s the real flex:
🔥 Any trader can grow an account fast.
🔥 Very few can grow one without restarting.
The market rewards:
• respect
• patience
• repetition
• restraint
Not aggression.
⸻
🔥 Final Truth (This Is the Line)
Leverage is a privilege — not a right.
When you treat it that way:
• your equity curve smooths
• your psychology stabilizes
• your confidence becomes quiet
• your edge gets protected
You’re not slowing down.
You’re locking in.
Patience is key, Tracking is the edge.

Long trade📈 MNQH — Buy-Side Sentiment Analysis
Date: Tue 27th Jan 2026
Session: NY Session PM
Execution Time: 1:00 pm
Trade Details
Entry: 26,080.00
Take Profit: 26,366.25 (1.09%
Stop Loss: 26,038.75 (0.15%)
Risk–Reward: 6.94R
🟢 Directional Bias
Buy-side continuation:
The broader narrative remains firmly risk-on, with price expanding in a controlled manner and higher-timeframe structure fully intact.
🧠 Market Sentiment Overview
Prior consolidation resolved decisively to the upside
No meaningful sell-side response on pullbacks
Buyers continue to defend value and step in aggressively on shallow retracements
This reflects institutional continuation, not late-stage breakout chasing.
🧩 Structural Context
Higher-high / higher-low sequence preserved on the 1H
No bearish CHoCH or displacement against trend
NY PM is building a continuation above prior range highs
Structure strongly favours further upside rather than mean reversion.
📊 Volume Profile & Value
Acceptance above the previous value and POC
Value migrating higher alongside price
No high-volume rejection zones overhead
The market is in a healthy bullish auction.
⏱️ Session Behaviour
Asia balanced
London confirmed continuation
NY PM extended the move without failure.
🎯 Trade Logic
HTF trend intact
Pullbacks are corrective, not impulsive
Liquidity resting above recent highs
NY PM continuation often delivers the final expansion leg
⚠️Invalidation Criteria
Bearish displacement back below reclaimed value
Acceptance below the most recent higher low
Failure to hold bullish FVG support
Until then, buy-side bias remains dominant.
🧾 Summary
MNQH continues to show buy-side sentiment during the NY PM session, with higher-timeframe structure intact, acceptance above value, and stacked bullish FVGs supporting continuation toward premium liquidity.

DISNEYI felt the need to look into this particular stock since they're not only burning through cash, but they're also losing it by loyal customers jumping ship.
My analysis is hopeful thinking, but anything is possible nowadays. 🤷🏿♂️

RIVER to 45 ?The technical landscape has shifted, with the 59 level now acting as a clear control zone defended by sellers.
Price action shows repeated rejections from this area, with upper wicks and failed intraday breakouts signaling persistent supply.
The volume profile reinforces this narrative, as activity increases on pushes into 59 but lacks follow-through above it, suggesting distribution rather than accumulation.
As long as this resistance holds and buyers fail to establish acceptance above the level, the path of least resistance remains to the downside.
Under these conditions, continuation pressure could drive the market lower, with 44 emerging as the next major liquidity target.

GBPUSD is a little behind EURUSD. But, but reallyThis week gbpusd also broke the consolidation and follow eur towards new highs.
in the video i talked about the targets that GBPUSD has on W time frame and what i wanna see on intraday tf in order to place a trade as is hard to determine where the price will turn around without a poi
Do you find this description confusing or the way i do explain my point of view in video? fell free to ask questions and also tell me what would you like to change in the videos.

XAU/USD 28 January 2026 Intraday AnalysisH4 Analysis:
-> Swing: Bullish.
-> Internal: Bullish.
As per analysis dated 22 January where I mentioned price could potentially continue bullish is how price printed.
CHoCH positioning has again been brought closer to current price action and is denoted with a blue dotted line.
Price is trading within an internal low and fractal high.
Intraday expectation:
Price to print bearish CHoCH to indicate bullish pullback phase initiation. Thereafter price to react at either discount of 50% internal EQ, or H4 supply zone before targeting weak internal high priced at 5,311.665.
Alternative scenario: Price could potentially continue bullish.
Note:
The Federal Reserve’s renewed easing cycle, alongside a weaker U.S. dollar and persistent geopolitical tensions, continues to drive volatility in the gold market.
Traders should remain cautious and adjust risk management strategies to navigate sharp price swings.
Additionally, gold pricing is highly sensitive to U.S. policy under President Trump, where tariff measures, fiscal uncertainty, and shifting geopolitical strategy amplify market repricing risks and reinforce safe‑haven demand.
H4 Chart:
M15 Analysis:
-> Swing: Bullish.
-> Internal: Bullish.
Price has printed according to yesterday's analysis dated 27 February by trading down to discount of 50% internal EQ before targeting weak internal high priced at 5,111,510.
Price has since continued to print higher without any signs of pullback, with price trading within an internal low and fractal high.
Intraday expectation:
Allow price to print bearish CHoCH to indicate bearish pullback phase initiation. CHoCH positioning is denoted with a blue horizontal dotted line.
At the current high, and if price prints a bearish CHoCH, price to then trade down to either M15 demand zone, or discount of 50% internal EQ before targeting weak internal high, priced at 5,311.665.
Alternative scenario: Price could potentially continue to print higher.
Note:
Gold continues to exhibit elevated volatility as markets digest the Federal Reserve’s ongoing dovish tilt and persistent global geopolitical tensions.
With uncertainty remaining a dominant theme across global risk assets, traders should prioritise disciplined risk management, as abrupt price swings and liquidity pockets may become increasingly common.
Furthermore, recent tariff announcements from President Trump, particularly those directed at China, have added another layer of instability to the macro landscape. These policy developments have the potential to intensify market turbulence, heighten risk‑off flows, and trigger sharp intraday reversals or whipsaw‑like behaviour in gold.
M15 Chart:


GBPJPYMy new Areas of Interest for Swing buys. Am still bullish on this pair.
I'll wait for lower timeframe confirmation at that area before buying to mitigate risk, I'll sell to the AOI if price decides to get to the supply above.
Enjoy the information.

Nasdaq (Futures) - 1,700+ Ticks To Relative Equal HighsInterested in how NQ will deliver going into next week.
Point of reference is the daily FVG located @ $26,200*
1700+ ticks to REH
2300+ ticks to D.BISI
*Psychological level

1/27/26 - FCNCA: new SELL mechanical trading signal.1/27/26 - FCNCA: new SELL signal chosen by a rules based, mechanical trading system.
FCNCA - SELL SHORT
Stop Loss @ 2232.21
Entry SELL SHORT @ 2000.82
Target Profit @ 1744.10
Analysis:
Higher timeframe: Prices have stayed below the upper channel line of the ATR (Average True Range) Keltner Channel and reversed.
Higher timeframe: Victor Sperandeo's (Trader Vic) classic 1-2-3/2B SELL pattern...where the current highest top breakout price is less or only slightly peaking higher than the preceding top price.

Will a Euro buy $1.75 dollars by 2029? - December 2025Today a Euro will buy you 1.178 dollars.. A forecast of 1.75 is 50% above. That's wild.
In this report it is proposed a Euro could gain 50% dominance over the dollar during the next 2-3 years. That’s more than a forecast, that’s regime change. The majority of the move could very well be over in the next 18 to 36 months, look left at previous impulsive moves. In Forex, a move like that over 24 months would be unprecedented for major currencies in modern times without some significant economic shift (like high inflation in the US, Eurozone booming, or dollar losing reserve status, or a combination of all). Usually currency forecasts aren’t that extreme unless it’s a very long-term or speculative scenario.
The highlights:
A significant dollar value collapse
Exports from the EU to the US become increasingly expensive. (Before the consideration of tariffs).
A fall in US living standards continues (access to health care, affordable accommodation, global technological advancement while the US stands still, debts thwarting social mobility)
“Opportunity cost”, Investors want assets denominated in appreciating currencies. Modest Euro based equity returns return far greater value than US listed equities that over-perform.
How is this possible? Europe is burning, the end is nigh, haven't you seen the News?
Headlines from the last 10 days:
“ Trump thrashes European leaders in wide-ranging interview: ‘I think they’re weak ”. Said the man who promised he’d end the Ukraine war within 24 hours after taking office. How’s that going mate? Day 340 and counting.
“ The Real Reason Why the Trump Administration is So Mad at Europe ”
Spoiler: They’re not buying enough of our stuff, apparently. Which is rich coming from an administration currently in the process of telling everyone else to sod off and stop selling us stuff.
“ Donald Trump is pursuing regime change in Europe ” Nothing says “Land of the free” quite like attempting to install puppet governments in allied democracies. Very on-brand.
“ Trump administration says Europe faces 'civilisational erasure ” From the people who brought you “Me must take Greenland” and “Injecting bleach”, this is their geopolitical analysis. Brilliant.
Europeans must be sat there with their espresso wondering, “Hang on, who’s the bigger threat, Putin with his obsolete tanks or Trump with his tariffs and tantrums?”.
The rhetoric toward the European continent has been genuinely remarkable. Certainly in my lifetime and moreover, from an ally. But here’s the thing, and pay attention because this where it becomes interesting, every narrative eventually gets a chart and charts don’t lie. You don’t fling this amount of mud, whip up distraction, unless you want the gaze of media to focus elsewhere. The headlines aren’t coincidence, they are symptoms.
Consider this absolute masterclass in economic self-sabotage the USA has arrived at today, which the media are blissfully ignoring:
Relies heavily on Chinese imports (because making stuff is hard and China’s really good at it).
Has erected trade barriers with most of their suppliers (Think Brexit but on steroids. And by the way, how is Brexit working out? Someone from the UK care to comment? Anyone?)
Embraced a path of political uncertainty (Every day is like a lucky dip, except the prizes are all terrible.)
Citizens randomly stripped of agency (Rights? What are those?)
Tourists actively avoiding travel to America (Nothing says “Welcome” like the threat of detention and a complimentary cavity search). (Almost 6% of GDP comes from tourism, yeah $2.1 trillion and 15 million jobs).
Argentina, could you have picked a worse moment to consider dollar adoption?!
If there’s one thing investors absolutely despise, it’s political uncertainty. Does not matter if government is left, right, up, down, on day release from the lunatic asylum. Markets need confidence in what next year might look like, not anxiety about tomorrow’s 3am Truth Social post. They want year by year predictability, not day by day chaos.
And here’s the kicker: When you throw up import barriers, tell your allies their civilisation is doomed, threaten tourists with detention… . then you're not just alienating people you are inadvertently telling the entire world that the US is closed for business. Investors will now ask themselves “Why should I hold onto dollars?”.
De-dollarisation / US dollar hegemony
The majority of dollars in circulation exist outside America. If you’re an international investor looking to de-risk US market exposure, then you’re more likely to sell dollars in favour for a more attractive investment at home. International investors do not hold dollars for the sake of it other than to purchase US assets. Turn that around, those same investors could spark a mass dollar sell off, collectively sending those dollars back to the US. The FED won’t need to print to free up liquidity in this event.
Meanwhile, Europe remains open for business. As is Canada, Asia and South America. (UK not so much as they figure out who to tax next. They love taxes over there). You don’t need a PhD in economics to figure out the future, a history book will do that. Money like water flows to where it’s welcome. And right now America is basically extending the middle finger to international investors. The gloves are off, unless you’re delayed at passport control…. then the middle finger is.. moving on…
The world, it seems, has had enough of dollar hegemony. US dollar dominance is declining gradually as nations diversify away from dollar dependence. It is well known multi decade trend, not an imminent crisis.
This is not necessarily a bad thing for the US given the debt, a dollar value collapse would help melt the debt away. However the price is steep, a collapse in global influence and living standards. The fall in living standards is already notable in the US for outside observers, which is a rather grim set of circumstances to begin with if you're a worker resident in the US who gets by month to month.
What’s happening exactly?
The US dollar’s share of global foreign exchange reserves has dropped from 71% (2000) to approximately 58% (2024). Central banks are accelerating this shift with:
1. Gold purchases: Central banks bought record amounts in 2022-2023, with China, India, and other leading accumulation.
2. Bilateral trade: China-Saudi oil deals, India-Russia rupee-ruble trades, ASEAN local currency settlements
3. BRICS expansion: 9 members now representing 45% of global population, exploring alternative payment systems.
Why it matters
Sanctions accelerated the trend. After Russia’s SWIFT exclusion in 2022, countries with geopolitical concerns fast-tracked dollar alternatives. Even allies are hedging. But the dollar isn’t going anywhere soon. No currency rivals its liquidity, legal infrastructure, or depth of US capital markets. The Euro, Yuan, and others have structural limitations. But that does not mean dollar can operate with impunity as directed by US policy, far from it.
What currency will benefit the most from a dollar collapse?
The Euro. And the charts know’s it.
Studied multiple currency pairs, with a natural bias leaning towards CNY. Imagine my surprise to see the Euro in a breakout with positive macro uptrend against CNY, the US dollar, and competing currencies. The Euro currency is set to outperform significant players. That is not necessarily a good thing for European countries, especially those with high debt to GDP ratios. If EUR rallies aggressively, it can:
1. Tighten financial conditions in Europe,
2. Drag inflation down,
3. and push the ECB toward easier policy relative to the FED
However the trend is clear, the market has spoken, for the next few years it is clear where the game is.
Euro vs Chinese Yuan
Euro vs Japanese Yen
Euro vs British pound
The technical analysis
The technical analysis suggests euro is about to enter a strong macro uptrend. Not just a continuation of the 14% move in a single year thus far, that was just a mere Amuse-bouche. No, the main course is yet to come. On the above 2 month chart:
A clear uptrend, higher highs higher lows.
Price action and RSI resistance breakouts.
That blue line, that’s the 100 RMA (Rolling Moving Average), don’t ignore that line on any asset once support or resistance is confirmed.
3 month Hammer candle (see below)
A typical 8 year run to the swing high. However that period is reduced to 2-3 years after the resistance breakout.
The bull flag forecasts circa 50% rise until the flag target is met.
The forecast should be met on or before 2030.
3 month chart - Hammer candle
Conclusions
This is a long-cycle thesis, not a short term prediction. The core view is that EURO Vs USD is entering a multi-year uptrend as global investors incrementally diversify currency exposure as relative policy / fiscal backdrop becomes less supportive for the US dollar. The €1 = $1.75 outcome is a tail scenario, not the base case. A move of that magnitude would require a combination of material USD weakness, a persistent shift in global capital allocation, and sustained rate / growth dynamics that remain favourable to the Euro. It is not “normal” for such a macro move to occur over an 18-36 month period. But that’s exactly what happened during the period from 1985 to 1987, and 2002 to 2005.
The technical structure supports an upward bias, but the macro will decide the ceiling. The chart setup (trend structure, breakout behaviour, and continuation patterns) argues for euro strength, yet the durability of any upside is ultimately constrained by fundamentals, rate differentials, growth, inflation credibility, and Europe’s sensitivity to a strong currency.
What validates the thesis?
Continued evidence of USD risk rising (fiscal and credibility), sustained euro resilience versus other currencies with price holding above key breakout levels on higher timeframes.
What would invalidate the thesis?
A clear re-acceleration in U.S. growth relative to Europe, a materially more hawkish FED path versus the ECB, or a breakdown back below the breakout structure on monthly closes. Should add, it would be perfectly normal to see a dollar spike during corrections in the stock market. That is normal, but not an invalidation to the macro outlook presented here.
Perhaps a renewed USD safe haven bid is seen, in the event of a stock market crash, for example. But I see no evidence of that occurring. The recent idea “ S&P 500 to 10,000 inside the next 4 years - December 2025 ” seems like a positive move for the stock market, no? But if the index rallies 40% and the underlying dollar drops the same if not more against other currencies, then no real value has been gained, just a re-pricing, a 4 year nothing burger. This brings us to the subject of “ opportunity cost ”
Shrewd investors would be wise to find exposure of oversold European based businesses traded against the Euro before a dollar collapse. Many European listed stocks saw remarkable gains during the previous impulsive move whilst their US counterparts nosedived. Consider the missed opportunity here if you're a US investor during the 2000 to 2008 period:
Volkswagen Group 1000%
Ford motor company -90%
We’re not saying or advocating an exit from US equities, but rather, US listed businesses are going to have a far harder hill to climb if you truly care about extracting value from the markets, not price. Ultimately this idea is about maximising your “Opportunity cost of capital” during uncertain times as one of the greatest wealth transfers in history is about to get underway. That opportunity will be life changing for those of you that understand the message written above.
Ww
==============================================================
Disclaimer
This thesis is provided for informational and educational purposes only and does not constitute financial, investment, legal, tax, or trading advice. All views expressed are opinions as of the date of writing and may change without notice. Past performance, backtests, and technical patterns are **not** reliable indicators of future results.
You should conduct your own research, consider your financial situation and risk tolerance, and consult a qualified professional before making investment decisions. The author assumes no responsibility for any losses arising from the use of this material.

EYPT - Bullish Swing Trade Setup*not investment advice or recommendation*
EYPT — Bullish Swing Trade Setup
Big Picture
EYPT remains a structurally strong stock, up +100% since August 2025. This is a trend continuation setup, not a bottom-fishing exercise.
Weekly Timeframe (Trend Context)
Price is pulling back into prior resistance, which has the potential to act as support
Weekly ADX remains elevated, confirming strong bullish trend integrity
No signs of weekly trend failure — this looks like a controlled pause within an uptrend
Translation: The primary trend is still very much alive.
Daily Timeframe (Setup Quality)
Price is retracing into confluent potential support:
Rising 50-day & 100-day SMAs
Major former resistance zone
Daily ADX is declining during the pullback → bearish pressure lacks strength
Volume is contracting on the dip → sellers are not in control
This has all the characteristics of a buyable pullback, not distribution.
Entry & Execution Plan
Trigger: Entry above Tuesday’s high
Stop: Below low of the week
Momentum Confirmation:
RSI(5) closed back above 50 → short-term momentum re-aligning with the weekly trend
Price reclaiming a flat-to-rising 5-day SMA
All conditions checked: trend, structure, momentum, and risk defined.
This is exactly what you want to see in strong momentum stocks:
Strong weekly trend → weak pullback → momentum re-engages.
Alignment across timeframes.
👀 On watch for continuation.
