Silver Monthly Using the Schiff Pitchfork and realigning it to key structural pivots reveals a compelling long-term setup. When combined with Fibonacci retracement and extension levels, the projected move suggests a multi-year structural advance in silver.
Pivot Points

Gold BuyAs per previous post, overall bias wa buying continuation. We didn't get the full TP on the sell but there was apotential for 1:2.5 RR
The buy is being taken on that strong bullish break through Asia and London highs. We had a retest of that zone and strong rejection.
Looking to secure a 1:2 RR whish is just above the 50% Hi-ADR.
There is potential for price to go and test the recent ATH created considering the current global economic factors

XRP Short-term analysis | Trading and expectationsCRYPTOCAP:XRP
🎯Price printed a bullish engulfing 3 white knight candle pattern, reclaiming the daily pivot and heading to test the daily 200EMA. Overcoming this will be very bullish. Wave 1 of 3 appears to be underway locally.
📈 Daily RSI has bearish divergence has been negated with yesterdays pump
👉 Analysis is invalidated below the swing low $1.8, keeping the downtrend alive.
Safe trading

SUI Short-term analysis | Trading and expectationsCRYPTOCAP:SUI
🎯Price printed a 3 white knight bullish engulfing pattern, reclaiming the daily pivot. Wave 3 of a new uptrend appears to be underway with a target of the daily 200EMA followed by $3.1
📈 Daily RSI bearish divergence has been negated
👉 Analysis is invalidated below $1.31, keeping the downtrend alive
Safe trading

SOL Short-term analysis | Trading and expectationsCRYPTOCAP:SOL
🎯Price caught a strong bid moving bullishly above the daily pivot but struggling at the High Volume Node resistance. Wave 1 of a new motif wave appears to be underway with an inital target of the daily 200EMA.
📈 Daily RSI has bearish divergence, price must get above $145 to negate this or face further downside.
👉 Analysis is invalidated below wave C, $110
Safe trading

ONDO Short-term analysis | Trading and expectationsLSE:ONDO
🎯Price printed a 3 white knight bullish engulfing pattern, jumping above the daily pivot and the descending resistance trend-line. Price must get above $0.5 to negate the bearish divergence that has emerged. Wave 1 of a new uptrend appears to be underway.
📈 Daily RSI tapped oversold with bullish divergence, where it caught a bid.
👉 Analysis is invalidated below the swing low, $0.35
Safe trading

Nifty Analysis EOD – January 6, 2026 – Tuesday🟢 Nifty Analysis EOD – January 6, 2026 – Tuesday 🔴
Expiry Day Drama: Supply at 26275 Triggers Indecision as Heavyweights Drag.
🗞 Nifty Summary
The Nifty started with a 45-point Gap Down, diverging from the positive cues indicated by Gift Nifty. The first five minutes were extremely volatile, covering a 94-point range as the index filled the gap and slipped before recovering. Nifty attempted to breach the PDC but faced stiff resistance at the 26275 level and a descending trendline, which pushed prices back to the day’s low.
Most of the session was spent in a narrow 40-50 point range between 26155 (Support) and 26200 (Resistance). A dramatic 2 PM breakdown of the IBL/Day Low turned into a fakeout, with the index snapping back into the range to close at 26,178.70 (-0.27%), below the Previous Day Low.
Despite Nifty holding some green patches intraday, heavyweights Reliance and HDFC saw significant corrections, leading to an overall inconclusive and divergent sentiment.
🛡 5 Min Intraday Chart with Levels
🛡 Intraday Walk
The session’s core movement was effectively contained within the first five minutes; the rest of the day was an “inside-IB” struggle.
The supply wall at 26275 was the defining feature of the morning, while the 26155 zone acted as a resilient floor. The 2 PM fakeout below the IBL was a classic expiry day liquidity hunt, trapping aggressive shorts before reverting to the mean.
The divergence in heavyweights like Reliance and HDFC against the broader index kept the directional conviction low, confirming that while the index looked stable, the underlying pillars were under pressure.
📉 Daily Time Frame Chart with Intraday Levels
🕯 Daily Candle Breakdown
Open: 26,189.70
High: 26,273.95
Low: 26,124.75
Close: 26,178.70
Change: −71.60 (−0.27%)
🏗️ Structure Breakdown
Type: Small bearish candle (Spinning Top structure)
Range (High–Low): ≈ 149 points → Moderate intraday volatility
Body: ≈ 11 points → Extremely small real body, signaling total indecision
Upper Wick: ≈ 84 points → Strong rejection from the 26,275 supply zone
Lower Wick: ≈ 54 points → Buyers defended the 26,125 zone
📚 Interpretation
The candle is a portrait of equilibrium and overhead supply. The long upper wick confirms that every attempt to push toward the previous highs was met with aggressive selling. However, the lower wick prevents a bearish engulfing, showing that the 26100-26150 support cluster is still active. Closing almost at the open price after such a wide swing highlights a market waiting for a fundamental or news trigger.
🕯 Candle Type
Indecision Candle with Long Upper Wick — Signals heavy supply at higher levels; confirmation is required from the next session to determine if this is a top or a pause.
🛡 5 Min Intraday Chart
⚔️ Gladiator Strategy Update
ATR: 168.76
IB Range: 114.65 → Medium
Market Structure: Balanced
Trade Highlights:
No Trade Day
Trade Note:
The system declared a No Trade Day for four critical reasons: 1) High-risk Weekly Expiry volatility; 2) 70% of the daily Gladiator range was consumed within the Initial Balance (IB); 3) Mixed sentiment where major stocks were green/neutral while heavyweights corrected, making short bets risky; 4) A total lack of directional clues.
Staying away from the market was the most profitable action today to preserve capital.
🧱 Support & Resistance Levels
Resistance Zones:
26210 ~ 26235
26275 (Immediate Supply)
26320
Support Zones:
26104 (Crucial Support)
26070
26030
25985
🧠 Final Thoughts
“The 26,100 level is the current line in the sand.”
The day was inconclusive, but the battle lines are clear. The 26,100 zone is vital for maintaining any bullish sentiment.
For the upcoming session: if Nifty opens with a Gap Up above 26,210 and manages to cross 26,275 with sustainability, the bulls regain control.
However, if the index fails to hold 26,100, the bears—who are already in the driving seat following today’s heavyweight correction—will likely target deeper supports.
✏️ Disclaimer
This is just my personal viewpoint. Always consult your financial advisor before taking any action.

HBAR Short-term analysis | Trading and expectationsCRYPTOCAP:HBAR
🎯Price caught a strong bid on bullish divergence, flipping the local structure bullish. However, bearish divergence has emerged at High Volume Node resistance. Price is above the daily pivot, which is bullish, but has a long way to go to reach the daily 200EMA.
📈 Price must get above $0.148 to negate the bearish divergence.
👉Analysis is invalidated below the swing low, keeping wave 2 alive.
Safe trading

ETH Short-term analysis | Trading and expectationsCRYPTOCAP:ETH
🎯Wave 1 appears to have completed a leading diagonal. Wave 2 appears complete with the recent higher high. Price was rejected at the daily 200EMA but is attempting to break through again. Overcoming this will be very bullish, especially as we are above the daily pivot.
📈 Daily RSI is printing bearish divergence. A move above wave (1) is essential to negate this, or prices could head to new local lows.
👉 Analysis is invalidated below wave (2)
Safe trading

DOGE Short-term analysis | Trading and expectationsCRYPTOCAP:DOGE
🎯 Price printed a bullish engulfing 3 white knight candle pattern. It is above the daily pivot, showing a bullish trend is emerging, but still below the daily 200EMA. Overcoming this will be very bullish. The Elliot wave count is tricky, so I will await more confirmation.
📈 Daily RSI has printed bullish divergence. The RSI shot up too hard and fast, which often results in a reversal, potentially testing the daily pivot as support.
👉 Analysis is invalidated below the swing low, keeping the downtrend alive
Safe trading

BTC Short-term analysis | Trading and expectationsCRYPTOCAP:BTC
🎯The bottom appears to be in as Bitcoin climbs the wall of worry once more. However, a break above $94295 is needed to negate the bearish divergence appearing in the daily RSI. Wave (3) appears to be underway; we should expect a strong move in the coming days/weeks. The first resistance will be the daily 200EMA; overcoming this will be bullish. Price is above the daily pivot, showing a bullish trend emerging.
📈 Daily RSI is creeping to overbought with bearish divergence now negated at a High Volume Node resistance.
👉 Analysis is invalidated below wave (2), bringing up the downside target $76600
Safe trading

BNB Short-term analysis | Trading and expectationsCRYPTOCAP:BNB
🎯Price has closed above the daily 200EMA and daily pivot, suggesting a new bull trend has taken hold. If this is wave (3), we should expect a strong breakout in the coming days/weeks towards the all-time high. Wave 4 appears complete, with a textbook ABC correction ending at High Volume Node support.
📈 Daily RSI is currently showing bearish divergence across many altcoins, including BNB. A push above wave (1) will negate this divergence.
👉 Analysis is invalidated below wave (2), daily pivot and 200EMA.
Safe trading

FRVP INDICATOR TOOL ON BTCUSDThe frvp tool helps you to predict the future of the market. do well to follow me or inbox me for further explanations

AAVE Short-term analysis | Trading and expectationsCRYPTOCAP:AAVE
🎯 Price printed a bullish engulfing candle from daily RSI bullish divergence and High Volume Node support. It is currently testing the pivot. Overcoming this will add confidence to the bullish move, with a first target of the daily 200EMA and High Volume Node resistance at $220. Overcoming the daily 200EMA will add confluence to a major bottom being in.
📈 Wave (C) of triangle wave (D) appears to be underway. Daily RSI sits at the channel EQ and is crossed bullishly.
👉 Analysis is invalidated if we drop below $148, keeping wave (B) alive.
Safe trading

Relief rally Inbound? IMX is shaping up for a potential reversal.
After the aggressive October 10 sell‑off, price responded with a clean Automatic Rally (AR) before rolling over into a controlled pullback. This latest dip appears to be sweeping the October 10 lows, and the December 19 bullish engulfing candle is the first meaningful sign of demand stepping back in.
Crucially, price closed back inside the prior range, which keeps the structure constructive. While heavier volume on the reversal would’ve added confidence, the low‑volume nature of the sweep actually supports a spring narrative — supply has been drying up for weeks, and there’s been no evidence of aggressive selling pressure. That’s exactly what you want to see heading into a potential Wyckoff spring.
Trade Scenario
Initial TP would be just below the range EQ which lines up with the yearly pivot and 50% of the range retracement. From here, if the price can close, hold and form higher lows above this level, would strongly suggest that a bottom is in. The next meaningful upside target sits around $0.58, where prior resistance and structural alignment converge.
Market Context
A surprising number of alts are printing similar spring‑like structures right now:
• Washed‑out lows
• Diminishing volume
• Reclaims back into range
• Early signs of demand returning

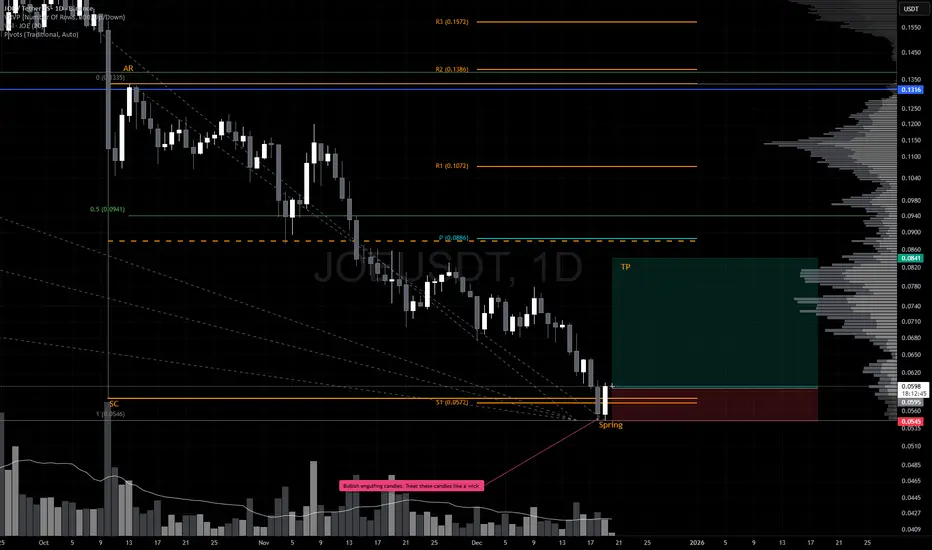
Relief Rally Inbound? JOE is shaping up for a potential reversal.
After the aggressive October 10 sell‑off, price responded with a clean Automatic Rally (AR) before rolling over into a controlled pullback. This latest dip appears to be sweeping the October 10 lows, and the December 19 bullish engulfing candle is the first meaningful sign of demand stepping back in.
Crucially, price closed back inside the prior range, which keeps the structure constructive. While heavier volume on the reversal would’ve added confidence, the low‑volume nature of the sweep actually supports a spring narrative — supply has been drying up for weeks, and there’s been no evidence of aggressive selling pressure. That’s exactly what you want to see heading into a potential Wyckoff spring.
Trade Scenario
Initial TP would be just below the range EQ which lines up with the yearly pivot and 50% of the range retracement. From here, if the price can close, hold and form higher lows above this level, would strongly suggest that a bottom is in. The next meaningful upside target sits around $0.1296, where prior resistance and structural alignment converge.
Market Context
A surprising number of alts are printing similar spring‑like structures right now:
• Washed‑out lows
• Diminishing volume
• Reclaims back into range
• Early signs of demand returning
Relief Rally Inbound? S is shaping up for a potential reversal.
After the aggressive October 10 sell‑off, price responded with a clean Automatic Rally (AR) before rolling over into a controlled pullback. This latest dip appears to be sweeping the October 10 lows, and the December 19 bullish engulfing candle is the first meaningful sign of demand stepping back in.
Crucially, price closed back inside the prior range, which keeps the structure constructive. While heavier volume on the reversal would’ve added confidence, the low‑volume nature of the sweep actually supports a spring narrative — supply has been drying up for weeks, and there’s been no evidence of aggressive selling pressure. That’s exactly what you want to see heading into a potential Wyckoff spring.
Trade Scenario
Initial TP would be just below the range EQ which lines up with the yearly pivot and 50% of the range retracement. From here, if the price can close, hold and form higher lows above this level, would strongly suggest that a bottom is in. The next meaningful upside target sits around $0.16593, where prior resistance and structural alignment converge.
Market Context
A surprising number of alts are printing similar spring‑like structures right now:
• Washed‑out lows
• Diminishing volume
• Reclaims back into range
• Early signs of demand returning

Relief Rally Inbound? VET is shaping up for a potential reversal.
After the aggressive October 10 sell‑off, price responded with a clean Automatic Rally (AR) before rolling over into a controlled pullback. This latest dip appears to be sweeping the October 10 lows, and the December 19 bullish engulfing candle is the first meaningful sign of demand stepping back in.
Crucially, price closed back inside the prior range, which keeps the structure constructive. While heavier volume on the reversal would’ve added confidence, the low‑volume nature of the sweep actually supports a spring narrative — supply has been drying up for weeks, and there’s been no evidence of aggressive selling pressure. That’s exactly what you want to see heading into a potential Wyckoff spring.
Trade Scenario
Initial TP would be just below the range EQ which lines up with the yearly pivot and 50% of the range retracement. From here, if the price can close, hold and form higher lows above this level, would strongly suggest that a bottom is in. The next meaningful upside target sits around $0.0194, where prior resistance and structural alignment converge.
Market Context
A surprising number of alts are printing similar spring‑like structures right now:
• Washed‑out lows
• Diminishing volume
• Reclaims back into range
• Early signs of demand returning

EURCAD: Strong Bullish Sentiment 🇪🇺🇨🇦
EURCAD broke and closed above a significant supply cluster
on a 4h time frame.
It opens a potential for more growth.
The next strong resistance that I see is 1.6167.
The price will likely reach that soon.
❤️Please, support my work with like, thank you!❤️
I am part of Trade Nation's Influencer program and receive a monthly fee for using their TradingView charts in my analysis.

Gold SellGold has been very bullish. While overall bias is buys, seeing a potential for a short terms sell.
Waiting on a reaction of Asia high / exhaustion zon for a 1:3 sell to the Asia lows / exhaustion zone.
If we remain above yesterday's EQ, will look for buying continuation.

GBPUSD -Breaking old highsThis is why is important to zoom out your charts. GBPUSD is currently breaking old highs from the 3RD Quarter from 2025 from June-September. Even though your analysis can be accurate on the small-time frames this is the reasons why you still lose a trade because you simply didn't zoom out the timeframe and pay attention on what's going on in the big picture. New highs are being created in current price while taking out old highs from 3-6months ago. Yes, it can reverse but this is how u prevent yourself to get stopped out. Once you know what's going on, on the big timeframes then you can lower your timeframe for and entry and accuracy.

USDHCF I Weekly CLS Range I Model 1 Hi friends, new range created. As always we are looking for the manipulation in to the key level around the range. Don't forget confirmation switch from manipulation phase to the distribution phase to make the setup valid. Stay patient and enter only after change in order flow. If price reaches 50% of the range take partial or full close. 👊 Your ultimate goal as a trader is not to be a generalist who knows 100 patterns. But rather create one system with narrowed criteria of each element of the trade to remove subjective and emotional decisions as much as possible and stick to this system no matter what. Practice it everyday become a MASTER.
I promised myself I’d become the person I once needed the most as a beginner. Below are links to a powerful lessons I shared on Tradingview. Hope it can help you avoid years of trial and error I went thru.
📊 Sharpen your trading Strategy
⚙️ 100% Mechanical System - Complete Strategy
🔁 Daily Bias – Continuation
🔄 Daily Bias – Reversal
🧱 Key Level – Order Block
📉 How to Buy Lows and Sell Highs
🎯 Dealing Range – Enter on pullbacks
💧 Liquidity – Basics to understand
🕒 Timeframe Alignments
🚫 Market Narratives – Avoid traps
🐢 Turtle Soup Master – High reward method
🧘 How to stop overcomplicating trading
🕰️ Day Trading Cheat Code – Sessions
🇬🇧 London Session Trading
🔍 SMT Divergence – Secret Smart Money signal
📐 Standard Deviations – Predict future targets
🎣 Stop Hunt Trading
💧 Liquidity Sweep Mastery
🔪 Asia Session Setups
🧠 Level Up your Mindset
🛕 Monk Mode – Transition from 9–5 to full-time trading
⚠️ Trading Enemies – Habits that destroy success
🔄 Trader’s Routine – Build discipline daily
💪 Get Funded - $20 000 Monthly Plan
🧪 Winning Trading Plan
🛡️ Risk Management
🏦 Risk Management for Prop Trading
📏 Risk in % or Fixed Position Size
🔐 Risk Per Trade – Keep consistency
Adapt useful, Reject useless and add what is specifically yours.
David Perk

Induslnd Bank Bullish viewLogic: Indusind bank being in uptrend, there are 2 possible scenarios that can occur.
Scenario 1: If price retraces to the demand zone formed at 870 levels a long opportunity can be seen as the zone is in line with 21 DEMA.
Scenario 2: If the price breaks the previous day high, or gaps up above the previous day high, the entry can be made at previous day high and stop loss at or below the previous day low.
A target of 1:3 can be kept.
