WAVESAPP could be another BOPI see a symptoms of bullish breakout. Targets and Support are mentioned on chart
Pivot Points

TIA is still bullish (4H)In my view, TIA remains bullish overall and the higher-timeframe structure is still constructive. At the moment, price action suggests that a triangle pattern is forming, indicating a phase of consolidation before the next potential expansion.
From the recent low, buyers stepped in aggressively, pushing the price upward with strong momentum and clear bullish intent. This impulsive move confirms that demand is still present and active in the market. After this rally, price has now entered a corrective phase, which appears healthy and technical rather than a sign of weakness.
This correction is likely the final correction within the triangle structure, specifically corresponding to Wave E of the triangle. If this interpretation is correct, the market is currently completing the last leg of consolidation before a potential breakout.
We have identified two entry zones, and positions should be built using a DCA (Dollar-Cost Averaging) approach to manage risk and improve average entry price. These zones are aligned with key support levels and the internal structure of the triangle.
🎯 Targets are clearly marked on the chart, based on the projected breakout of the triangle and prior resistance levels.
❌ Invalidation:
This bullish scenario will be invalidated if a daily candle closes below the invalidation level marked on the chart. A confirmed daily close below that level would indicate a breakdown of the structure and require a reassessment of the bias.
As long as price remains above the invalidation level, the bullish bias remains intact, and this consolidation should be viewed as a potential accumulation phase rather than a distribution.
If you have a coin or altcoin you want analyzed, first hit the like button and then comment its name so I can review it for you.
This is not a trade setup, as it has no precise stop-loss, stop, or target. I do not publish my trade setups here.

Nifty Analysis EOD – January 14, 2026 – Wednesday🟢 Nifty Analysis EOD – January 14, 2026 – Wednesday 🔴
Harami Cross at the Edge: Bulls and Bears Battle for the 25,600 Line.
🗞 Nifty Summary
The Nifty opened with a 60-point Gap Down, but buyers quickly intervened, filling the gap within minutes to test the 25,750 ~ 25,780 resistance zone. After multiple failed attempts to break out, the index slipped back toward the day’s low, finding temporary refuge at a bullish trendline.
A second recovery attempt successfully breached the IBH and the resistance zone, marking a day high of 25,791.75.
However, the joy was short-lived; a sharp rejection followed, snapping the trendline and dragging the index through the CDO and IBL. Nifty eventually tested the PDL (25,603) with precision, sparking a late 111-point bounce to close at 25,665.60.
The result is a Harami Cross pattern on the daily chart, signaling deep indecision as the index remains trapped within the previous day’s range.
🛡 5 Min Intraday Chart with Levels
🛡 Intraday Walk
Today was a theatre of high-octane drama. The charts show a relentless tug-of-war, with the index climbing and sliding sharply as both camps fought for dominance.
The rejection from the 25,790 area confirms that sellers are still heavily active at higher levels, but the “Double Bottom” effect near 25,600 (testing today’s low of 25,603.95 against yesterday’s 25,603.30) shows that bulls are not ready to surrender this psychological floor.
The intraday trendline failure at 1:30 PM was the pivotal moment for bears, while the final recovery from the PDL saved the bulls from a catastrophic breakdown.
📉 Daily Time Frame Chart with Intraday Levels
🕯 Daily Candle Breakdown
Open: 25,648.55
High: 25,791.75
Low: 25,603.95
Close: 25,665.60
Change: −66.70 (−0.26%)
🏗️ Structure Breakdown
Type: Doji Candle (Harami Cross).
Range (High–Low): ≈ 188 points — moderate volatility.
Body: ≈ 17 points — weak directional conviction.
Upper Wick: ≈ 143 points — massive rejection from higher supply zones.
Lower Wick: ≈ 45 points — localized buying support near the PDL.
📚 Interpretation
The Harami Cross, appearing within the massive range of January 13, indicates a total standoff. The long upper wick (143 points) is the most telling feature, proving that every attempt to sustain above 25,750 is being met with aggressive selling. However, the fact that Nifty closed 15 points above its opening (CDO) and held the 25,600 support suggests a base is attempting to form.
🕯 Candle Type
Bearish Rejection / Indecision Candle — Highlights overhead supply; the market is coiling for a breakout from this Harami structure.
🛡 5 Min Intraday Chart
⚔️ Gladiator Strategy Update
ATR: 211.39
IB Range: 123.15 → Medium
Market Structure: Balanced
Trade Highlights:
11:27 Long Trade: SL Hit (Bulls trapped during the failed IBH breakout).
13:32 Short Trade: Target Hit (R:R 1:2.59) (High-conviction Trendline Breakout).
14:23 Short Trade: SL Hit (V-shape bounce from PDL support).
Trade Summary: A mixed day for the strategy. While the 1:2.59 short trade perfectly captured the trendline collapse, the extreme volatility near the range extremes (IBH and IBL) resulted in two stop-loss hits. The net result remains protective in a non-trending “Balance” market.
🧱 Support & Resistance Levels
Resistance Zones:
25693
25750 ~ 25780 (Major)
25820
25855 ~ 25880
Support Zones:
25600 (Critical)
25550
25475
🧠 Final Thoughts
“The 25,600 Line in the Sand holds... for now.”
Today confirmed that while the bulls have the heart to defend 25,600, they lack the lungs to climb past 25,800.
Today confirmed that while the bulls have the heart to defend 25,600, they lack the lungs to climb past 25,800.
We are officially in a “Squeeze” zone. The market is coiling, and the next directional move will be determined by a breakout from this tight “Harami Cross” structure.
For tomorrow, I’m watching the 25,600 level like a hawk; if it snaps, the floor is far below, but before that, bulls might attempt 25750 once again.
✏️ Disclaimer
This is just my personal viewpoint. Always consult your financial advisor before taking any action.

Buyers are waiting to re-enter XLM (8H)After creating a series of bearish moves, the market maker aggressively pushed the price upward in a sharp impulse move. During this strong rally, it is important to note that price not only formed a Bullish Change of Character (CHoCH), but also reclaimed key levels, confirming a shift in market structure from bearish to bullish.
Early buyers who entered alongside the market maker at lower prices have already secured their first round of profits, which has led to the current price correction / pullback. This retracement appears to be a natural and healthy reaction after a strong impulsive move, rather than a sign of weakness.
Traders who have already taken profits, along with new buyers, are now waiting for lower and more discounted prices to re-enter the market. Once sufficient buying interest returns at these levels and accumulation is completed, XLM has the potential to initiate another bullish move to the upside.
Trade Setup & Risk Management
To properly manage risk and plan a structured entry, a clear trading setup has been prepared around major support levels. These support zones are areas where we expect buyers to step back in.
We have two planned entry points, and positions should be entered using a DCA (Dollar Cost Averaging) strategy to improve average entry price and reduce risk in case of short-term volatility.
Targets & Invalidation
All targets are clearly marked on the chart.
At Target 1, it is recommended to secure partial profits.
After reaching the first target, move the stop loss to Break Even to protect capital.
If the stop loss is hit, this setup will be invalidated, and the bullish scenario should be reconsidered.
Final Notes
As long as price holds above the key support zones and the bullish structure remains valid, the overall bias stays bullish. Always trade with proper risk management and discipline.
⚠️ This analysis is for educational purposes only and not financial advice.
If you would like us to analyze a coin or altcoin for you, first like this post, then comment the name of your altcoin below.

XAUUSD Short: Fails at Supply Zone, Sellers Regain ControlHello traders! Here’s a clear technical breakdown of XAUUSD (1H) based on the current chart structure. XAUUSD recently completed a strong bullish leg within a well-defined ascending channel, but momentum started to fade as price reached the major Supply Zone around 4,620–4,630. This area acted as a key rejection zone, where aggressive selling pressure appeared, leading to a clear breakdown from the ascending channel and signaling a shift in short-term market control. After the breakdown, price attempted to recover but failed to regain acceptance above the former structure. The rebound moved into a corrective phase and is now trading below the Supply Line, suggesting that the recent upside is corrective rather than impulsive. The market structure has transitioned into lower highs, reinforcing bearish pressure.
Currently, XAUUSD is approaching the 4,540–4,560 area, which aligns with a prior breakdown level and dynamic resistance from the descending supply line. This zone is expected to attract sellers again. Below current price, the Demand Zone near 4,520 is the first key support. A clean break below this level would confirm bearish continuation and open the door for a deeper move lower.
My scenario: As long as XAUUSD remains below the 4,620–4,630 Supply Zone and continues to respect the descending supply structure, the bearish bias remains valid. I expect price to show rejection from the current pullback zone and push lower toward 4,520 (TP1). A breakdown and acceptance below 4,520 would expose further downside toward 4,480–4,460 (TP2). However, a strong bullish breakout and acceptance back above 4,600–4,630 would invalidate the short scenario and suggest renewed bullish continuation. For now, structure favors sellers while price trades below supply. Manage your risk!

Sell to buyPrice continued to create a new ATH during Asia, then dropped to the R1 level, creating support.
Currently price is at the Asia exhaustion and looking for a potential sell on a rejection and second 15 min candle flip for a potential 1:2 RR.
Then we are looking for price to react to Asia exhaustion, which is also a 71% retracement on the fib.
Will consider a buy towards the highs as price will probably continue the buying momentum.
Important to note that we have high impact news today (CPI) so possible high volatility.

$MSTR — Multi-Month Support in Play
NASDAQ:MSTR is sitting right on multi-month support, and it’s hard for me to see this breaking much lower. The last time we highlighted this setup, it delivered a very clean move — I’m adding it here again for reference.
This is a straightforward swing trade to hold over the next couple of months.
What I’m expecting:
* Near-term resistance around 300–350
* Bigger picture: a test of new ATHs remains on the table if momentum builds
I’m adding here and would be open to adding more if price dips closer to the yearly open.
Simple structure, defined risk, and a clear path if the market continues to firm up.

AUD/USD, AUD/JPY, EUR/AUD SetupsSome decent setups are emerging across Australian dollar pairs. In particular, I am looking for a deeper pullback in AUD/USD and a bounce in EUR/AUD before losses resume. Whether we see a shallow or deeper pullback in AUD/JPY may ultimately depend on whether Japan’s Ministry of Finance (MOF) intervenes in the currency market.
Matt Simpson, Market Analyst at City Index.

Market makers will soon pump ETHEREUM (8H)Ethereum is continuing to develop a bullish structure.
On the iCH chart, we are observing clear bullish signals. Currently, the price is trading around a key support/resistance level, which has historically acted as a strong decision point for market participants.
The upper order blocks above the current price have already been mitigated and absorbed, meaning that the price now faces less resistance to move upward. This significantly increases the probability of a continued bullish move in the near term.
Given this context, we should be focusing on buy/long opportunities. There are two main entry points, which can be used strategically through a DCA (Dollar-Cost Averaging) approach. Entering gradually allows us to manage risk while taking advantage of potential upward momentum.
Targets are clearly marked on the chart. At the first target, it is recommended to take partial profits to lock in gains, and then move your stop-loss to break-even to protect your capital. This approach allows us to participate in the remaining move toward higher targets without unnecessary risk.
Always remember to manage your risk properly and avoid over-leveraging. The structure suggests that Ethereum has the potential for a strong upward movement, but patience and discipline are key.
In summary:
Trend: Bullish continuation
Chart signal: iCH bullish
Key level: Currently testing a major level
Order blocks: Upper blocks mitigated, price has a clear path
Entry: Two points, DCA recommended
Targets: Marked on chart; take partial profit at first target, move stop to break-even
Strategy: Focus on risk management while participating in the bullish momentum
If you would like us to analyze a coin or altcoin for you, first like this post, then comment the name of your altcoin below.

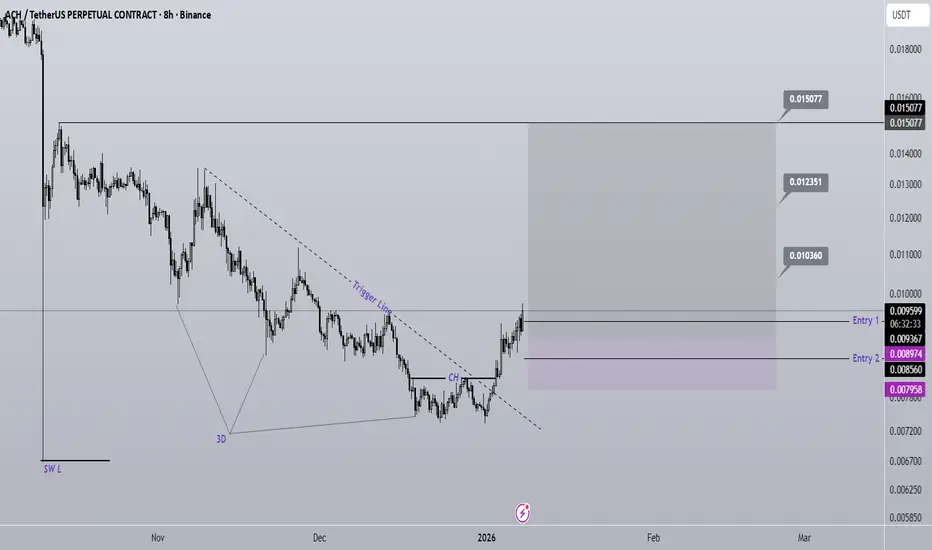
ACH will experience a strong pump soon (8H)The price has formed a bottom at a 3D pattern. This pattern indicates the liquidation of sellers, after which the price typically rebounds upward.
Our confirmation comes from the break of the trigger line. For some time, the price was unable to break this trigger line, but now it is trading above it, which clearly shows that buyers are strong.
Additionally, we have a bullish CH (Change of Character) on the chart, further confirming that strong buyers have appeared.
The current structure supports buy/long positions, which is why we are focusing on looking for long entries.
There are two entry points, which should be taken using a DCA (Dollar-Cost Averaging) strategy to manage risk and optimize the position.
Targets are marked on the chart. At the first target, consider taking partial profits, and then move your stop-loss to the entry point to protect your capital while keeping the remaining position active for potential further upside.
In summary:
Pattern: 3D bottom indicating seller liquidation
Confirmation: Price breaking above the trigger line
Bullish signal: CH on the chart
Strategy: Buy/long positions with DCA entries
Risk management: Partial profit at first target, stop-loss at entry
This setup highlights a strong bullish structure, giving traders a clear framework to participate while managing risk efficiently.
If you would like us to analyze a coin or altcoin for you, first like this post, then comment the name of your altcoin below.
ATOM is still bullish (8H)ATOM price has recently shown a sharp and powerful impulsive move from the bottom, which clearly indicates the presence of strong institutional and smart money buyers. This aggressive reaction from demand zones suggests that buyers are in control of the market structure at the moment.
The bullish momentum is very strong, and price is respecting higher highs and higher lows. As long as this momentum remains intact, minor pullbacks and shallow corrections can be considered healthy and optimal opportunities to enter Buy/Long positions, rather than signs of weakness.
From a market structure perspective, we can clearly identify a Bullish Change of Character (CHoCH) on the chart. This CH confirms that the previous bearish structure has been broken and the market has officially shifted into a bullish phase. Additionally, price is currently trading around key levels, which further increases the importance of this zone and validates the bullish scenario.
Entry Strategy (DCA Approach)
We have two potential entry zones, marked on the chart. These entries can be executed using a DCA (Dollar Cost Averaging) strategy to reduce risk and improve the average entry price. This approach allows better position management in case of short-term volatility.
Targets & Trade Management
All targets are clearly marked on the chart.
At Target 1, it is recommended to secure partial profits to reduce exposure.
After reaching the first target, move the stop loss to Break Even to protect capital and allow the trade to run risk-free.
Remaining positions can be held towards higher targets as long as bullish structure and momentum remain valid.
Final Thoughts
As long as price holds above key support levels and maintains its bullish structure, the overall bias remains bullish. Always manage risk properly and avoid over-leveraging, especially in volatile market conditions.
⚠️ This analysis is not financial advice. Always do your own research and manage risk accordingly.
If you would like us to analyze a coin or altcoin for you, first like this post, then comment the name of your altcoin below.

ARB Buy/Long Signal (4H)Market makers are currently building a bullish structure accompanied by a corrective phase. During this process, they often use both time-based and price-based corrections to force retail traders out of otherwise correct positions. These corrective phases are designed to create confusion, emotional pressure, and impatience among traders.
The bullish momentum of the impulse move has been strong, but the recent correction has been mostly time-based rather than price-based. From a price perspective, the pullback has been relatively weak, which actually supports the bullish scenario. However, this type of slow and choppy consolidation tends to shake out traders, causing many to enter positions too early or lose patience. As a result, some traders end up closing their positions at a loss, while otherswho initially entered in the correct direction—exit prematurely. Once this shakeout is complete, price often continues strongly to the upside.
Currently, ARB is trading around major key levels, and on the chart we can clearly identify a Bullish Change of Character (CHoCH). This structural shift confirms that the market bias has changed and that the higher-timeframe structure is now supportive of Buy/Long positions.
Given that the overall structure favors bullish continuation, it is more optimal to use the recent correction as an opportunity to enter Buy/Long positions near key support zones, rather than chasing price at higher levels.
Entry Plan & Risk Management
We have two predefined entry zones, marked on the chart, and positions should be executed using a DCA (Dollar Cost Averaging) approach to improve average entry price and reduce exposure to short-term volatility.
If you decide to enter a position, remember that risk management always comes first. Define your risk clearly, size your position appropriately, and remain patient once you are in the trade.
Targets & Trade Management
All targets are clearly marked on the chart.
At Target 1, it is recommended to secure partial profits.
After taking partial profit, move the stop loss to Break Even to protect capital and allow the trade to continue risk-free.
As long as the bullish structure remains valid and key support levels hold, the probability continues to favor further upside.
⚠️ This analysis is for educational purposes only and not financial advice.

VRAusdt at Risk Key Support Under PressureVRA remains under sustained downside pressure, with price now approaching a critical support base that must hold to preserve the broader structure. This zone represents a key inflection point; failure to defend it would significantly weaken market confidence and could accelerate further downside risk.
If buyers successfully defend this level, a technical rebound is expected, with the bullish recovery path and upside objectives clearly outlined on the chart.

CO.PA LONG - RSI extreme positive divergenceSince long this stock shows positive divergence on the chart.
Something is going to happen.
A bit speculative, but don't miss the chance to make profit of this signal.

Nifty Analysis EOD – January 13, 2026 – Tuesday 🟢 Nifty Analysis EOD – January 13, 2026 – Tuesday 🔴
Fib 0.618 Defense: Expiry Day Rollercoaster Ends in 296-Point Volatility!
🗞 Nifty Summary
The Nifty started the session with a promising 90-point Gap Up, seemingly continuing yesterday’s bullish momentum. However, the optimism evaporated instantly as the index dived 195 points from the first tick, hitting the 25,700 mark.
After forming a temporary base and recovering 120 points to 25,820, Nifty encountered a textbook Double Top pattern, which triggered a second collapse back to the day’s low. A period of consolidation followed before a final flush-out broke the IBL, dragging the index to a day low of 25,603.30.
Interestingly, this low coincided exactly with the Fib 0.618 level, sparking a violent 150-point recovery to close at 25,714.20 (-0.22%).
While heavyweights like Reliance, LT, and Trent acted as major anchors, the intraday swings provided a paradise for agile traders.
🛡 5 Min Intraday Chart with Levels
🛡 Intraday Walk
The day was a masterclass in “stop-hunting” and liquidating over-leveraged positions on both sides. The initial “Open = High” (almost) structure led to a vertical drop that trapped morning bulls.
The recovery to 25,820 was promising until the Double Top confirmed that the bears weren’t finished. The breakdown to 25,603 was the ultimate “capitulation” move. The subsequent sharp recovery suggests that the 0.618 Fibonacci level is being defended as a major structural floor.
Despite the bearish close, the massive 129-point lower wick indicates that demand remains potent at the extreme discount zone.
📉 Daily Time Frame Chart with Intraday Levels
🕯 Daily Candle Breakdown
Open: 25,897.35
High: 25,899.80
Low: 25,603.30
Close: 25,732.30
Change: −57.95 (−0.22%)
🏗️ Structure Breakdown
Type: Bearish candle with a long lower wick.
Range (High–Low): ≈ 296 points — exceptionally high intraday volatility.
Body: ≈ 165 points — reflects firm selling pressure from the opening gap.
Upper Wick: ≈ 2 points — zero buying strength observed near the highs.
Lower Wick: ≈ 129 points — strong, aggressive buying rejection from the Fibonacci base.
📚 Interpretation
The candle is a portrait of a market in flux. Opening at the top and closing significantly lower confirms that the morning gap was used as a massive distribution window.
However, the recovery of nearly 130 points from the lows (the lower wick) confirms that the 25,600 zone is a high-demand territory. The market is oscillating violently, looking for a stable equilibrium after the recent “Phoenix” recovery.
🕯 Candle Type
Bearish Candle with Strong Lower-Wick Rejection — Signals heavy overhead supply but strong underlying support at the 0.618 Fibonacci level.
🛡 5 Min Intraday Chart
⚔️ Gladiator Strategy Update
ATR: 214.01
IB Range: 198.95 → Medium
Market Structure: Balanced
Trade Highlights:
10:04 Long Trade: Target Hit (R:R 1:1.08) (Trendline Breakout)
12:41 Short Trade: Target Hit (R:R 1:1.95) (IBL Breakout)
Trade Summary: Despite the chaotic expiry day swings, the strategy remained disciplined. The morning long capture was a quick scalp before the Double Top formed. The afternoon Short trade on the IBL breakdown was the high-conviction move of the day, capturing the slide toward the Fib 0.618 target.
🧱 Support & Resistance Levels
Resistance Zones:
25820
25855 ~ 25880
25940 (Crucial)
Support Zones:
25600
25550
25475
🧠 Final Thoughts
“The Fibonacci levels don’t lie, even on expiry day!”
Today’s price action proves that 25,600 is the line in the sand for the bulls.
If we gap down below this tomorrow, things could get ugly. But if we sustain above it, the “reversal” story is still on the table.
I’ll let President Trump decide if he wants to tweet the Nifty back to 26,000 or if he’s too busy “hiring and firing” to worry about our 0.618 levels! Let’s see what the opening tick brings on Wednesday.
✏️ Disclaimer
This is just my personal viewpoint. Always consult your financial advisor before taking any action.

Elite | XAUUSD – 4H WEEK ANAKYSIS | Bullish ContinuationPEPPERSTONE:XAUUSD
Gold has transitioned from accumulation into a sustained bullish expansion. Pullbacks are corrective and shallow, indicating strong demand. Price is trading above the bullish trendline with no structural breakdown, suggesting continuation toward higher liquidity levels rather than reversal.
Key Scenarios
✅ Bullish Case 🚀 → Continuation above trendline with targets toward upside liquidity and premium imbalance zones.
❌ Bearish Case 📉 → Only valid if price breaks and closes below the bullish structure trendline, invalidating the higher-low sequence.
Current Levels to Watch
Resistance 🔴: 4,600 → 4,720 → 4,800
Support 🟢: 4,520 – 4,500 (trendline + pullback base)
⚠️ Disclaimer: This analysis is for educational purposes only. It is not financial advice.

XAUUSDLooks at gold prices are at ATH,i still believe price will push even higher as the higher lows on the 1hr has been taken out for liquidity,price did fail to give a lower low at 4,508 saying to me that buyers are potentially getting ready to drive price to the ⬆️ upside,price went further to reclaim the broken higher low that was taken out for,now I watch and wait on Newyork to drive price up or down

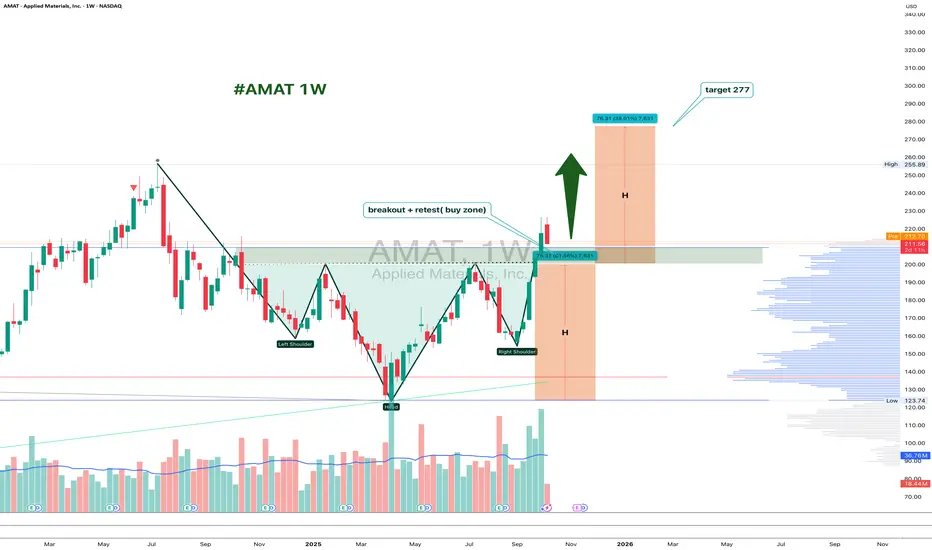
AMAT 1W: Retesting the Neckline Before the Next Move?On the weekly chart, Applied Materials (AMAT) has completed a clean inverted head and shoulders breakout around $226, and is now pulling back to retest the neckline zone near $200–211.
This area acts as strong support. If buyers defend it, the bullish pattern stays valid, with a projected target around $277, matching the 1.618 Fibonacci extension.
From a fundamental perspective, AMAT remains a key semiconductor player, benefiting from ongoing demand for chip-making equipment. The pullback looks more like a healthy pause than weakness - a classic chance for latecomers to re-enter.
Funny enough, the “head and shoulders” pattern, known for signaling tops, is doing the exact opposite here - apparently, even the market likes a good plot twist.
Brutal Reveral candleThat reversal candle perfectly hit the top of my bear flag channel yesterday. This stock is going down. 3.20s first stop but a break there and the lows of the past 12 months come into play.

BTC Local Trend. Reversal Zone. Targets. Tactics. 23 12 25Logarithm. Time frame: 1 day.
Local downtrend. After the decline, the price is trapped in sideways consolidation for a long time (the idea is for stop-loss levels to accumulate on both sides). Price is near the breakout zone.
Buy fear in parts, sell joy in parts.
🟢 Upward breakout (trend + key local levels and, due to the short stop-loss domino effect, momentum) — fulfillment of the Dragon pattern's targets (first targets).
🔴 Downward breakout (support and long stop-loss zone) — fulfillment of the descending flag's targets (long stop-loss domino effect), at least partially.
More upside than downside, possible through stop-loss accumulation. But it's important to wait for a breakout in one direction or another.
A patient and consistent person will be rewarded, while a restless person will not.
Use trigger orders on both sides of the reversal zone:
1️⃣ for an upward breakout in the market (marker order) - 2 local zones;
2️⃣ and simultaneously for a decline - 2-3 trigger limit orders.
If you do this, you won't have to constantly monitor charts, news, opinions, and so on like a speculative addict, and you won't care at all which way the price goes. After all, your orders will trigger in the direction of the trend, and won't trigger (cancel them later) in the opposite direction. The exception is if your first orders hit a false exit, but this is taken into account in risk management and position allocation.
Risk should always be justified and controlled by you. This is the foundation of everything. If this isn't the case, you're building a speculative house on a clay foundation, trying only to guess the price. Sooner or later, it will collapse, and the later it happens, the more painful it will be.

ROIV: Failed Breakout → Reclaim Setup With Defined RiskROIV has spent the past ~4 weeks digesting a strong +70% run, forming a tight base with only a ~7% pullback. A recent breakout attempt didn’t stick, but price held the top of the prior base and found support at the 50-DMA.
I opened a half-size position on the reclaim, with risk clearly defined. A decisive close below the 50-day would invalidate the setup and I’d step aside before the stop is hit.
If price continues to cooperate, I’ll look to take some off near +3% and then again at the ATH to reduce risk, and then see if the rest can work.

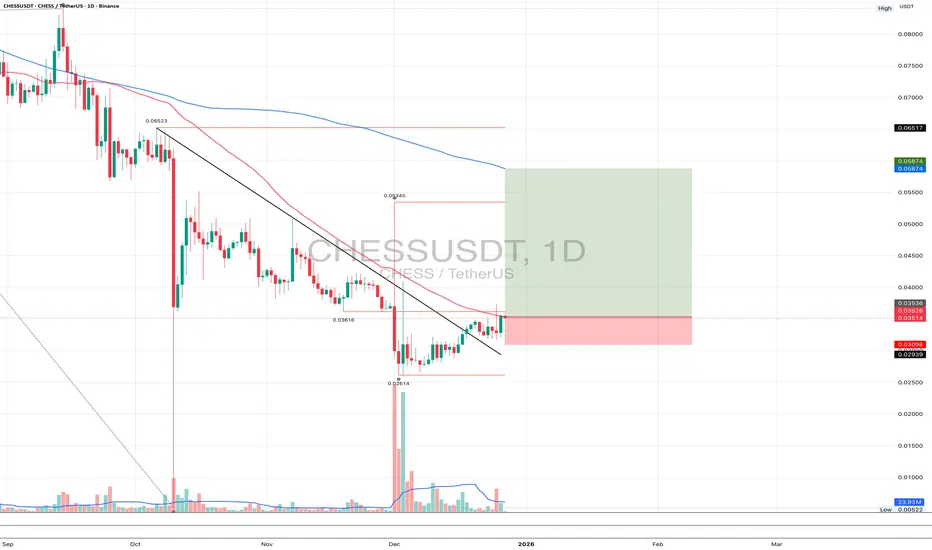
CHESSUSDT 1DShort technical update 👇
On the daily timeframe, CHESS broke its bearish structure and completed a clean retest of the breakout level. The retest held, selling pressure is fading, and higher local lows are forming. The current structure suggests a recovery phase after a prolonged decline. The base scenario is a continuation to the upside with a move toward the MA200 as the next key mid-term target.
Nifty Analysis EOD – January 12, 2026 – Monday🟢 Nifty Analysis EOD – January 12, 2026 – Monday 🔴
The Phoenix Recovery: Bulls Resurrect Nifty with 340-Point V-Shape Swing!
🗞 Nifty Summary
After hitting multi-month lows, the Nifty performed a spectacular “Phoenix Recovery.”
The session started flat but quickly turned into a bloodbath as the index plunged 172 points to find initial support at 25,530. A symmetrical triangle formed near the lows, eventually breaking down to test the 25,473 level.
However, as noted in previous sessions, the market was deeply oversold. Fueled by short covering and potential positive news, Nifty executed a vertical reversal, reclaiming the 25,750 ~ 25,780 resistance zone with ease.
The index closed at 25,790.25 (with intraday highs hitting 25,806.10), effectively wiping out the morning panic and signaling a powerful structural reversal.
🛡 5 Min Intraday Chart with Levels
🛡 Intraday Walk
The day was a tale of two halves. The morning belonged to the bears, who exploited the initial flat open to drive a high-velocity sell-off toward the 25,470 zone.
The symmetrical triangle breakdown looked like a final flush-out of weak hands. The afternoon, however, saw one of the sharpest recoveries in recent history.
The vertical ascent crossed the 25,750 barrier without any significant pullback, leaving late-entry bears trapped at the bottom.
The close near the day’s high confirms that the “oversold” spring has finally uncoiled.
📉 Daily Time Frame Chart with Intraday Levels
🕯 Daily Candle Breakdown
Open: 25,669.05
High: 25,813.15
Low: 25,473.40
Close: 25,790.25
Change: +106.95 (+0.42%)
🏗️ Structure Breakdown
Type: Bullish Rejection Candle.
Range (High–Low): ≈ 340 points — extreme intraday volatility.
Body: ≈ 121 points — reflecting strong bullish participation in the second half.
Upper Wick: ≈ 196 points — massive rejection of lower prices, signaling a potential bottom.
Lower Wick: ≈ 23 points — minimal resistance at the close.
📚 Interpretation
The massive lower wick (nearly 200 points) is a classic “Hammer” signal appearing after a prolonged downtrend. It indicates that supply has been exhausted and demand has aggressively returned. The close above the opening price, despite the deep early plunge, is a high-conviction signal that the short-term sentiment has flipped from “Sell on Rise” to “Buy on Dip.”
🕯 Candle Type
Bullish Rejection / Hammer-Like Recovery Candle — Traditionally marks the end of a bearish sequence; follow-through above 25,820 is now critical.
🛡 5 Min Intraday Chart
⚔️ Gladiator Strategy Update
ATR: 204.84
IB Range: 171.90 → Medium
Market Structure: ImBalanced
Trade Highlights:
10:58 Short Trade: Target Hit (R:R 1:1.71) (Symmetrical Triangle Breakout)
12:04 Long Trade: Target Hit (R:R 1:6.34) (Trendline Breakout)
Trade Summary: A legendary day for the Gladiator Strategy. While the morning short trade captured the final flush-out, the 12:04 PM Long signal on the trendline breakout was the star performer. It captured the entire V-shape reversal, delivering a massive 1:6.34 R:R as Nifty relentlessly marched toward the day’s high
🧱 Support & Resistance Levels
Resistance Zones:
25820
25855 ~ 25880
25940 (Crucial)
Support Zones:
25600
25550
25475
🧠 Final Thoughts
“The bulls have found their spine.”
Technically, this is a perfect reversal setup, but caution is still the word of the day.
I am staying neutral-to-bullish but will remain cautious until we get a decisive daily close above 25,940. As for the weekend “Trump Fate,” it seems the market decided not to wait for a tweet to start the recovery! Let’s see if he provides the “HUGE” momentum needed to cross the 26K hurdle again, or if this was just a short-covering bounce. For now, let’s watch the opening tick tomorrow with a smile.
✏️ Disclaimer
This is just my personal viewpoint. Always consult your financial advisor before taking any action.
