USDJPY - Bullish BatTo all the crazy supporters of USDJPY, your chance to long this pair has come in an aggressive setup.
So why is this an aggressive setup?
The market has not reversed back to 143.09 to give further confirmation of the market movement. If you are a Bat Pattern Trader, you should know that.
I'd take this on an aggressive approach; remember to place stop-loss below X, which happens to be at the tip of the buy zone.
Rsioversold

NZDUSD - Bullish CrabA bullish crab setup with RSI Divergence could be encouraging for counter-trend traders. However, you must be aware there is a potentially Bullish Shark pattern on the daily chart.
Despite that, I will wait for buying opportunity at 0.6104.

GBPUSD - Demand ZoneGBPUSD is on a bearish run; I know counter-trend traders are waiting for the opportunity to engage in the trade.
You have to be patient; wait for a 3-bar reversal before engaging in the trade.

How to trade intraday pullbackHello friends,
Market finally picked a direction and it looks like it's gonna continue downtrend. Many novice traders are long biased and they find it very difficult to trade in down-trending market. Today, I am going to share a simple strategy for making quick gains by trading pullback in a downtrend.
Below is a chart of NASDAQ:AMZN in daily timeframe. You can see that price is in a downtrend.
Below is 5 minutes timeframe chart of NASDAQ:AMZN .
You can see that above chart fulfills all the rules mentioned below. For this trade, Risk to Reward ratio is 1:3.
Checklist -
1. Price is making LL while RSI is making HL - Bullish Divergence(highlighted in the chart)
2. RSI is below 30 - Price is oversold
3. Price is showing signs of reversal - Long lower wick candle(highlighted in the chart)
4. Above three confluences occurs during the first 1.5 hours of market open before market goes into mid-day chop
5. Risk to Reward ratio is at least 1:2 (shown in the chart)
Entry -
1. Enter at the next candle open after reversal confirmation
Exit -
1. Set Stop-loss below the recent low
2. Set Target at the first resistance

$1750 is the level to watchETH has been looking particularly strong throughout this relief rally, but I'm expecting resistance around $1750-$1800. This is a strong historic support/resistance level, and we can expect short pressure to pick up and long pressure to drop off substantially here. So a break above this level would tell me the bulls are back firmly in control.
It's also worth noting that we saw the weekly RSI dip below 30 at the recent local bottom ($880). The last time that happened was at the 2018 bear market bottom. I think the price action around $1750 will provide a lot of insight as to whether $880 is our current bear market bottom, or just another local bottom of a continuing bear market.

Confluence Test for this Week's CandleCOINBASE:BTCUSD
Right now, we are currently testing a $17,000 - $19,000 weekly candle support on $BTCUSD, while the 14 week RSI oscillator is oversold (<30). I'm hoping that by the close of the weekly candle, the RSI and candle for this week will either:
Ex1. Close above the $17-19K support zone AND above 30 RSI or,
Ex2. Close below the $17-19K Support zone AND below 30 RSI.
This will give us confluence in determining if we continue to go to lower in price (Ex 2.) or HOLD $17-19K as weekly support.( Ex 1.) If the RSI and price candle do not close both above OR both below their respective levels, it is still ambiguous if this $17-19K weekly level will act as support or transition to resistance.
I will be on the lookout for this coming Sunday night weekly candle close.
***DISCLAIMER: NOT INVESTMENT ADVICE***

GBPUSD-Weekly Market Analysis-Jun22,Wk2If you are looking to ride on the wave on the daily chart, either the late entry of the ABCD Pattern or engage the trade based on Potential Head and Shoulders setup, your chance is here. When the market opens wait for candlestick confirmation at 1.2369, the Bullish Deep Gartley Pattern. This is a counter-trend trade move and might inverse the Bearish Shark Pattern setup that you are in. It is important for those who have engaged the shark pattern to shift stop-loss to entry.
You can now see that it is important to follow a coach who shares with you analysis before it happens and it is important to like that analysis that you are learning from, and that is because when you've related ideas, you will receive the notification and learn from it.

BTC on Track for its 8th Consecutive Weekly Loss Are We OversoldBitcoin (BTC) is on track to record losses for the eighth week in a row, the longest streak of losses in history. Before this streak, the previous biggest consecutive weekly losses were recorded in December 2014, when Bitcoin was worth just a few hundred USD and was down for five weeks in a row.
Is Bitcoin Oversold?
Despite the severe sell-off, Bitcoin is still not oversold, according to the most popular momentum oscillators. Bitcoin’s current weekly RSI reading of 33.67 shows that we aren’t oversold just yet. The RSI oscillator would need to fall below 30, or even 20, to be considered oversold.
Meanwhile, the stochastic oscillator has entered oversold readings, but unlike the RSI, it has the tendency to stay in oversold readings longer, as it is more volatile and quick to react.
By comparison, in 2014, after the record weekly losses streak, Bitcoin consolidated for 31 weeks before it resumed an upward trajectory.
Looking forward: The Bitcoin sell-off can slow down in the near future, and we might see a temporary bottom around the $30,000 considerable round number. However, in the long-term, the correction can extend all the way to $20,000, which is a massive support level since it is the all-time high reached in the 2017 bull run. A fall to $20,000 would also allow the RSI oscillator to reach oversold readings.

Gold - Bullish BatA Bullish Bat Pattern on Gold gives a great opportunity for trend traders to take action. Due to volatility, I trade 10x lesser in terms of trading exposure on Gold compared to my usual Forex exposure.
How about you?
Will you engage in the Gold Trade NOW? or would you wait for next week market confirmation?

USDJPY - Bullish BatA Bullish Bat Pattern could be an opportunity for traders who are bullish on US Dollar to get involved. Conservative traders can wait for the candle close at 129.17 and retest back at 129.05 for a buying opportunity.

Could it be a bearish flag pattern?A possible bearish flag pattern backed up by the 20ma crossing below the 50ma. Also the NZDUSD pair has been in a steady decline. I currently shorted the pair. We must keep in mind it has been oversold according to the RSI, so there may be some short term upside.

USDJPY-Weekly Market Analysis-Apr22,Wk4Last week's market analysis still stands, click the link within tradingview to view last week's analysis if you have not done so.
If you are an intra-day trader, you can wait for a 3-bar reversal at the Bullish Gartley Completion Point, 127.07 for a buying opportunity.

AAVAS looks like reversal Showing strong sign of reversal from Area of Support, RSI - Oversold.
Watch for tomorrow movement - if closes green with confirmation - go long.
Good opportunity stock.
Follow for more ideas and share your thoughts in comment box.

USDCAD - Bullish BatThe Bullish Bat pattern form within the Daily Chart of the Bullish Flag setup. This is a Trend Trading setup, advance traders could look for a Trend Continuation setup within the same chart by using the Combo Trade Manage System.

GBPJPY - Bullish Deep GartleyWait for it...
The Range Bar chart has given me to short this pair at 156.09 and has exited at 155.36, a total of 73pips which translates to 639.75USD/lot traded.
If I were you, I will not immediately engage the Bullish Deep Gartley Pattern, even when it is a trend trading setup formed within the Buy Zone or known as the Demand Zone.
With such a strong bearish movement, it is a great idea to wait for the candlestick to pause and reversed.
It is ok to miss a trade, but what's not ok is to return the profit back to the market.

$PLTR Trade-Setup LONGI rally like Palantir at this spot, backtest of the pattern completion zone of the harmonic in the 4h chart.
Daily chart RSI is at 16, poised for some kind of bounce.
Buy in, TP's and Stopp Loss as in the chart.
Good luck out there!
Like, Comment and subscribe pls! :)

GBPUSD - Bullish SharkA Bullish Shark counter-trend setup is great for counter-trend traders. Although this trade doesn't have great structure-based support, the Reward is to Risk Ratio is healthy.
I'm in, will you?

GBPUSD-Weekly Market Analysis-Jan22,Wk3Do you remember that last week, I've shared with you the Gartley Pattern on GBPUSD is not going to bring us profit?
That's possible if you understand how to read the candle movement and be familiar with Harmonic Patterns and its hidden move.
We have a potential Bullish Bat the forms within the Buy Zone of the GBPUSD.
I'll be waiting for the candle confirmation to execute the trade.
Check out last week analysis within the related ideas in TradingView.

BNBUSDT 1D 20%+Hello guys! There's an uptrend with price at support and RSI oversold on the daily chart. Long: 440-420, take profit: 535-695. Goodluck!

Small Caps Oversold, AgainThey got a beating 12/09, Tues gap filled EOD, RSI near oversold, expect turn higher soon, watch the indicators!

Bullish Gartley PCZ Entry Reached; RSI OverSOLd.We finally had a huge sell down into the PCZ entry of this Gartley with lots of volume behind it; lets see if we can get a bounce and start going up from here again.

Paypal Bullish Shark Pattern at SupportWe might see a nice bounce from Paypal within the coming weeks but i don't expect new ATHs i expect a lower low then for it to come back down to make one final lower lower later on but for now i am quite decently Bullish as the MACD is showing Bullish Divergence, The RSI is Oversold, The price is at Old Resistance, and the Volume looks somewhat like a Selling Climax so lets atleast get a correction back up to the $200s then we can talk lower lows if it shows weakness there later.

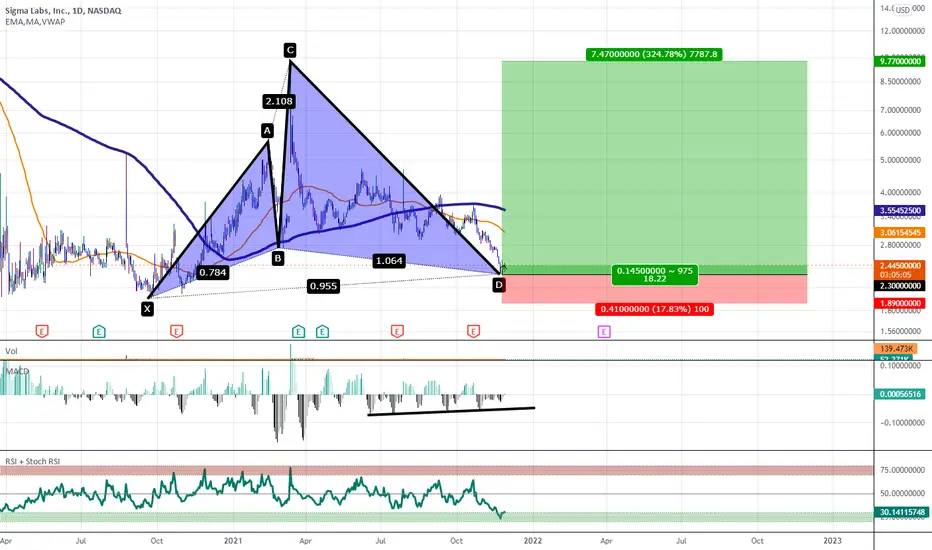
$SGLB: MACD Bullish Divergence and RSI Oversold at Shark PCZI like this stock i'v traded it back and forth a few times looks like it's time to buy again.