WTI CRUDE OILPrice respected the daily fvg(grey shaded). Also bounced off the weekly breaker(support level). Price is anticipated to reach $70 as long the geopolitical remains as they are and the market conditions allow the strategy/approach to play out.
Seasonality

Dow/Gold flashes GFC warningTop: Dow / Gold ratio
Bottom: SP:SPX
The Dow/Gold ratio shows How many ounces of gold does it take to buy the Dow Jones Industrial Average.
It gives insight into the question “who’s winning: paper or metal?”
It moves often coincide with large inflection points.
The current level typical coincides with stock market tops:
1929
1972
1974
2008

XAUUSD (Gold) – HTF FVG Reaction | 1HThis chart highlights higher-timeframe Fair Value Gaps (H1/H4) and recent session liquidity levels.
Price is currently reacting within a premium area while previous H1 imbalance zones remain unmitigated below.
The idea demonstrates how price has historically interacted with imbalance and liquidity zones on Gold.
No directional bias is assumed; this is a technical structure overview only.
⚠️ Disclaimer:
This publication is for educational and analytical purposes only.
It does not constitute investment advice, trade signals, or recommendations.
Always do your own research and risk management.

Short on Soybeans CFD (Ticker SOYBNUSD)
OANDA:SOYBNUSD
Technicals:
- short trade in horizontal channel
- price dived under 10.50-10.70 ressistance zone following false breakout
- intended target at support zone 9.83-9.93
- scenario invalidated if 2 bars close above 10.68
Fundamentals:
- seasonality criteria: soybean usually had descending movements in periods february - april if bear / accumulation and ascending movements while bull / distribution phase
- since we are still in bear market and there is no confirmation of phase change yet it is assumed that price will move downwards for next 2-3 months
Conclusion:
- the trade is based on the soybean season in South America (50% of global production), and by the end of April the market will have enough information for further decisions to be made
- therefore current trade is calculated for a maximum of 2-3 months
# - - - - -
⚠️ Signal - Sell ⬇️
✅ Entry Point - 10.496
🛑 SL - 10.722
🤑 Partial TP 50% - 10.17
🤑 Final TP 100% - 9.85
⚙️ Risk/Reward - 1 : 2.8 👌
⌛️ Timeframe - 3 months 🗓
Good Luck! ☺️
# - - - - -
DISCLAIMER: Not financial advice. Everyone must make trading decisions at their own risk, guided only by their own criteria and strategy for opening or not opening a trade

new #ATH coming soonIndian stock markets look oversold when compared to the Emerging Markets Index. There is a very high chance new #ATH is coming soon.

AUDNZD 1D 4 Feb. 2026According to my original analysis (not shown here), AUDNZD is in an overbought condition. The timing of the short entry can be determined using any technical analysis you prefer. The main concern is that this currency pair carries a negative swap, so a trading approach focused on capital gains is required.

OIL SHOWING PRICE BREAKDOWN, MAY FALL BELOW 62.50!Crude oil structure breaks down on lower timeframe.
N.B!
- USOIL price might not follow the drawn lines . Actual price movements may likely differ from the forecast.
- Let emotions and sentiments work for you
- ALWAYS Use Proper Risk Management In Your Trades
#usoil
#ukoil

Bearish I am bearish on USD until the end of April, based on the market structure shift on the chart and upcoming U.S. fundamental.
The tow highlighted zones are my entry areas.
I will wait for clear price action conformation and monitor the market reaction in these zones before taking any positions.

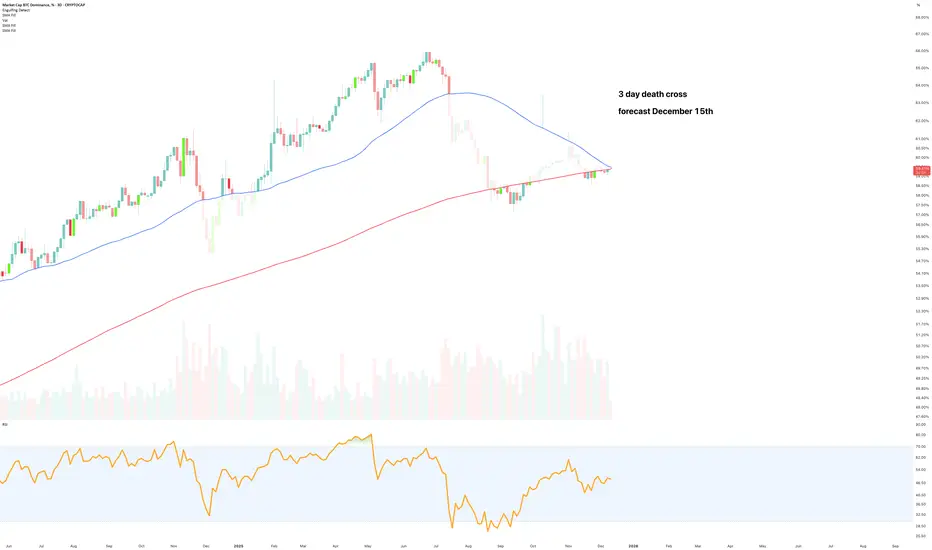
The alt-token Santa rally is here! - December 2025But it’ll be short lived. Many will mistakingly recognise this as “alt token” season, it’s not. It’ll be a relief rally on steroids for long suffering alt token holders. Use it as your exit from this awful asset class. This idea expires by the end of January 2026 at the latest, unless a development occurs that changes that outlook from the data available today.
The above 3 day chart of Bitcoin dominance forecasts a Death Cross print circa December 15th. Technically speaking, it is the 3rd three day Death cross to print on Bitcoin dominance. The others happened on May 2016:
At the time the OTHERS Total (first 100 alt tokens minus the top 10 generally speaking) rallied from $100m to $66billion over 590 days, when many made fortunes and watched them melt away in 2018. Today XRP has a market capital almost twice the size of the 2017 alt token bubble at $123billion. Aye.
The 2nd three day death cross was in August 2020, Bitcoin dominance rallied almost 30% on the cross and the OTHERS Total rallied 1000% over the following 255 days.
The take away, every 3 day death cross print is followed by a strong alt token performance.
“Wait wait you said until January 2026 and you present evidence for previous death cross resulting in alt token rallies that lasted multiple months, I’m confused!”
Why I know it won’t last long
A few of the long term followers among you may remember this idea “I mminent 2-day death cross - Is Bitcoin about to crash 30-40% ?? ” from 2022. The idea discusses the relevance of the 2 day death cross (not a 3 day as discussed above). That is when:
The 2 day 50 Simple Moving average (blue) crosses down the 2 day 200 SMA (Red) with price action under the 200 SMA.
If you look left you’ll notice every Bitcoin bear market is confirmed with this event. A 2 day death cross is forecast to print around the end of the month. It does not mean price action will drop like a vegan at a BBQ, but rather complain at first before being overcome by the stench of gravity.
Bitcoin 2 day death cross forecast, December 31st, 2026
Will not bore you with past crosses, you can do look them up yourself. What is clear, if not factual, a 2 day death cross is the start of a minimum year long bear market.
Conclusions
So yes, the alt token Santa rally is here, jingling its little bells and waving shiny green candles in your face like some bloke at a Christmas market trying to sell you socks you don’t need.
And like all Christmas magic, it’ll vanish the moment the lights go off. Not an “alt-season,” not a new paradigm, not “the big rotation we’ve been waiting for.” It’s one last sugar rush before the dentist arrives.
The real Grinch is waiting at the end of the month: the 2-day Bitcoin death cross, the one that actually matters. The one that says, “Right, fun’s over, pack it up, winter’s here.”
If you’re still clinging to low-cap jungle rubbish by February, that’s no longer optimism, that’s performance art. Use the rally. Exit the nonsense. Save yourself before the lights go out and the floor collapses faster than a crypto influencer’s moral compass.
Ww
Disclaimer
==========================================
This is not financial advice, obviously. If you read this and think, “Right, I’m putting the house, the kids, and the dog into ShibaBonk Inu because Santa said alt season!” that’s on you, mate.
If the market pumps, you’ll claim you’re a genius.
If it dumps, you’ll blame me. Either way, I’ll still sleep like a baby.
Do your own research.
Bitcoin - Weekly OutlookHistory equals wisdom and knowledge right? This chart shows every cycle top is the next cycles bottom. We are very close to that bottom as we speak. There is no longer any profits to make by selling and hoping for it to go lower. I believe this is THE moment to be a buyer for the medium to longterm. It is possible we will go sideways for a while but I think the upside is a more likely outcome after this weekly candle close IF it succeeds in closing above the 64 k.

BTC/GOLD Comparison instead of USDIs it possible that bitcoin already bottomed if you compare it to Gold instead of the Dollar? Is the 4 year USD cycle broken? Did BTC bottom to gold because of the Gold run? Will the cycle play out exactly the same it did in the past or did something change due to the end of the 18.6 real estate cycle + no Bitcoin dominance break down during current cycle (Altseason).
Many questions no answers. Not yet. Anyhow buying crypto atm at current stage is wise due to most of them are extremely oversold, if that lead to any bigger rallies i let me unsaid. But up from here before down is my belief. Just very interesting to compare Bitcoin to other currencies, especially to Gold due to Bitcoin is supposed to be the digital version of Gold.
If bitcoin track earlier cycles then it should bottom now, or in October if compared to USD. Anyhow the current bull market is not broken until the 50% level is broken in USD value, which is 69k.
/WealthNode

Gold Outlook Anticipating Buys from here if we get a 4hr shift in orderflow. Viewing January low as the sellside liquidity which provided the Crack in correlation, I can then use that to gauge a potential disinterest to proceed lower.
Will see how the upcoming month proceeds.

If history repeats...Will history repeat? The last bull runs in the last 50 years projected. 1970 to 1974, 1976 to 1980 and 2001 to 2011.

Silver Futures | Daily ChartSilver has moved into a vertical rally phase, showing strong momentum but now entering a possible EXHAUSTION GAP ZONE
Sharp impulsive move after accumulation
Price far extended from base → mean reversion risk
Volume expansion supports trend, but follow-through needs monitoring
Sustaining above this zone keeps the bullish bias intact
Failure to hold may lead to short-term consolidation or retracement
📌 Trend is bullish, but risk increases at higher levels.
Educational view only. Not a buy/sell recommendation.

Terrif Season - BTD (BUY THE DIP)We’re fast approaching the second annual “tariff season”, that time of year when the market often pulls back a bit, creating opportunities for deals and for investors to buy the dip. If you haven’t already, consider keeping some cash on the sidelines for a rainy (or snowy) day.

$BTC Tops Then $SPXThe stock market normally tops ~1.5 months after BTC, but it has now continued to rip to ATHs ~3x that amount of time!
Dec 11, 2017 (BTC peak) to Jan 22, 2018 (SPX peak) = 43 days
Nov 8, 2021 (BTC peak) to Dec 27, 2021 (SPX peak) = 44 days
Oct 6, 2025 (BTC peak) to January 26, 2026 (SPX today’s date ATH) = 113 days
Is crypto broken?

US Government Shutdown - $BTC & $SPX PerformanceUS GOVERNMENT SHUTDOWNS
PAST PERFORMANCE FROM BITCOIN AND S&P 500
Doesn't make much sense to look any further back than 2008 since that's when the entire monetary world order reset and a new playbook was introduced.
*Note 2013 was the first shutdown in this new monetary regime.
Really only worth looking at 2018 and 2025 shutdowns however since those were post-election years, both under Trump.
Can't wait for the "but this is only two data points" bros to chime in here 😂
February is going to be a ROLLERCOASTER 🎢
Remember the exit strategy playbook…
Feb. should present a great buying opportunity ~$70K CRYPTOCAP:BTC to sell into March strength before Tax Season wipes out the market once again and BTC crawls back down to at least $58k.

22.01.26 NEXT TARGETThe previous bull-market target was $104,500, and it was reached. The extensions beyond that level surprised me as well, but the core target remained fully aligned with the technical structure. We are now almost certain that the bull season has ended.
At this stage, our focus shifts to the trend-based Fibonacci level around 0.312, which defines the current downside objective. It is clearly observable that the bear market phase has been relatively short-lived.
For this reason, I expect Bitcoin to reach the $52K region in 2026, with a tolerance band of ±20%, followed by an accumulation/distribution phase. This process should also mark the early structural steps of the next bull cycle beginning to form.

Gold At end of 2027(9000$)????Gold will go at end of 2027 to 9000$ according to previous history and current Global tension i think it will happen.
At this time more people will laugh but save my prediction and open in at end of 2027 .
So plan accordingly it prediction. if you have extra money start investing every months in gold


Gold Outlook Currently we have a 4hr IRL-ERL setup. Anticipating a manipulation into IRL in order to target ERL.

EURUSD Outlook Update from the previous analysis. We tapped a weekly PDA while clearing sellside liquidity. This was missing in previous analysis.

Gold Outlook We have a 4hr IRL. So, I'm anticipating a manipulation into the 4hr IRL to consider buying opportunities towards ERL.
