Symmetrical Triangle CorrectionHello guys
We have 5 sub-wave correction which form 3-3-3-3-3.
If we expand our view we see that in each symmetrical triangle we have ABCDE.
Follow me for more tutorials.
Cheers :)
Symmetrical Triangle

👨🏫 Continuing Pattern: ✅ Triangles👀Triangles are among the most reliabiable of the continuation pateerns. There are 3 types of Triangles with forcasting value.
Ascending Triangles
Descendung Triangles
Symmentrical Triangle

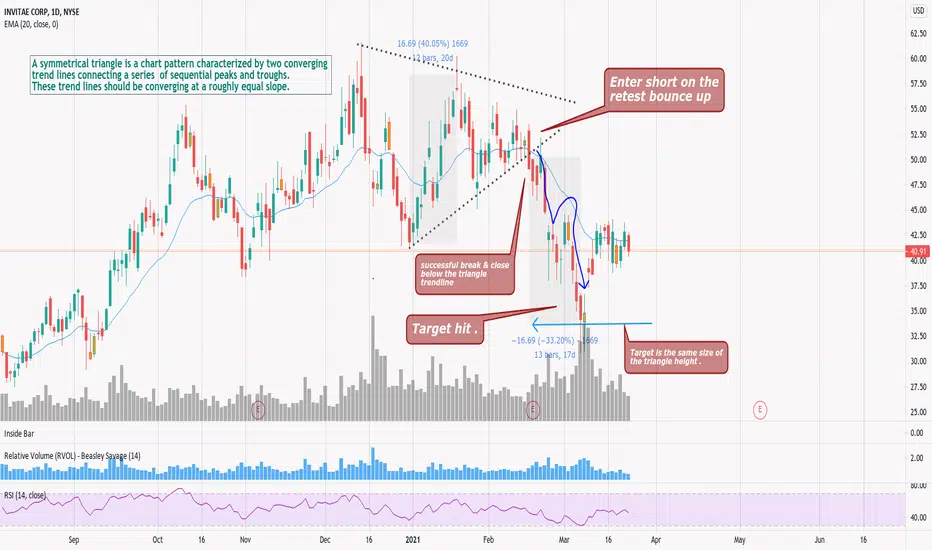
Symmetrical triangle tutorial - live example of a short setup A symmetrical triangle is a chart pattern characterized by two converging trend lines connecting a series of sequential peaks and troughs. These trend lines should be converging at a roughly equal slope.
XAUUSD Triangular Correction - Is it Ascending or Symmetrical?The market isn't giving anything away as usual... what do you think this triangular correction is?
Please leave a comment!
*Disclaimer*
This is not trading advice. All content/ information shared in this idea is purely educational in nature and is expected to be used for analysis and illustration purposes only.
Do not trade or speculate based solely on the information provided.
Trust you own analysis.
Beyond Edge

Breaking the symmetrical, the traders survivor guide by hedgehogSo you been trading for a while and got stuck in a symmetrical triangle apocalypse? let me make it easy on you:
____________________________________________________________________________________________________
**** Facts:
1. Triangle: At-least 2 lower highs, 2 higher lows to start the trend.. (in total 4 points)
2. Trend: Usually happens after months of one trend, and appears at the peak of the trend. appears as uncertainty, consolidation and a temporary stop for the trend,
this usually a 'no trade zone' as it's very hard to guess which direction it will break, this is where the sellers and the buyers trying to detainment if the price is valid,
until it forces them to make a decision, which usually explodes and continues for long period of time...
3. Volume: The more the Symmetrical extends, so does the volume diminishes more and more (The quiet before the storm) until decision has made which means it will
force one side to agree to the strong trend.
4. Duration: It can extend for many weeks - months, usually on strong trends it can continue for 3 whole months!!!
5. Break-out timeframe: Usually happens after half or 3/4 of the whole triangle length, if it breaks before that then it is a premature breakout which means we either
going back to that zone or it wasn't a significant stop thus wont be the break.
6. Confirmation: Should be with V big volume rise (sellers/buyers) then, and also should be confirmed only after closing daily candle.. some traders prefer to wait for up
to 3 days to confirm a new trend pattern.
7. Return to Apex: Not a must, but surely the best, if the price returns back to the Apex zones of the break, to use it as support/resist, to push it even harder to
continue the trend.
8. And the most important key note to know is price target: The widest range of the triangle (From where it started, between the highest high and the lowest low) is
the price movement up/down, if lets say the range between the top and the button is 6k$, then we should expect the break to fall/grow towards that same
ammount.
**** Some warnings:
1. It is never know and very hard to know which way a symmetrical triangle will break, but usually on more cases (+/- 75% of times) it will break towards the continues trend, if it started at the peak of bullish then more chances it will break as bullish, BUT! a symmetrical triangle is as I explained an uncertain point between the buyers and the sellers, and it might be a key point where a reversal for the market appears, which means on many cases (+/- 25% of times) it might break against the trend.
2. It's very dangerous and hard to guess where we will break to, thus sometimes it's called a 'no zone trade' which also causes less activity of volume which drops more and more the further we progress towards the end of the triangle, you should work with very tight SLs (Or even avoid trading) as a strong break out push might be so fast that not only it will easily hit your SLs, but it might also ignore them (With gaps) if the exchange SLs are 'market SLs' type, so be careful.
3. It's always best to trade after a break out fully confirmed (Or better to say: invest, as this is usually long term until we reach the price target)..
*********************************************************************************************************************************************************************************
* If you like what I do, please push "follow" and "like".
* Also if you want live time signals and learn with the community then you are welcome to join here: t.me
* If you want to appreciate my work with spare BTCs then you are welcome to send them to: bc1q8kzn0x8j4dmws00ntuhyma8p4c9jwyj0gzxua9
Cheers, love <3
Your favorite vigilante speculator: Hedgehog King!
*********************************************************************************************************************************************************************************

Lesson about symetric triangle Here is an example of a symetric triangle pattern played out on the 4hr XRP/USD chart. Im starting to see these triangle patterns more and more whether it be considered a pennant or whatever. The results are similar regardless of what you call it. Price gets squeezed towards the end of the formation and at a certain point it shoots up or down. The tricky part is predicting which way it will go. But with the triangle at least you could have predicted when the price action will occur. I am still learning a lot myself but I am trying to document my journey from scrub to master of the charts.

BTCUSD D3/W1 charts (3/14/2019)The D3 chart looks a lot more promising than the smaller TFs at this time. A pennant/symmetrical triangle is currently printing and a bullish break should have price targeting the $4150/60 level as well as place price just under the neckline of the possible purple IHS that some people are watching. RSI continues printing an ascending channel but traders should watch for a possible bearish drop through channel support.
The W1 chart shows the multi-year ascending channel I spoke about in the smaller TF update I posted.

Symetrical Triangle Rule - BTC 1/6/2019Example and strategy of how I prefer to play symmetrical triangles - BTC 1/6/2019


BTCUSD - Symmetrical Triangle BreakoutDear All,
If you follow my previous TA, this is the part of it and a details analysis on the breakout of the Symmetrical Triangle. Since this is Educational TA, let me explain in details;
What is Symmetrical Triangle?
1. Symmetrical Triangle is a continuation Pattern. So you need to look where is the entry. For this case, the entry is from bearish trend. Once the breakout is confirmed, it will continue goes downwards.
2. Volume for Symmetrical is similar with other pattern, where the volume reduced until it reach breaking point. For this case, the selling volume will at high for the continuation to bearish side.
Few info I used in this charts;
1. MACD - This indicator to check on the market momentum, as you can see at the breakout, the 12 EMA is going to cross 26 EMA again and goes downwards to denied bull trend.
2. Stoch RSI – This is one of my favourite indicators after Volume and MACD, it show the market is just returned from overbought market. We are heading to oversold area again for a new correction.
3. I drew a 300 days SMA line from day chart as a big support at the range of $7282.5-7343.9.
4. Previous Support line also identified since we are expecting a bounce anytime from this pattern. The support at $7671.2 and $7430.3 is identified.
5. $7102.2 is the lowest target where that is a technical target based on Symmetrical Triangle pattern. Take note that the target is not 100% achievable and that is the reason why previous support/resistant and also SMA need to identified.
This TA is for Educational purpose and not a financial advice. If you are happy with my charts and would like to follow more in the future, feel free to follow my profiles.

BTCUSD - Symmetrical TriangleHi All,
Previous Bear Flag and Raising Wedge Target is complete and lets see latest pattern.
Since Daily Stoch still bearish, we probably will go another bear pattern. Symmetrical Triangle. Symmetrical is a Continuation Pattern. Since the Entry is from bearish trend, it will continue going downwards. MACD and stoch RSI in 2 hours look bull, but probably denied due to bear trend in day chart. Just monitor on the breakout and spike in volume.
*This TA is for Educational purpose and not a financial advise. If you are happy with my charts and would like to follow more in the future, feel free to follow my profiles.

Example of a Symmetrical Triangle on VNQVNQ formed a symmetrical triangle. It has two trend lines. One uptrend line is acting as support while the downtrend line is acting as resistance.
This triangle contains three highs lower and three lows higher. When these points are connected, the lines converge as they are extended and the symmetrical triangle takes shape.
The symmetrical triangle can be continuation or reversal, so we must wait for which line will break. To confirm the breakout, the price should close above the resistance line or below the support line. In this case broke by support, then we must make a short.
The profit target is the distance away as the back of the triangle.

Example of a Symmetrical Triangle on ETHUSDETHUSD formed a symmetrical triangle. It has two trend lines. One uptrend line is acting as support while the downtrend line is acting as resistance.
Contains three highs lower and two lows higher. When these points are connected, the lines converge as they are extended and the symmetrical triangle takes shape.
The symmetrical triangle can be continuation or reversal, so we must wait for which line will break. To confirm the breakout, the price should close above the resistance line or below the support line. In this case broke by resistance, then we must make a long.
The profit target is the distance away as the back of the triangle.
