TBT is a buy rate cuts likely are stalled LONGTBT is an inverse 20 year Treasury Bill ETF. At present, the Iran Israeli conflict threatens a
regional conflict to include the Red Sea and the Easter Mediterranean where oil tankers must
navigate to move oil from producer to consumer. Oil price escalation could go hand and hand
with geopolitical escalations. Oil and its derivatives are a primary driver of inflation in the
US. Inflation has been sticky and forcing the fed's ambitions to cut rate to be paused. The
Middle East escalation may make matters worse overall. Federal spending ( aid to Israel for
instance) is also a driver of inflation. The budget fight in DC is front and center. I see this
as good cause, to continue to take adds to my TBT position whenever I can find a dip worth
the discount as a further hedge against a correction in the equities markets which could come
on the horizon. Granted a dip of 2-3% from the ATHs is not much but when it hits 10% or more
and the VIX/UXXY continue to rise, there will be impetus in a hurry to hedge positions or close
them with more urgency. For for TBT, I believe that more is better.
TBT

TBT / TLT T Bill Inverse TreasuriesOn this daily chart of the ratio of TBT ( Treasury Bills Bearish ) to TLT ( the inverse Bullish)
over time. This serves to accentuate shifts in prices from factors affecting them both but
with opposite effects. Federal actions or even reports of economic data are some
of those factors.
This chart shows that about November 1st, TBT ad topped out and fell. They are inverses
of one another . What makes one go down will make the other go up and viceversa.
By February 1, TBT bottomed out and the ratio reversed. The cycle took 3 months.
On a lower time frame, cycling would be more frequent.
At present, it would appear to be time to sell TLT and / or buy TBT
What applies to the TBT /TLT ratio would also relate to TMV / TMF as a ratio.

TBT Inverse Treasuries ( Long Dates ) LONGTBT is shown here on a weekly chart. It transitioned froma downtrend into the present trend
up two years ago with the initiation of the rate hikes to cut down inflation by hitting its knees.
Inflation was the direct result of the money printing and stimulus as part of the federal
response to the complications of covid and lockdowns. Price is now ascending in a broadening
channel ( a megaphone pattern) reflecting increasing volatility as federal action or inaction
gets priced into buying decisions at treasury auctions. As for me, i will continue to build
a TBT position until it is obvious that the fed has launched an active agenda of rate cuts
which will fortify T-bill prices and make TLT the new runner.

TLT Treasuries Long breaks down under VWAP SHORTTLT on a 120 minute chart has continued its trend down since early December after a suddent
uptrend in November lasting for a two month until the end of 2023.
Inflation data is kicking the rate cut down the road of time.
Price has now fallen under the VWAP and all of the EMA lines including the EMA20.
Relative strength trending correlates with price . I conclude, TLT continues to be set up
SHORT or alternatively TBT LONG . I will take short trades at weekly highs on a 30-60
minute chart until signs of a reversal are seen on the chart.

TLT- Are rate cuts postponed? LONGTLT has been in a broadening wedge and formed a falling wedge within the larger pattern.
Price bounced off the lower supoort trendline in the mid-morning of trading then rising
to break out of the falling wedge. I see this as an opportunity to take a long trade in TLT
and close out a TBT position at the same time. This reversal may be due to the value of
existing bonds with the implications of a rate cut postponed beyond June. The faster RSI line
has recovered to cross the 50 level lending further support to this long trade.

TLT / TBT Ratio - a bonds long and short oscillatorOn the daily chart- I have plotted the TLT (Long Bond Leveraged) ETF vs the TBT (Short
Inverse) as a ratio. The ratio is running on a cycle between high and low. On the chart for
reference is a Hull Moving Average of 20 days. A more frequency cyling could be achieved
with a paid Tradingview subscription and a charting time frame of 2 or 4 hours.
For the trading idea, when the hull moving average is upgoing and the price is above it, the TLT
can be bought while when the moving average of the ratio is decreasing and price is under it,
the TBT can be bought. At a high pivot point, all TLT is liquidated and a TBT trade is taken .
For a low pivot point, TBT positions are closed and TLT long trades are taken. The best trades
are at the pivot points and when a doulble top or bottom are put onto the chart.

TMF long trade setup 3X Bullish TreasuriesTMF on the 4H chart is set up at the bottom descending support trendline of a symmetrical
triangle in the approach to the apex. Price appears ready to reach for the upper descending
resistance trend line and the Echo Indicator ( Lux Algo ) makes that forecast. Current
ambiguities in a rate cut soon upcoming will make values of Treasuries a complicated matter.
I am taking a long trade targeting 54 with a stop loss at 50 in consideration of the triangle
pattern. I have existing positions in TLT.

😳 TREASURY-BONDS COLLAPSE IS JUST ONE STEP AWAY TO COME BACKThe collapse in Treasury bonds in 2021-2023 now ranked among the worst market crashes in history.
Since March 2020 to 2023 fall, Treasury long term bonds with maturities of 10 years or more have plummeted over 40% while the 30-year bond had plunged over 50%.
That's just under losses seen in the stock market when the dot-com bubble burst.
The bond rout was worse than the one seen in 1981 when the 10-year yield neared 16%.
The bond-market sell-off that's sending yields soaring is starting to eclipse again some of the most extreme market meltdowns of past eras.
Those losses are nearly in line with stock-market losses seen during the worst crashes of recent history — when equities slumped 49% after the dot-com bubble burst and 57% in the aftermath of 2008.
Compared with previous bond-market meltdowns, long-term Treasurys are seeing one of the most extreme undoings in history. The losses are over twice as big as those seen in 1981 when 10-year yields neared 16%.
That crash came as the former Federal Reserve chair Paul Volcker grappled with historic inflation and pushed the federal funds rate to just under 20%.
While interest rates remain well below that level today, the central bank's aggressive turn toward monetary tightening in the post-pandemic era has caused a similar bond-market rout. And some traders have continued selling amid concerns of rebounding inflation, while a deluge of Treasury issuance this year has also pressured bond prices.
Technical graph for 10-year yield futures CBOT_MINI:10Y1! indicates that 52-weeks SMA support is still important for further T-Bonds pressure, while 10-year yield (unfortunately to T-Bonds holders) is still following major upside trendlines.

FAZ / FAS a demonstration of ratio-tradingHere on a daily chart the ratio of the Bearish Leveraged Financial ETF to its Bullish counterpart
is showing to be in a descending parallel channel. The chart is marked with comments about
trading considerations of these ratios at a given time. At present, the FAZ is undervalued
and should be bought. On the other hand, Bullish FAS, should be either sold if positions are
held.

TBT- an ETF bearish on bondsTBT on the one hour chart demonstrates a clear round bottom reversal in late June
with a good trend up this past week. Price rose above the POC line of the volume profile
on July 3th showing bullish momentum dominating. Price has continued to ascend above
the Chris Moody sling shot indicator affirming that momentum. Given the current fed posture
hawkish for another rate increase fixed rate bonds will suffer yet again. Other indicators
show rising upward volatility and relative volume which further support the strength of the
trend. Time is ripe for a swing trade in TBT.

TLT Long at VWAP Bounce T- Bills 20 yearsTLT on the 15 minute chart in the past two trading sessions consolidated and then fell into
a pullback to the support of the anchored mean VWAP. Relative volatility spiked and has
now contracted. I see this as a good entry to add to my TLT position having sold a good portion
of it three trading days ago when price showed topping wicks outside the fibonacci highest
band. This will be about $ 1.00 cheaper than before that sale and is part of a zig-zag
strategy for TLT overall.

TMV Triple Inverse Treasury Bill ETF LONGTMV on the 4H chart appears to be reversing a trend down since 12/28. YTD it is rising.
The reasonable target is the Fib 0.5 retracement at $40 while support for a stop loss
just below the POC line of the volume profile is $29.25. As such this is a 35% upside.
The RSI indicator shows the fast RSI rising and crossing over the slower RSI while the
relative volume indicator shows increasing volumes reacting to the price bottoming and
accumulation underway. I see this as a long trade set up while recognizing that fundamentals
such as interest rate adjustments and inflation data could impact the technicals.

THREE WORDS THAT YOU SHOULD KNOW — TNX GOES NUTS!Bank of America says the recession and credit crunch could lead to large corporate defaults.
Credit strategists at Bank of America note that the fallout from the recession and credit crunch could see $1 trillion in corporate debt eventually become insolvent.
This is largely due to the fact that banks have already begun to refuse lending conditions after the collapse of Silicon Valley Bank. US debt growth has also slowed in recent years, and a "full blown" recession has yet to be officially declared.
If a full-blown recession does not occur in the next year or two, the restart of the credit cycle will be delayed. For now, analysts still predict that a moderate/short recession is more likely than a full blown recession.
Markets are increasingly nervous about the prospect of a future downturn, with the New York Fed's Recession Probability Index projecting appr. 70 percent chance of a recession hitting by April 2024. The risk comes from the Fed's aggressive 21-fold increase in interest rates over the past 15 months to tame inflation.
The US Federal Reserve, having fired a lot of "HIKE RATE" ammos over the past two years. And certainly has fulfilled its goals.
In fact, in the second quarter of 2023, the rolling 12-month growth rate of the Consumer Price Index (April value = 4.9%) was below the Core CPI (April value = 5.5%).
In human words that means prices of food and energy are deflating year-over-year.
To some extent, the risk is also heightened by the recent banking turmoil, as lenders suffer losses on their "HELD-TO-MATURITY" (and in fact "READY-TO-SELL") portfolios of long-term corporate bonds and US Government bonds, as well as in due to a sharp outflow of deposits.
The technical picture in TVC:TNX says the key trend is still strong, thanks to tailwinds from the first quarter of 2022 and support of Weekly SMA(52).
The second half of 2023 is off to an interesting start.
High quality "AAA" 10-year Bond' yield is back to pain levels corresponding to the collapse of the FTX cryptocurrency exchange last fall, as well as the collapse of regional and cryptocurrency banks as early as this spring, 2023 (like SVB, FRC and others).
At the same time, real (that is, minus inflation) rates are now certainly much higher, against each of those two marks, as inflation is down.

$US10Y At a Important Pivot Point---
### Market Analysis: TVC:US10Y Nears Crucial Pivot Point
#### Critical Juncture for the U.S. 10-Year Treasury Yield
The U.S. 10-Year Treasury Yield ( TVC:US10Y ) is currently at a pivotal position that could significantly influence market sentiment. This important pivot point is marked by a specific blue line on the chart, serving as a key indicator for market direction.
#### Bullish and Bearish Implications
- **Below the Blue Line - Bullish for Markets**: If the TVC:US10Y falls below this blue line, it is generally interpreted as a bullish signal for the markets. A lower yield on the 10-year Treasury often suggests an increased appetite for riskier assets like stocks, as investors seek higher returns than those offered by government bonds.
- **Above the Blue Line - Bearish for Markets**: Conversely, if the yield rises above this blue line, it can be seen as bearish for the markets. Higher yields may indicate a shift towards a more risk-averse sentiment, potentially driving investors away from stocks and into the perceived safety of government bonds.
#### Monitoring Market Movements
The position of the TVC:US10Y relative to this blue line is a critical factor for investors to monitor. It not only reflects broader market trends but also helps in predicting future market movements. The yield’s behavior around this pivot point could provide valuable insights into the market's overall risk tolerance and investment direction in the near term.

$US10Y Negative Divergence Played Out"The TVC:US10Y Negative Divergence Played Out as we observed a scenario where the momentum indicator, such as the Relative Strength Index (RSI), had been showing bearish divergence with the U.S. 10-year Treasury yield. This indicated a potential weakening of the yield's upward momentum, despite higher prices initially. Subsequently, the divergence 'played out' as the 10-year Treasury yield indeed reversed its upward trend, aligning with the bearish divergence signal. This divergence resolution may have led to a shift in market sentiment or investment strategies, impacting various sectors and asset classes."
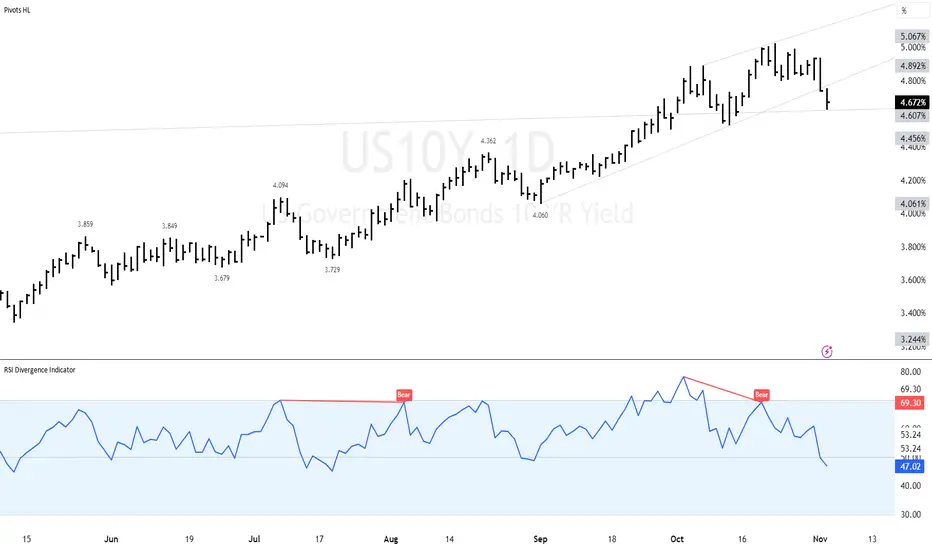
$US10Y Negative Divergence RSITVC:US10Y Negative Divergence RSI The TVC:US10Y showcases a negative divergence in the Relative Strength Index (RSI). This indicates that while the 10-year U.S. Treasury yield might be increasing, the momentum behind this rise is weakening. Historically, such divergences in the RSI can signal potential trend reversals or price corrections in the near future. Investors and traders should be cautious and closely monitor subsequent price actions and other technical indicators to validate this potential divergence.

🐹 Caution To All TLT Hamsters - TBT Has More Room to DeliverTBT is a UltraShort 20+ Year Treasury ETF.
This Fund seeks daily investment results, before fees and expenses, that correspond to two times the inverse (-2x) of the Daily performance of the ICE U.S. Treasury 20+ Year Bond Index.
1. Always look first. Never rush into a trade or investment blindly.
2. Wait, and wait again, for the pattern to develop.
3. Be patient and use alerts to get notified when the time is right.
4. Measure trading ranges and adjust your plan for sideways action.
5. Look for bases and consolidations.
6. Zoom out and look for historical levels of support and resistance within those bases or consolidations.
7. Markets can go sideways longer than traders can stay solvent.
8. Adjust your stop loss and take profit targets for the choppy price action.
9. Be prepared for false breakouts and false breakdowns.
10. Choppy markets do not trade like trending markets.
Technical picture in AMEX:TBT indicates it has possibility to further upside price action, up to 57 - 60 U.S. dollars per share, as key multi year resistance (5-years simple MA) has been successfully broken at the end of 2022.

$TBT Double Top AMEX:TBT Double Top, A "double top" is a popular term used in technical analysis to describe a chart pattern that suggests a potential bearish reversal of an uptrend. Here's a breakdown of the double top pattern:
1. **Formation**: The double top pattern forms after a strong upward move or trend. It consists of two consecutive peaks that are roughly equal, with a moderate trough in-between, which is called the "neckline".
2. **First Peak**: The first top is formed when the upward trend reaches a resistance level and sees a reversal, leading to a price decline.
3. **Trough**: After the first peak, the price undergoes a correction, which leads to the formation of the trough. This decline is a sign of short-term profit-taking but isn't strong enough to signal a trend reversal yet.
4. **Second Peak**: Following the trough, the price will attempt to rally again, moving back towards the level of the first peak. However, it will once again meet resistance and fail to break through, leading to the formation of the second peak.
5. **Breakdown**: After the formation of the second top, if the price breaks below the neckline or the lowest point of the trough, it's a confirmation of the double top pattern and signals a trend reversal. The expected downward move can be approximately the same vertical distance as that between the peaks and the neckline.
6. **Volume**: Typically, volume tends to be higher on the left peak than on the right one. A noticeable increase in volume on the breakdown through the neckline can serve as additional confirmation.
7. **Significance**: The double top pattern is considered a powerful signal, especially when spotted on longer timeframes like daily, weekly, or monthly charts. However, as with all technical analysis patterns, it's essential to use additional indicators and methods to confirm a potential trade.
Remember, while the double top can be a reliable indicator of a trend reversal, no single method is foolproof, and it's essential always to use risk management techniques.

TBT- a bearish treasury ETF LONGTBT on the 30 minute time frame shows a trend up in an ascending parallel
channel now at the bottom of the channel where it could go up or breakdown
and go under the channel. The ZL MACD suggests some bullish divergence while
the dual TF RS indicator and the ADX oscillator are non-commital.
The immediate recent short term volume profile with a POC line above price
suggests a lot of trading above price and likely short sellers. A longer time
interval volume profile shows the POC line more than $1.00 below current price.
Price could easily gravitate in the direction of that price magnet.
Overall, I see a bias for a bearish move and will watch this to confirm. i will play
this with put options to leverge the amplitude of the move albeit at higher
risk.

TMV setting up a reversal LONGOn this 4H chart- TMV the leverage bear Treasuries ETF has been trending up
in a parallel channel. AT present it bounced from the top of the channel and is
heading down to the bottom of the channel. It is there that I will trade long
where the bottom of the channel is confluent with the mean VWAP providing
an overlap of dynamic support. Near that same level is the POC line of the
volume profile. Price needs to stay above the POC line for the probabilities to
tell me to trade long. Roughly I am looking for a trade from 145 to about 160 for
a 10% move more or less. The stop loss under the channel trend line for about 1.5
and so the ratio is about 6. Once in the area of the bottom of the channel. I will
look to the indicators and zoom into 15-30 minutes as a time frame to find the
entry. I will entertain taking a trade in a fair number of shares and potentially
buy a put option for insurance against the downside to hedge against losses.
I expect the trade to last a week or less and so averaging about 2% gain daily.

TMV leverage inverse ETF for treasuries SHORTTMV on the one-hour chart tested two standard deviations above the mean VWAP in
both late May and early July it fell to one standard deviation below VWAP but then rose
sharply into beyond the two standard deviations line ( thick red ) ascending into a YTD high.
I believe that this is due to the recent federal debt creditworthiness downgrade.
The threatened rise of BRICS reserve currency and potentially adversely affects the
value of the dollar ( DXY) while supporting gold prices. I see this as a good continuation play
no matter the overextension of price. Both the dual MTF and the zero lag MACD however
suggest a pullback. The mass flow indicator does as well. As a result I will look at TMF
to go long trusting the indicators to give me a directional bias.

TMF - Long Term Leveraged Treasury ETFOn this 4H Chart TMF has rallied in the past week about 9% as the reports of the impetus of
inflation has diminished. On the zero-lag MACD, the lines are staying above the histogram
which has not converted from negative to positive. The dual time frame RSI showing
low 1 hour TF in blue and daily TF in black has the lower crossing over the higher both
at the lows on July 10th and now both over 50 with the low 1 hour TF still above the higher
daily TF. This confirms bullish momentum. Price is on a VWAP breakout ascending from
the support of the 2nd negative mean anchored VWAP to above the mean anchored VWAP with
a retest as well. Price is now above the POC line of the volume profile demonstrative
the dominance of buying pressure over selling pressure. On the ADX indicator, a positive trend
is rising while down trend is dropping proportionately with the intersection and cross occurring
on July 12. Positive ADX is staying above 20.
Overall I see this as an excellent setup for a long swing trade targeting 8.05 in the area of
the values of the highs of June. A higher target would be about 8.3 where there were some
recent pivots If the fed does an about-face and pauses rate hikes, a significant rally could
ensue.

TBT Treasuries Bear Leveraged ETFTBT is going to take another swing now that interest rates are going up.
Fundamentally, Treasuries and other bonds will go down on their real face value
because their yield is lower than the new going rate. Inverse EFTs like TBT
will go up when Treasuries go down.
On the w Chart chart, price is sitting above the POC line of the volume profile
where there is support and high volatility. Above the line shows buyers in control
ready to move price higher.
The Awesome Oscillator flipped green today after the fed news showing that selling momentum
has been replaced by buying momentum ( capitulation at the bottom).
The volume indicator shows a clear uptick in buying volume.
TBT offers options to further leverage this trade.
I will take a call options position of several contracts for the 5/12 expiration at a strike
about 5% below the current price. I expect 100% return on risk by next Monday and more
after that.

TMV Treasuries Leveraged 3X Short Inverse LongTMV is an ETF Shorting the Treasuries. On the 2H chart, price is rising as the treasuries are
suffering value contraction while interest rates are steady or projected to rise. The chart shows
rising volumes, upwards volatility as well as a PV Trend demonstrating trend strength. I see
these all as confirmatory for bullish momentum. I will take a long trade into the next round
of federal news. The employment data showing strength in new jobs and low unemployment
will likely lead to another rate hike as the fed continues to try to beat down inflation and
will not relent in face of those data pieces. CPI and PPI may add fuel to the fire this week
and TMV may continue to rise.
