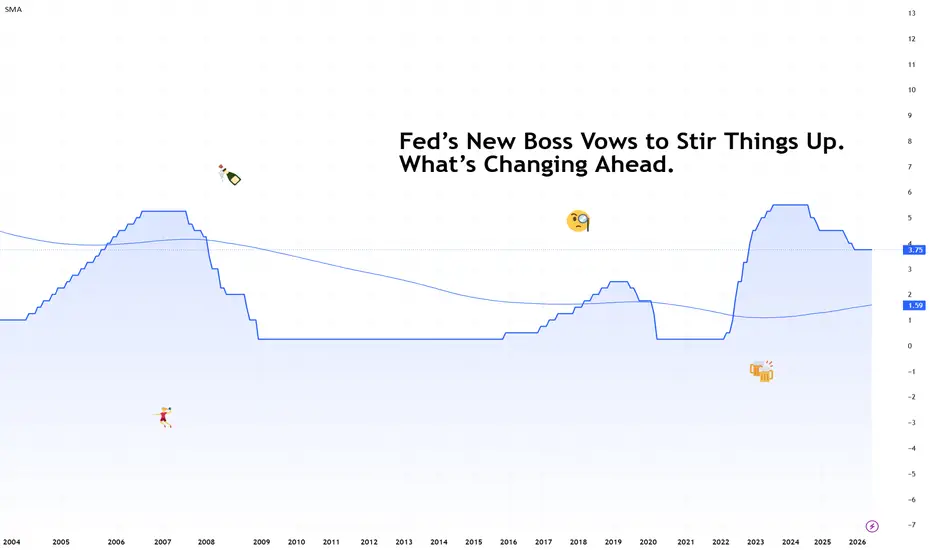
Higher for Longer Is So Back. What Does It Mean for Markets?The Fed hiked. That wasn't the surprise.
For the first time in more than three years, the Federal Reserve has raised interest rates ECONOMICS:USINTR .
The Fed lifted its benchmark rate by 25 basis points Wednesday to 3.75%-4.00%, a move markets had overwhelmingly expected.
The bigger message arrived alongside it: policymakers aren't treating this as a quick adjustment before returning to lower rates. They think borrowing costs may need to stay higher for longer.
Sixteen of 18 policymak
USINTR
Fed’s New Boss Vows to Stir Things Up. What’s Changing Ahead.What do you mean “Good day?” It’s “Good afternoon.” Or not anymore.
The Federal Reserve got a new leader. Kevin Warsh wasted little time showing that things may look very different from here on out.
His first meeting as Fed Chair delivered a clue right from the opening words. You, and all traders alike, have gotten pretty used to the “Good afternoon” that could slosh billions in seconds.
So when Warsh greeted reporters with a "Good day," traders realized it’s the new normal.
Behind the
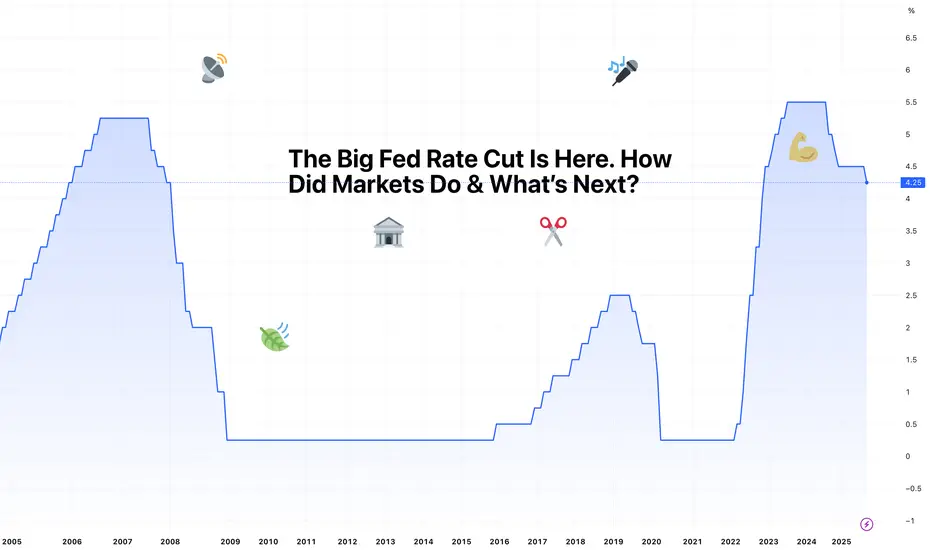
The Big Fed Rate Cut Is Here. How Did Markets Do & What’s Next?“ Best we can do is 25bps ,” officials, probably, when they gathered to lower the federal funds rate. It wasn’t the 50 basis points some of you had expected. But you also didn’t expect to hear that two more trims are most likely coming by year end.
Let’s talk about that and what it means for your trading.
🎤 Powell Delivers
The Federal Reserve finally trimmed rates for the first time in nine months, cutting the federal-funds rate by 25 basis points to 4%–4.25%. This was hardly a surprise
Rate Cuts and Risky Bets: When the Fed Rolls Out the Red Carpet🎬 The Fed’s June Meeting Is Around the Corner
Mark your calendars: June 17–18 is when the Federal Reserve's Federal Open Market Committee (FOMC) convenes next. With the benchmark interest rate ECONOMICS:USINTR currently holding steady at 4.25% – 4.50%, investors and policymakers alike are keenly awaiting any signals of a shift in monetary policy.
Market expectations suggest a cautious approach, with futures markets indicating a modest probability of rate cuts in the latter half of the year
Perhaps a 'Santa Rally' is just one step away to begin in 2024Stock markets often enjoy a seasonal share boost during the festive period.
It's been two unpredictable year for stock markets after gloomy 2022 but all we are, traders, investors, TradingViewers are hoping for a successful end-of-year boost in the form of a so-called Santa rally.
Shares have much wide, breather and better performance so far in 2024, amid trade and geopolitical tensions, high inflation and high interest rate.
So... while children are compiling their Christmas lists, traders al
Arabica Coffee Futures. The Canary in the Coal MineWith nearly 60 percent up path performance in 2024, Arabica coffee futures rose above $3.00 a pound, the highest mark since May 2011, as traders assess potential problems with next year’s crop in top producer - Brazil.
Despite recent rains, soil moisture levels remain low, leading to limited fruit development and excessive leaf growth, local traders said.
U.S. and European coffee lovers are getting ready to tighten their belts as natural disasters have hit the world’s two largest coffee-produc
Interest Rate Strategies: Trade Smarter with Fed Rate DecisionsInterest Rate Strategies: Trade Smarter with Fed Rate Decisions
Trading interest rates may seem straightforward at first: buy when cuts end and sell when they fall. However, this approach often defies expectations, as determining when rate cuts truly end isn't as simple as pointing to a rate pause following a cut. While today’s Federal Reserve rate decisions are made during scheduled (and unscheduled emergency) Federal Open Market Committee (FOMC) meetings, this wasn’t always the case. Before
Hmm... Something Interesting & Sweet is Brewing in T-Bond MarketIEF is a longer maturity, longer duration play on the US Intermediate Treasury segment. The fund focuses on Treasury notes expiring 7-10 years from now, which have significantly higher yield and interest rate sensitivity than the notes that make up our broader 1-10 year benchmark.
IEF`s average YTM is significantly higher than US-T Aggregated benchmark's. Of course, the higher yield comes with significantly higher sensitivity to changes in rates, particularly those at the longer end of the yie
$USINTR - A Month of BreathThe Federal Reserve left the target for the Fed Funds Rate ECONOMICS:USINTR
unchanged at 5%-5.25%, as expected, but signaled rates may go to 5.6% by Year-End if the Economy and Inflation do not Slow down more.
It is the first pause in the tightening campaign following ten consecutive hikes that lifted borrowing costs by 500bps to the highest level since September 2007.
Throughout Fed's announcement The Dollar Index TVC:DXY
plunged to what can be said Wave C completed from A-B-C
Elliot W
Golden Doomsayer judgment is that inflation still highGold prices traded higher midafternoon on Wednesday as a report showed US inflation is still high.
Gold for June delivery was last seen up, again near US$2,400 per ounce.
The US Bureau of Labor Statistics on Wednesday reported the April consumer-price index rose by 0.3% from March.
Shelter, gas prices remain sticky.
Notable call-outs from the inflation print include the shelter index, which rose 5.5% on an unadjusted, annual basis, a slowdown from March. The Shelter index (the largest US CPI co
🎲 Interest Rates. To Cut, or not to Cut. That is the questionJamie Dimon Sees ‘Lot of Inflationary Forces in Front of Us’, as in recent interview to Bloomberg JPMorgan CEO has warned for months that rates could stay high.
Jamie Dimon said he’s still more worried about inflation than markets appear to be.
The JPMorgan Chase & Co. chief executive officer said significant price pressures continue to influence the US economy and may mean interest rates will be higher for longer than many investors are expecting. He cited costs linked to the green economy, r
MACRO MONDAY 10~ Interest Rate & S&P500MACRO MONDAY 10 – Historical Interest Rate hike Impact on S&P500
This chart aims to illustrate the relationship between the Federal Reserve’s Interest rate hike policy and the S&P500’s price movements.
At a glance the chart highlights the lagging effects of the Federal Reserves Interest Rate hikes on the S&P500 (the “Market”). In all four of the interest rate hikes over the past 24 years the S&P500 did not start to decline until 3 months into an interest the rate pause period (at the earlie
IMPORTANT! Bitcoin Long-term Price Projection Update!I have officially decided to update our long-term price projection for Bitcoin. A major key change is the elimination of the mini-bull market. Instead we are expecting the current bull market to develop into a major bull market. There is also a very high likelihood that this will be the only bull market for the 4th cycle. In this video we partially stepped outside of The Crypto Weather Channel world to explain our reasoning behind these changes. Thanks for watching!
DOW(N)? | A Dollar Milkshake ScenarioI feel bad when I am filling up your feed with my non-stop posting.
There are too many charts that I want to talk about. I could post them as "updates" to my earlier ideas. But this would be confusing for me and for the reader.
Therefore, here is another short chart analysis.
The last few months were peculiar. DJI began diverging away from the other main indices, SPX, NDQ. A significantly strong movement of DJI the last few months brings hope to the Equity Bulls.
A fast and high-reaching B
SPX | Let The Roaring '20s Begin!As the famous billionaire said in December 2021 (elon), the "prophet" who is apparently loved and trusted by everyone. I don't know why...
Disclaimer, SPX by itself will probably not follow this path, things are quite complex as you will soon find out.
First of all, Recession is not something simple. Everyone talks about it, but it is not always meaningful.
This year, equities weren't in a recession. While on the one hand the prices dropped, the denominator (dollar value) increased.
The 2022
Warning DrumsJust a short update for today. It is important, so it deserves an idea on its own.
For the first time since 2019, the FED is now officially giving money into the system.
What could this mean for the US economy? Are they sensing weakness or is this just a response to the recent banking crises?
Now let's look at the history of bailouts.
Price made a higher-high, and stayed high for months until the GFC.
Similarly in 2019, without anyone concerned about recession, the FED pivoted and cut rat
SPX | Early AccessI have posted about this chart before, but I wanted to show it more clearly this time.
Above we see SPX, the standard chart. Below we see a custom index I invented, which is VVIX/VIX. It is a neat way to make sense of the chaotic nature of VIX. To clear things out, I have hidden both charts and instead I show an indicator called WLSMA. It is tremendously helpful to smoothen the "fog" the standard chart creates. In the end I will add the link to the inventor.
I took great care on drawing these
The Oil WarOil is strictly tied to dollar price (petrodollar).
World investors/consumers are under tremendous pressure, with absolute oil price exploding, coupled with an explosive dollar. They have to pay the cost for both...
US investors enjoy a very competitive oil price (compared to treasuries). This year an investment in USOIL was very negatively performing compared to treasuries.
Do note that there is a discrepancy between consumer oil (USOIL) and investment oil (USOIL/modified-yields).
Rate hike
USINTR - still in a upside trend ( wth 30yr backtesting)
*High winning rate with backtesting by my strategy
Right now ECONOMICS:USINTR is still in the upside trend.
This means that it has been consistently performing poorly and may not be a good investment opportunity in the short term.
🔔 Be prepared for reversals.
It's advisable to be patient and wait for the downward trend to occur before the risk market confirms a bullish market again.
Good luck!
This chart measures pain.Spoiler alert, there is a lot.
Inspired by a fellow trader, link to his idea. He is the reason I took the stock market seriously.
An easy-to-explain chart.
As NoOneWhoIsSomeone explained better, FEDFUNDS increases when an economy is strong. Therefore it can be a modificator for prices. The FED increases the rate when it smells money, and money smells when there is strength, historically...
Now the FEDFUNDS race now is for inflation (amongst other conspiracy stuff)
Does this chart work??? I
Inflation!Oh yeah, inflation... Just how much though???
One of the main "benefactors" for inflation is money supply. Printing money fast and not managing it to create growth, is bad... unsurprisingly. For the last 2 years, an astronomical amount of money was printed. But have we seen it's effect?
To figure out these HOT questions, we use charts. Opinions don't do us any good for important issues, facts do.
First: M2SL (Money Supply)
Specifically the rate of change. We use the ROC indicator, set in 2
Hedge for High Interest RatesHere is great high interest rate hedge. While I wanted to use USINTR to compare, it didn't look obvious for easy analysis, so I used USIRYY instead since both are greatly correlated. The Fed keeps talking like a dove but acting like a hawk: like promising soft landings from transitory inflation, yet suddenly choosing rare 75 bps increase, even though they previously implied 50 bps would be the most. So, I expect next few rate raisings will be at least that much, possibly a full point even during
More tightening till Interest Rates match 10Y Bond Yields (US)If history is any indicator we shouldn't expect any pivots in monetary policy until 10Y Bond Yields come down to Interest Rates or Interest Rates hike to the former's level.
For 10Y Bond Yields to come down we need to see lower inflation or inflationary pressure.