PANIC LOW 11/16 2026 f 20 from covid low 3/23/20 spiral The chart is part of my spiral turn work .I see the low in the coming panic on 11/16 it will mark the second low the first is 10/16 or it is the point in which real bad things will occur and we should see chaos I feel it will be due to the events of issues with the timing of the election !!best of trades WAVETIMER !
VT
MAJOR TURN 2/9/2026 plus or minus 1 TD This is the chart I promised to Post But waited till Now . This is my forecast Updated as I have said the market will see 5600/6100 easy my and on 10/10 to 10/20 2026 in the form a large ABC decline ! I see the market still seeing a 7031 in Cash SP 500 into 2/9/26 Best of trades WAVETIMER !
JAPAN TOP HAS FORMED Are we All NEXT ??The chart posted is the Japan 225 AKA the real printing press for the world markets . We topped on oct 29 th and we are now in the double top phase .The Yen Carry trade has had a strong action down as we reached the target 159.3 spot . we Also reach a protection based on FIB relationships going back to 1989 top and the low 2012 There is only one alt projection it is posted on the chart .But I feel it is time to reposition Cash back into the US $ in 90 T bills and be long PUTS . Th
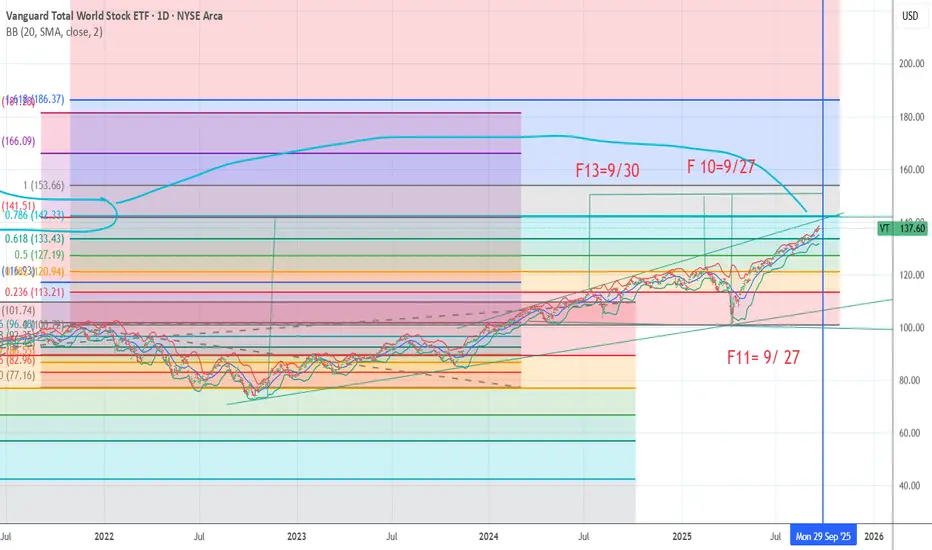
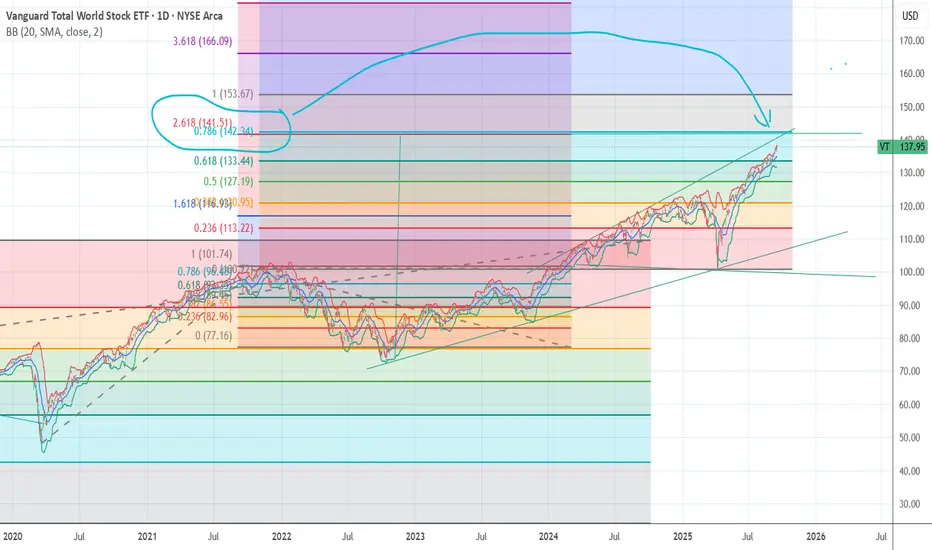
SPIRAL FOCUS POINT 9/27 PLUS OR MINUS 3 DAYS EVENT The chart posted is the next turn within the spirals as we are nearing fib projections and wave A x 1.382 in the sp 500 6648/6671 . I am very bearish again at each turn a minor top has seen a pull back But now the PUT/Call models are Bell ringing . I have covered my short from friday close this morning and based on the Holidays it will be rather thin trading . I will try to be patient and wait now to Re enter the puts best of trades Wavetimer
RSP and WHY I AM BULLISH STILL197/199 target The chart posted is the sp 500 equal weighted RSP has dropped to a trend line dated back to march 23 2020 . I have three clean points and all are major . Elliot Wave calls for a final 5th wave to end this advance in the area of 198 plus or minus 1.25 Fib relationship and PUT /CALL as well as most of my spiral and cycles point to the final advance to a Bull market top is now setup . BULL MARKETS TOP ON GOOD NEWS > Best of trades WAVETIMER
The chart I am posting is The road map for QQQ The chart I am posting is that of the QQQ and what should be the pattern if We are going to see a Final 5th wave to 561 plus or minus 2 . I called for a major turn 11/29 to 12/5 from this we should see a panic or a corrective wave structure I have a grouping of 6 spiral turn from jan 19 to the 25th .I have sold All my longs as we hit price targets for the first leg up and to form the ABC rally .What next possible pattern is abc up for wave 1 or A we should see now a pullback in an abc d
IHDG: A Rising Dollar is No Problem For This Foreign ETFThe US Dollar Index (DXY) has gotten off to a rip-roaring start to 2024. Up more than 2% on the year, the greenback’s ascent comes after significant declines over the final handful of months in 2023. That is usually a headwind for equities, particularly shares of companies domiciled overseas. Not surprisingly, we’ve seen many foreign index funds suffer relative to the S&P 500 thus far in January.
To combat these currency concerns, hedging FX exposure reaps rewards in these environments. The W
Macro Monday 26~Global Indexes Breaking OutMacro Monday 26
Global Index’s Breaking Out
As its Christmas Eve I wanted to do an early release for tomorrow and share something positive and Christmassy but at the same time share something of value, so here is a look at some of the major global ETF index’s and how promising they appear towards the end of 2023. A clear sector stands out.
Vanguard Total World Stock Index ETF - AMEX:VT
In brief this Exchanged Traded Fund (ETF) seeks to track the performance of the FTSE Global All Cap Ind
updated nyse chart target for panic lows oct 2022Final low is in DEC at 8909/9223 I am working on the spirals still from past I will have that within this week . The chart posted is that of the NYSE I use this over all to give me a much clearer view as it is ALL the data . in 1987 panic the market dropped to a near perfect .382 from peak to low oct 1932 . and then again in 2009 the drop from 2000 to 2002 times 1.618 gave us the low .Then again in march 23/2020 from the peak in 2020 to the 1974 low a perfect .382 drop to the low . . I am of the
updated NYSE PANIC AND TARGET OCT 4TH/20TH 10781/9609 Final low is in DEC at 8909/9223 I am working on the spirals still from past I will have that within this week . The chart posted is that of the NYSE I use this over all to give me a much clearer view as it is ALL the data . in 1987 panic the market dropped to a near perfect .382 from peak to low oct 1932 . and then again in 2009 the drop from 2000 to 2002 times 1.618 gave us the low .Then again in march 23/2020 from the peak in 2020 to the 1974 low a perfect .382 drop to th
THE TOP WAVE STRUCTURE AND CYCLE PEAK DUE NOWTHIS is the Top wave structure as stated back about 10 days ago a cycle peak due sept 10/12 I would now look for another drop into the 9/15 /16 and then the LAST RALLY BEFORE THE CRASH Panic cycle as stated in 12/28/ 2021 forecast OCT 4TH TO THE 20TH FOCUS 10/10 PANIC AND ???
TOP WAVE STRUCTURE AVG BEAR MARKET 120 YEARS OF DATA CYCLES We have now most likely seen the turn . we will for the most part have the Bulls staying it is a re test and a bear trap into this OCT . But it is not most of the rallies going forward until we drop in 2700 to 1890 on the sp 500 will at most be.382 to 50 % . The Battle between Inflated assets { Debt based } And Food costs due the Drought cycles and Population and coming default cycles . Did I mention the Baby boomers are at 26.7% of USA Population . and t
NEW WAVE B LOW COMING 3588/3490 FOCUS 3511 So far the first leg of the bear market has come to an end we had a very clear abc rally for wave A up we should now see an abc drop into a new low at which time I will be going long once again the last wave gave us my 10 to 14 % based in the trow and qqq and perfect in spy target 393 . I have taken profits on ALL trades and will wait till july 5th . once the next shoe falls this will then see the next rally to 4110 to 4180 that will mark the summer peak then the CRASH WAVE into t
Global Markets Are Going To Collapse.It's finished. we see bullish signs but it is not enough the world is upside down and so will the markets be once they catch up to reality.
AMEX:VT
CRYPTOCAP:TOTAL
COINBASE:BTCUSD
AMEX:VTI
AMEX:SPY
OANDA:XAGUSD
OANDA:XAUUSD
TVC:USOIL
FOREXCOM:USDRUB
OANDA:USDCNH
SP:SPX
CURRENCYCOM:US100
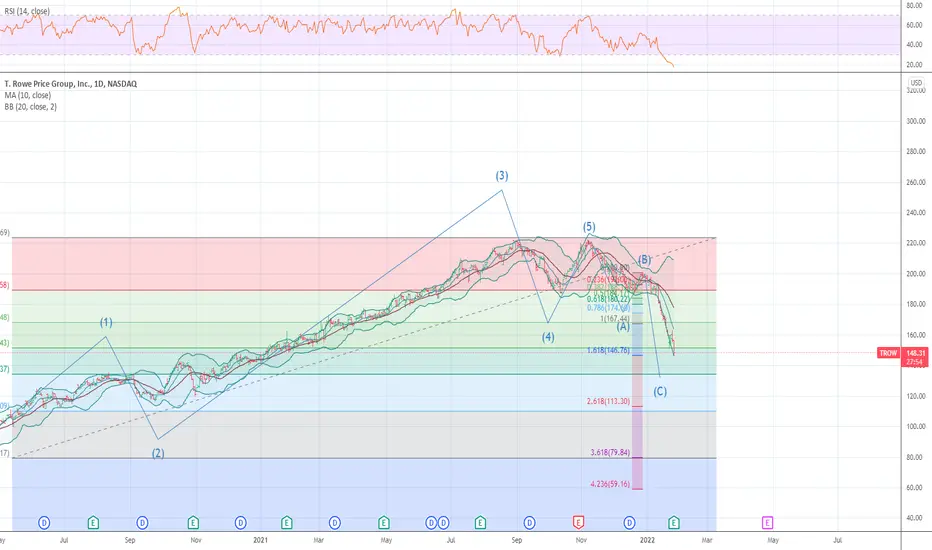
TROW MODEL WE ARE GOING TO FIND SUPPORT .618I have been posting that the spring and a date jan 27 time frame would be an event I feel that the downside is focused at gold ratio support and max fear this is wave A within the bear market the final low is due oct 4 of this year but we are near the bottom and will soon see a rally for a few weeks after this cycle is ended .I will post detail later this sunday
The Dow Jones's Weekly RSI is overbought and turning downThe Dow Jones's Weekly RSI is Turning Down From Overbought Territory. I went short one DJI future last week which did well. I opened an SDOW position in my 401k which got stopped out around breakeven after the overnight rally extending into Friday's daytime rally. I went short another future Friday at $23410. The US central bank has stopped quantitative easing and is supposed to be slowly unwinding their massive balance sheet in US Treasuries. In my 401k I will open a half SDOW position tod