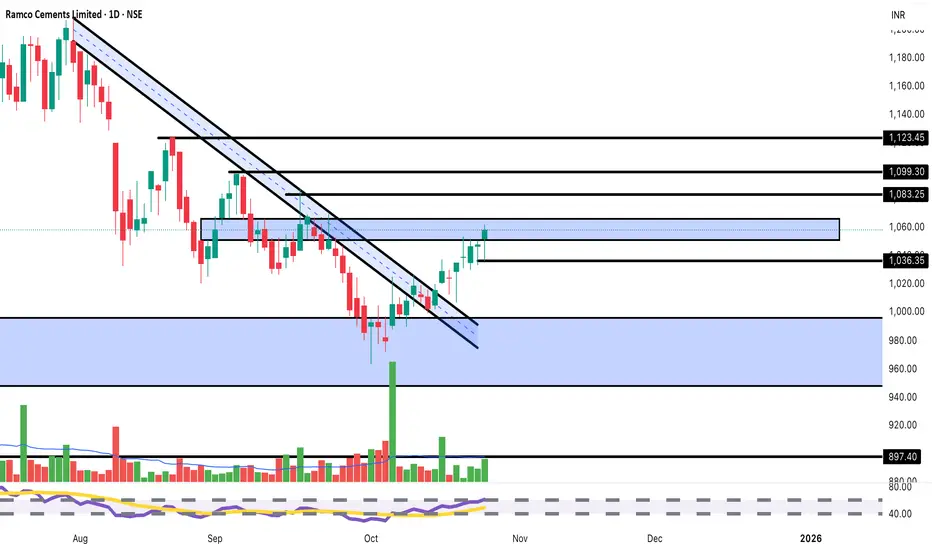
Ramco Cements Breaking Key Resistance | Target 1,100+BUY Setup 🏗️
Entry: ₹1,058-1,065 (Current Level)
Target 1: ₹1,083-1,090
Target 2: ₹1,099-1,110
Target 3: ₹1,123-1,135 (Extended)
Stop Loss: ₹1,036
Technical Rationale:
Breaking above descending channel (blue shaded area) - major bullish reversal
Strong momentum with +1.11% gain today
Price reclaiming 1,060 resistance zone
Breaking above both declining trendlines convincingly
High volume (343.03K) supporting the breakout
Consolidation zone (1,000-1,060) now acting as support
RSI trending upward, showing momentum building
Cement sector showing strength on infrastructure demand
Multiple resistance levels mapped: 1,036, 1,083, 1,099, 1,123
Clear support at 1,000 psychological level
V-shaped recovery from October lows
Risk-Reward: Strong 1:3+ ratio
Pattern: Falling wedge/descending channel breakout - highly reliable bullish reversal pattern
Strategy: Medium-term swing trade - Book 30% at T1 (1,085), 30% at T2 (1,105), trail remaining with SL at 1,065 after T1
Key Levels:
Breakout Zone: 1,060 (critical level crossed)
Strong Resistance: 1,083, 1,099, 1,123
Major Support: 1,036, 1,000, 980
Sector Catalyst:
Infrastructure spending boost expected
Cement demand picking up seasonally
For educational purposes only. Not SEBI registered. Major pattern breakout - manage position sizing appropriately. Cement stocks can be volatile. Conduct thorough research before investing.
Wedge
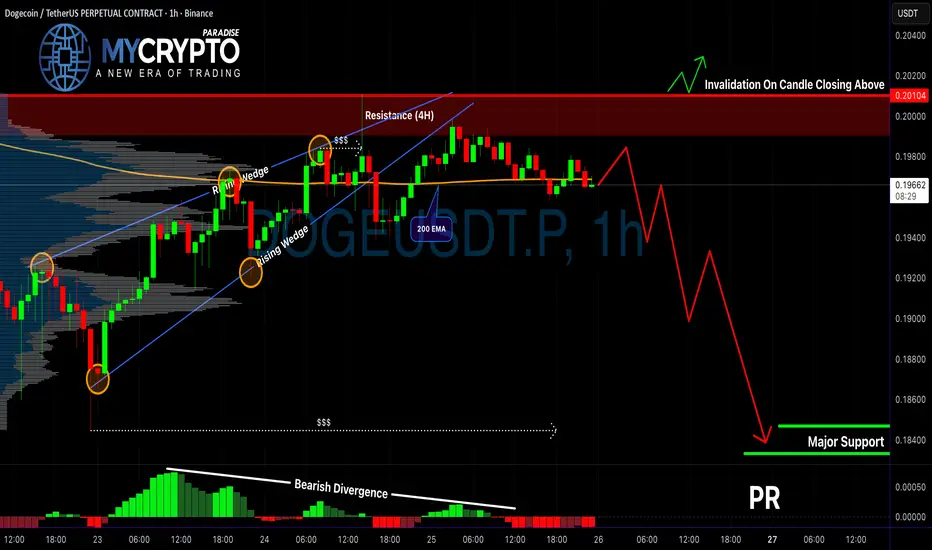
DOGE Is Setting Up for a Trap?Yello Paradisers, are you thinking of shorting DOGE right now? Be careful—this setup might look obvious, but it could also be the start of a classic trap. Let’s dig into what the charts are really telling us.
💎DOGEUSDT is currently reacting from a strong 4H resistance zone, which already gives us an early warning of potential rejection. Zooming into the 1H timeframe, price has broken down Rising wedge with bearish divergence. This isn’t just a random move; it's supported by confluence, especially with the 200 EMA acting as dynamic resistance on the 1H. That kind of layered rejection significantly increases the probability of a further bearish continuation.
💎For aggressive traders, there’s a potential to enter at the current price, but that comes with higher risk. For those who prefer a safer approach, the better play is to wait for a proper pullback and retest of the resistance zone. If the price returns to that level and forms a bearish candlestick pattern, it could provide a much cleaner and higher-probability short setup—along with a bigger reward-to-risk ratio.
💎However, if DOGE breaks out and closes a candle above the resistance zone, this would invalidate the entire bearish scenario. In that case, we’ll need to stay patient and wait for more reliable price action before making any decisions.
🎖Strive for consistency, not quick profits. Treat the market as a businessman, not as a gambler.
MyCryptoParadise
iFeel the success🌴
BB | BlackBerry Is About To Pop | LONGBlackBerry Ltd. engages in the provision of intelligent security software and services. It operates through the following segments: Cybersecurity, Internet of Things (IoT), and Licensing and Other. The Cybersecurity segment includes the brand Cylance, BlackBerry Spark, AtHoc, and SecuSUITE. The IoT segment focuses on software licenses, support, maintenance, and professional services. The Licensing and Other segment involves the intellectual property licensing arrangements and settlement awards. The company was founded by Michael Lazaridis, James Laurence Balsillie, and Douglas E. Fregin on March 7, 1984 and is headquartered in Waterloo, Canada.

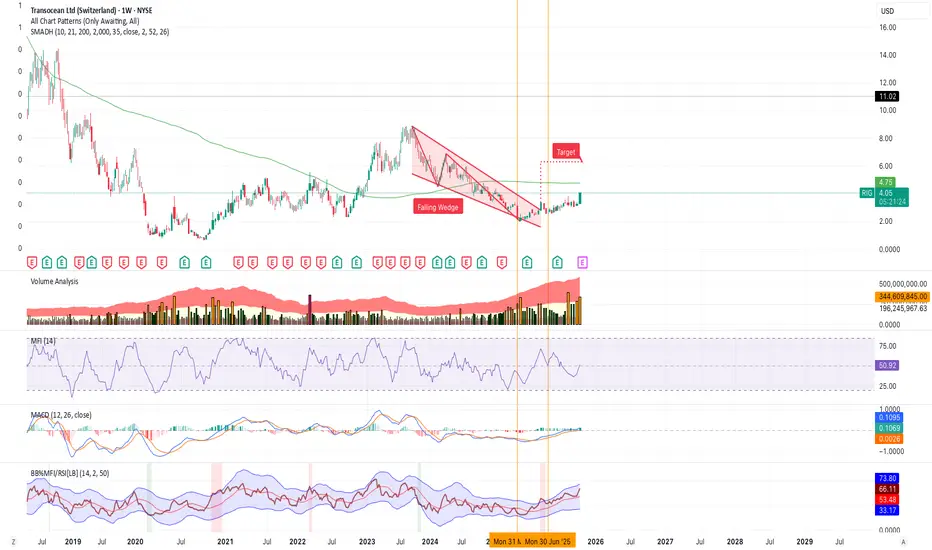
$RIG approaching 200W moving averageNYSE:RIG is approaching its 200-week smoothed moving average on unusually strong volume. I will be watching for a clear break and support on it. The last time this occurred, the stock doubled. With growing recent volume, a strong uptrend appears to be in play. This narrative could develop significantly if geopolitics continue to push oil and gas. Additionally, D. E. Shaw upped their holdings of NYSE:RIG by +1,000% last quarter (between the orange vertical lines), which I like to see.
GBPUSD Might Take Advantage of Broken WedgeGBPUSD presents a long opportunity after retesting the broken wedge. Entry is slightly above 1.34 with a target of 1.3490. The risk-reward ratio is 2.1.

NZDUSD; Ascending Channel!..Lets take a sight on NZDUSD:
The pair is scaling on a bullish trend of higher highs and higher lows, which currently the price is at the major resistance level. there is more possibility of breakout above the resistance with target towards 0.5800, in respect to the bigger time frames.
Possible outline:
As we expects a breakout above, the best alternative at the moment is to sell at resistance and buy at support.
Like and follow up.
Thanks for reading.

BTC 4h LONGCRYPTOCAP:BTC 4H Chart
Bitcoin breaking out from a falling wedge structure — a classic bullish reversal pattern.
Momentum indicators turning positive, confirming a potential trend shift.
📈 Entry: Upon breakout confirmation
🎯 TP1: 113K
🎯 TP2: 116K
🛡️ Stop-loss: Below 109K
If the wedge breakout holds, we could see a strong continuation move toward the upper targets.
#Bitcoin #BTC #Crypto #TradingView

USDCHF short calling this trade
USDCHF sell.
broke the rising wedge
creaated a continuation pattern for entry to the downside.

Falling wedge, bullish opportunityFalling edge pattern detected with opposite RSI. Bullish move expected.

Rising Broadening Wedge BreakdownBTC.D broke down from a two and a half year long rising broadening wedge pattern on high volume. The re-test flushed out leverage traders and low caps (including equities) are now ready to perform better than high caps, at least as long as BTC.D keeps falling. Let's use the fear and make good gains in the coming weeks/months. Just give it a little bit time. Timing + Patience = Key!

Bitcoin at the Top of Wedge – Bearish Reversal Coming Again?As I expected in yesterday’s idea , Bitcoin dropped to the $107,800 level, hitting its target .
In the last few hours, BTC started to pump again and is now trading near a cluster of resistances : the 100_SMA(Daily) , the 50_SMA(Daily) , and Cumulative Short Liquidation($117,517-$116,020) . This creates a strong resistance , and I don’t think Bitcoin will easily break through it. ( As of the time of writing, there’s no fresh news influencing the market .)
From an Elliott Wave perspective, it looks like Bitcoin is forming a Triple Three Correction(WXYXZ ).
On the Classical Technical side, Bitcoin is at the top of an ascending broadening wedge pattern , which is a reversal pattern . There’s also a Regular Bearish Divergence (RD-) between the two peaks in this pattern.
I expect that in the coming hours, Bitcoin will start to drop again. After breaking the important $111,000 level , it could fall at least to the lower line of the ascending broadening wedge .
Note: In these past few days, the Bitcoin and crypto market have been quite volatile and driven by news, especially related to US-China tensions. So always manage your risk carefully and avoid impulsive decisions based on sudden headlines.
New CME Gap: $107,690-$107,220
Cumulative Long Liquidation: $107,105-$104,297
Cumulative Short Liquidation: $115,241-$113,454
Stop Loss(SL): $116,200
Please respect each other's ideas and express them politely if you agree or disagree.
Bitcoin Analysis (BTCUSDT), 1-hour time frame.
Be sure to follow the updated ideas.
Do not forget to put a Stop loss for your positions (For every position you want to open).
Please follow your strategy and updates; this is just my Idea, and I will gladly see your ideas in this post.
Please do not forget the ✅' like '✅ button 🙏😊 & Share it with your friends; thanks, and Trade safe.

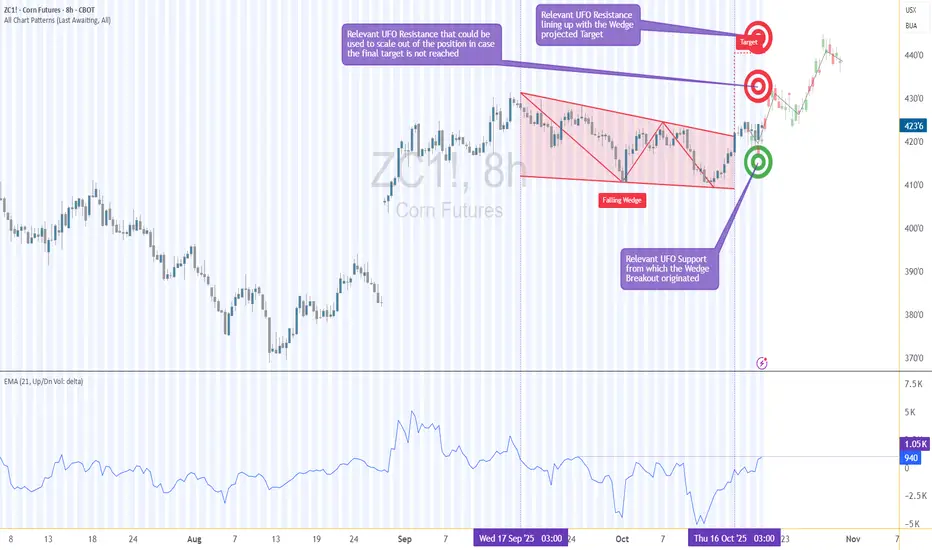
Breakout or Fake-Out? Corn Just Kissed Its Support!1. The Setup
Corn’s doing exactly what disciplined traders hoped for — pulling back to the same UFO support zone that powered the earlier wedge breakout. On the 8-hour chart, price just kissed that 418–411 area… a textbook retest where new buyers could reload the bushels.
2. The Context
We saw this coming. The initial breakout looked flashy, but the volume delta wasn’t convinced — it stayed soft. Now that price has tapped into the unfilled-order pocket, watch to see if the delta turns positive again. That’s the “ignition spark” that often separates real breakouts from fakes.
3. The Game Plan
The playbook hasn’t changed — only the timing has improved.
🎯 Entry idea: around 418 support
🛑 Stop: 411 (below the UFO zone)
📈 Targets: 430 and 442
⚖️ Reward-to-Risk ≈ 3:1
This is patience in action — waiting for the market to come to you instead of chasing it.
4. The Specs
ZC – Corn Futures: 5 000 bushels · Tick = ¼ ¢ ($12.50) · ≈ $1 000 margin
MZC – Micro Corn Futures: 500 bushels · Tick = ½ ¢ ($2.50) · ≈ $100 margin
Same analysis, smaller bite size — perfect for managing exposure while keeping precision.
5. The Takeaway
Volume shows what’s already been eaten; UnFilled Orders at support show what’s still on the table.
Corn just revisited the buffet — now we wait to see if buyers come back for seconds. 🌽🔥
Want More Depth?
If you’d like to go deeper into the building blocks of trading, check out our From Mystery to Mastery trilogy, three cornerstone articles that complement this one:
🔗 From Mystery to Mastery: Trading Essentials
🔗 From Mystery to Mastery: Futures Explained
🔗 From Mystery to Mastery: Options Explained
When charting futures, the data provided could be delayed. Traders working with the ticker symbols discussed in this idea may prefer to use CME Group real-time data plan on TradingView: www.tradingview.com - This consideration is particularly important for shorter-term traders, whereas it may be less critical for those focused on longer-term trading strategies.
General Disclaimer:
The trade ideas presented herein are solely for illustrative purposes forming a part of a case study intended to demonstrate key principles in risk management within the context of the specific market scenarios discussed. These ideas are not to be interpreted as investment recommendations or financial advice. They do not endorse or promote any specific trading strategies, financial products, or services. The information provided is based on data believed to be reliable; however, its accuracy or completeness cannot be guaranteed. Trading in financial markets involves risks, including the potential loss of principal. Each individual should conduct their own research and consult with professional financial advisors before making any investment decisions. The author or publisher of this content bears no responsibility for any actions taken based on the information provided or for any resultant financial or other losses.

CAN BASUSDT Reclaim RECENT HIGHSTaking a closer look at BASUSDT recent performance technically, the retracement into the demand zone, and currently showing exhaustion in sell candles, a buy back into recent highs can position this crypto as a good game changer in my trading portfolio. Come back in 1 month into BASUSD to check where we end up

BTC - History Doesn’t Repeat, But It Rhymes!Bitcoin has always been a market of patterns, and when you zoom out, the weekly chart tells a familiar story.
🏹 Each major bull cycle follows a similar rhythm : a strong rally, a sharp correction, a fakeout below support, and then another impulsive leg higher.
We’ve seen this movie before. In 2023, BTC broke its structure briefly before continuing its climb. Again in 2024, the market dipped below the trendline, shaking out late buyers, only to bounce and push to new highs. Now, in 2025, we’re testing that same rising trendline once again, showing another possible “fakeout before takeoff” scenario.
🔄If history continues to rhyme, this pullback could mark the final correction before BTC resumes its journey toward the upper boundary of the rising channel - possibly into the 150K–160K zone over the next phase.
But if this time is different and BTC fails to reclaim the trendline, we could witness a longer consolidation phase before the next major impulse.
The key remains the same: watch the weekly close around the trendline. Each time BTC dipped below and reclaimed it, the next move was explosive.
History might not repeat perfectly - but it tends to rhyme beautifully.
📊All Strategies Are Good; If Managed Properly!
~Richard Nasr

NZDUSD short we see dollar strength coming in at the start of the week.
we see price had a massive impulse more down.
created a retracement and a continuation pattern, a rising wedge.
which broke out. now expecting a move to the downside

Breakout or Fake-Out — Corn’s Price Action Under the Microscope1. When Breakouts Lie
Few things in trading are more exciting than a clean breakout. But for every breakout that soars, there’s another that fakes out and traps eager traders.
Corn Futures (ZC) on the 8-hour chart just gave us that classic test — a breakout from a falling wedge that has traders asking: Is this the real thing, or another false alarm?
The pattern looks textbook. Price compressed lower within a wedge and broke above its upper trendline. However, the true strength of any breakout lies not in the pattern itself, but in the story told by volume and order flow. That’s what we’ll unpack in this article — using ZC (Corn Futures) and MZC (Micro Corn Futures) as our guide.
2. The Falling Wedge in Focus
Falling wedges often represent market exhaustion, where selling pressure slows and buyers quietly begin to accumulate positions. On the Corn Futures 8-hour chart, price has indeed pushed beyond the wedge’s descending resistance line — the visual signal that usually excites breakout traders.
But structure alone doesn’t make a sustainable move. Beneath the surface, the UFO support and resistance levels — zones of UnFilled Orders — provide the invisible scaffolding that can support or reject price movement.
In this case:
Support Zone: 418–411
Resistance Levels: 430 and 442
These areas represent pending potential new support and resistance areas where buy and sell orders that can act as launchpads or barriers. The key is to see how the market interacts with them while volume builds or fades.
3. The Volume Delta Story
Here’s where things get interesting.
Volume Delta — the difference between buy and sell volume — shows us who’s winning the tug-of-war between buyers and sellers.
During the wedge formation, the maximum delta reached +1.05K, indicating meaningful buying activity despite the downtrend. But as the breakout unfolded, delta turned slightly negative. In plain terms, fewer new buyers are stepping in — and without new buying energy, breakouts often lose traction.
That’s a classic setup for a potential fake-out: price pokes above the wedge, but order flow doesn’t confirm. This mismatch between technical breakout and volume delta is often the canary in the coal mine for fading momentum.
4. The Trade Logic — Let the Market Come to You
Instead of chasing the breakout, the smarter play here could be to wait for the market to revisit demand/support.
Why? Because that’s where new volume tends to enter — where pending buy orders (the UFOs) become filled, strengthening the delta and giving the move fresh fuel.
A potential plan might look like this:
Entry: 418 (within support)
Stop-Loss: 411 (below the zone)
Target 1: 430 (first resistance, partial exit)
Target 2: 442 (final resistance, full exit)
This setup maintains a clear reward-to-risk ratio above 3:1, assuming disciplined execution and volatility-adjusted sizing. It’s not about prediction — it’s about preparation. Waiting for retracement allows participation in a confirmed move, rather than reacting to emotional excitement at the breakout.
5. Contract Specifications & Margin Requirements
Understanding your instrument is as important as reading your chart.
Here’s what traders should know about these CME-listed Corn contracts:
ZC – Corn Futures (Standard Contract)
Contract Size: 5,000 bushels
Tick Size: ¼ cent per bushel (0.0025) → Tick Value = $12.50
Approx. Margin: Around $1,000 USD, varying by broker and volatility
MZC – Micro Corn Futures
Contract Size: 500 bushels (1/10th of ZC)
Tick Size: ½ cent per bushel (0.0050) → Tick Value = $2.50
Approx. Margin: Around $100 USD, varying by broker and subject to market conditions
Micro contracts allow smaller-scale traders to apply the same analysis and structure as the full-size contract, but with controlled risk exposure — a major advantage for capital management.
6. When New Volume is Injected in the Market
Think of Volume Delta as a glance in the rear-view mirror — it tells us what’s already been filled. On the other hand, analyzing support and resistance levels with the idea of where new unfilled orders might come in helps us prepare to enter trades just before momentum potentially reactivates.
When both are combined:
Rising delta confirms a healthier follow-through on breakouts.
Negative delta near resistance warns of a likely fading move.
Key support and resistance zones show where resting orders could inject new volume.
7. Risk Management — Protect Before You Project
Every solid trade plan starts with a stop.
For this setup, a logical stop below 411 ensures protection if the wedge breakout fails completely.
Scaling out at 430 reduces exposure early, locking gains in case the move stalls.
Always size positions relative to account equity and volatility — the most underrated edge in trading is survival.
The best traders don’t just hunt profits — they hunt consistency. Managing risk transforms a potentially stressful market environment into a structured decision process.
8. CME Context & Final Thoughts
Both ZC and MZC are cornerstone agricultural contracts traded on the CME Group’s CBOT exchange, giving traders exposure to one of the world’s most economically significant commodities.
While the setup we’ve explored is a case study, the takeaway extends beyond Corn:
Breakouts need participation. Volume confirms conviction. Key support and resistance levels reveal intention.
In markets where fake-outs are common, aligning technical structure, order flow, and patient trade planning gives traders the clearest edge of all — confidence grounded in data, not emotion.
When charting futures, the data provided could be delayed. Traders working with the ticker symbols discussed in this idea may prefer to use CME Group real-time data plan on TradingView: www.tradingview.com - This consideration is particularly important for shorter-term traders, whereas it may be less critical for those focused on longer-term trading strategies.
General Disclaimer:
The trade ideas presented herein are solely for illustrative purposes forming a part of a case study intended to demonstrate key principles in risk management within the context of the specific market scenarios discussed. These ideas are not to be interpreted as investment recommendations or financial advice. They do not endorse or promote any specific trading strategies, financial products, or services. The information provided is based on data believed to be reliable; however, its accuracy or completeness cannot be guaranteed. Trading in financial markets involves risks, including the potential loss of principal. Each individual should conduct their own research and consult with professional financial advisors before making any investment decisions. The author or publisher of this content bears no responsibility for any actions taken based on the information provided or for any resultant financial or other losses.
FTSE 100 Outlook: Twin Bullish Signals Point to Fresh HighsFresh record highs for the FTSE 100 contract may be on the cards, with consecutive bullish signals pointing to growing upside risks.
The first arrived on Friday with a hammer candle on the daily chart, rebounding strongly after testing the 50-day moving average. That was followed on Monday by another large bullish bar that saw the price break out of the falling wedge pattern it had been trading in for much of the past month. The breakout points to the risk of further upside ahead, putting the record high of 9,579 set on October 8 on the menu for bulls.
Given the twin bullish signals, traders may want to consider initiating longs around these levels or slightly lower, targeting 9,485 or the record highs. Stop placement should reflect the desired risk-reward you’re seeking from the trade.
RSI (14) has broken its downtrend and now sits in marginally bullish territory. MACD also remains in positive territory despite crossing the signal line from above earlier this month and is now starting to flatten out. Combined, the two indicators suggest diminishing bullish momentum may be in the early stages of building again, improving the probability of the breakout playing out in full.
Good luck!
DS

NZDUSD: Bullish Anticipation..NZDUSD have been scaling on a momentum region of lower high and lows, which the pair is currently at the support zone and price slowly heading up. there is a chance of bullish at the moment in regard to the trendline structure.
Meanwhile we keep a close look at 0.5968 as the next partial resistance.
Hello traders, what is your idea on this ?
Thanks for reading.

CADJPY: Bearish Move From Resistance Confirmed 🇨🇦🇯🇵
There is a high probability that CADJPY will retrace
from the underlined daily resistance.
A breakout of a support line of a rising wedge pattern
on 1H time frame provides a strong bearish signal.
I expect a retracement at least to 107.26
❤️Please, support my work with like, thank you!❤️
I am part of Trade Nation's Influencer program and receive a monthly fee for using their TradingView charts in my analysis.

PDS Ltd (NSE: PDSLTD)After months of steady decline, price is trying to form a short-term base near 295–300.
It has reclaimed the 23.6 % Fib zone and is testing 316 resistance a daily close above this could open room toward 343 to 357.
Support at₹294 to 280 if losing those would resume the downtrend.
Fundamentally, PDS remains a key player in apparel sourcing with strong global links. but slower export demand and margin pressure have kept the trend weak. Any rebound in orders or rupee depreciation could help it recover.
Bias: Watch 320 for breakout confirmation. Below 294 = caution above 320 = potential trend reversal.
This chart is for educational use only and not a buy/sell recommendation.

MeghaHorn or BowTie Pattern !!!Key Observations:
Pattern Formation:
A broadening wedge or megaphone pattern (also likened to a bow tie) is forming.
Price is oscillating between expanding trend lines.
Labeled waves: 1, 2, 3, 4, 5 within the pattern.
Critical Zones:
Buy Above: $2,815.98 (upper boundary of the wedge).
Sell Below: $2,258.03 (lower boundary of the wedge).
No Trading Zone: Between $2,258 – $2,815 (uncertainty/consolidation area).
Price Target:
If price breaks below, Target 1 is indicated around $1,800 or below (implied from structure).
Current Price:
Trading at $2,748.56, up +5.05%, within the “No Trading Zone”.
Summary:
The chart suggests waiting for a breakout or breakdown from the wedge pattern to determine the next move. A breakout above $2,815 could signal a buy opportunity, while a breakdown below $2,258 could trigger a sell with a potential target near $1,800.
Ask ChatGPT

When Everyone’s Buying, I’m Watching for the TopAs we’ve grown used to by now, Gold sets a new ATH almost every day — and by the time we, in Europe, wake up, it’s already 300–400 pips higher.
Yet despite the strong bullish momentum, speculative trading remains extremely difficult. Sudden drops of hundreds of pips can easily hit your stop loss if your entry timing isn’t perfect.
From my perspective — even though I don’t have an open position — the idea remains the same: a correction is inevitable.
Since Friday’s low, the price has rallied around 3,000 pips — a fabulous move, but like any late-stage rally, it’s becoming excessive and irrational (even more than it already was).
Of course, it can always go higher, but the more it exaggerates, the faster it tends to normalize.
As I mentioned before, my approach remains focused on identifying potential tops — and while that’s the riskiest thing a trader can do, it has worked quite well during the sharp downward spikes of the last two weeks.
Technically, the move from Friday’s low is forming a rising wedge, with resistance around 4270, which is where I’ll be looking to sell.
The target zone is roughly 1,000 pips lower.
One encouraging factor — even more so than before — is the noticeable narrowing of the spread between futures and spot, now at just 0.2–0.25%, compared to the usual ~1% (and sometimes higher) during strong bullish phases.

NExt LEg for EURCADA correction phase in play or short retracement into higher highs. The market leads, I follow
