LOOKS token to print a 10,000% move?On the above 4-day chart price action has corrected 99% since January 2022. A number of reasons now exist to be long, including.
1) Price action and RSI resistance breakouts.
2) Multiple oscillators print positive divergence with price action. The higher the time frame you go the stronger the divergence.
3) While the market has been in full panic mode volume has only increased on this token. I don’t know why. Every sell off is met with a large volume increase.
4) Not listed on major exchanges. Get in before crowd.
5) The falling wedge forecast. The forecast is measured from the highest to the lowest touch points. (Red circles). This is how a target from a wedge is forecast.
Is it possible price action continues correcting? Sure.
Is it probable? No.
Ww
Type: trade
Risk: <=6%
Timeframe for long: Yesterday
Return: 100x
Wedge

MDT LongWedge breakout
Long entry 97
Stop 95
Target 105, 120 (Weekly chart target)
Risk management is much more important than a good entry point.
I am not a PRO trader.
In my trading plan, the Max Risk of each short term trade should be less than 1% of an account.


DOW JONES INDEX (US30): Bullish Setup Explained
Dow Jones broke and closed above a resistance line of an
expanding wedge pattern.
An occurrence of a consequent change of character suggests
a highly probable bullish continuation.
The market will most likely reach 48527 soon.
❤️Please, support my work with like, thank you!❤️
I am part of Trade Nation's Influencer program and receive a monthly fee for using their TradingView charts in my analysis.

Just an ideaentry 4402
tp1-4445
tp2-4505
not an advice, just my idea for today and maybe tommorow also

Bicoin Market Cycle - ChannelBitcoin is in its own cycle and now we are in the channel phase and in my opinion $145,000 to $150,000 is the target for a Measeured Move and after that Bitcoin will fall to $40,000 or $50,000. So try not to buy Bitcoin at these prices as it is very expensive.

ROAD TO 15 CENTS (4h)ROAD TO 15 CENTS
We can be hopeful that after breaking out of the wedge, we will see significant price growth.AB=CD
Best regards CobraVanguard.💚
Give me some energy !!
✨We spend hours finding potential opportunities and writing useful ideas, we would be happy if you support us.
Best regards CobraVanguard.💚

Bullish potential detected for KLREntry conditions:
(i) higher share price for ASX:KLR along with swing up of indicators such as DMI/RSI, and
(ii) observing market reaction around the $0.19 resistance area from 21st November.
Depending on risk tolerance, the stop loss for the trade would be:
(i) below the potentially rising 30 day MA (currently $0.161), or
(ii) below the recent swing low of $0.15 of 29th December, or
(iii) below the ultimate swing low of $0.125 of 15th December.

DOCU LongDemand Zone had been confirmed
Long entry 65
Stop 62
Target 86, 107, 150 (Weekly chart target)
Risk management is much more important than a good entry point.
I am not a PRO trader.
In my trading plan, the Max Risk of each short term trade should be less than 1% of an account.

SPY LongAscending triangle pattern in Uptrend, which is a strong bullish continuation pattern.
Trendline touch.
Long entry 681
Stop 677 (when trendline break)
Target 725 (top line of uptrend wedge)
Risk management is much more important than a good entry point.
I am not a PRO trader.
In my trading plan, the Max Risk of each short term trade should be less than 1% of an account.

KFin Technologies — Weekly Chart ANALYSISStock is consolidating inside a symmetrical triangle near the apex.
Strong demand zone: ₹880 – ₹820.
As long as price stays above this zone, structure remains positive.
Bullish Trigger
Weekly close above ₹1,120 – ₹1,140
Possible upside levels → ₹1,220 → ₹1,320 → ₹1,420
Bearish Trigger
Breakdown below ₹980
Stock may retest ₹900 → ₹850 → ₹820
Bias
Mildly bullish while above ₹900–₹880
Wait for clear breakout / retest confirmation
Disclaimer
This is a technical analysis view for educational purposes only, not investment advice.

Update: IREN Limited (IREN) - structure beats emotionsIREN Limited operates in Bitcoin mining and AI cloud infrastructure, focused on renewable energy and scalable data centers. Mining is the core revenue driver, AI services are still small but growing fast.
On the daily chart, a falling wedge has been broken to the upside, followed by a clean retest. The structure is holding. Price is now sitting in a strong daily support zone at 36–38, aligned with the 0.618 Fibonacci level.
MACD is turning bullish on higher timeframes, and short- to mid-term moving averages are stabilizing. This looks like accumulation after a deep correction, not a random bounce.
By the end of 2025, IREN scaled materially.
Revenue grew from $184M in 2024 to roughly $485M in 2025.
Bitcoin mining remains the main contributor, while AI Cloud Services added about $16M and continue expanding.
Consensus estimates point to ~$230M revenue in Q2 2026. EPS is still negative, which fits a capital-intensive expansion phase.
As long as price holds 36–38, the market is pricing a move toward 50 → 60 → 70.
This is not a one-day trade. It’s a structural recovery setup.
The chart already did the talking.

RLC/USDT | Falling Wedge Breakout WatchThis analysis reflects my personal view on the RLC/USDT trading pair based on technical analysis. The idea is shared for educational and informational purposes only and should not be considered financial advice. Market conditions can change rapidly, so always do your own research and risk management before making any trading decisions.
bullish breakout above wedge resistance with strong volume confirmation is required. If confirmed, a fast upside move may follow.
This bullish scenario is invalidated if price breaks below wedge support.
Feedback and alternative views are welcome.* /Sanaz/

AT-TAHUR | 4H – Falling Wedge Breakout SetupPrice has completed a falling wedge and is showing higher lows, signaling potential bullish continuation. Momentum is slowly building with structure support holding well.
Entry: 41.88
Stop Loss: 37.51
Targets:
TP1: 46.34
TP2: 50.33
TP3: 55.28
Structure: Higher Low + Breakout confirmation

PAA Longtrendline break + retest + wedge (continuation pattern)
Long entry 17.8
Stop 17.3
Target 20.5, 31 (Monthly chart target)
Risk management is much more important than a good entry point.
I am not a PRO trader.
In my trading plan, the Max Risk of each short term trade should be less than 1% of an account.

Selena | XAUUSD – 15M | Bullish Market Structure ContinuationPEPPERSTONE:XAUUSD FOREXCOM:XAUUSD
After the bullish BOS, price pulled back toward the lower channel boundary and previous structure support, where strong demand and liquidity absorption were observed. This pullback appears corrective rather than distributive, indicating buyers are still in control. Market behavior suggests accumulation before the next expansion leg.
HIGHER TF THOUGHT
Key Scenarios
✅ Bullish Case 🚀
As long as price holds above the marked demand / buy area, continuation toward the upper channel and buy-side liquidity is expected.
🎯 Target 1: Recent high
🎯 Target 2: Upper channel resistance
🎯 Target 3: Psychological resistance zone above
❌ Bearish Case 📉
A sustained breakdown and close below the demand zone / higher low would invalidate the bullish structure and delay continuation, opening room for deeper correction toward the channel base.
Current Levels to Watch
Resistance 🔴: Upper channel & previous highs
Support 🟢: Buy area / demand zone aligned with structure support
⚠️ Disclaimer: This analysis is for educational purposes only. It is not financial advice. Please conduct your own research before trading.

XAUUSD“Gold is seeking additional liquidity to achieve distant all-time highs. If the pattern is completed, we may see a strong correction in gold during the early months of 2026, followed by another aggressive rally. However, political and military events may have a different say.”

7202- deep retracement7202
- Price has retraced to 78% fib levels,
- narrowing down in a falling wedge,
- reaching a strong weekly/monthly support of 218.
- Showing bullish divergence on weekly TF.
CMP 221.
For swing trade, it would be good to accumulate with SL 215 on weekly closing basis.
For traders, wait for at least one green candle at support.
I expect it to rebound and hit trading targets 235-249
For reversal, it needs to close above 272.

BITF - when structure starts to matter more than headlinesBitfarms Ltd. is a publicly traded Bitcoin mining company operating large scale mining facilities across North and South America. The core business is cryptocurrency mining with a strong focus on energy efficiency, infrastructure ownership, and geographic diversification across Canada, the United States, Argentina, and Paraguay.
From a fundamental perspective as of late 2025, Bitfarms remains a growth focused company still in its investment phase. The upcoming Q4 2025 report is expected to show EPS around −0.04 USD with projected revenue near 66.45M USD. Throughout 2025, quarterly revenue has remained relatively stable in the 69–78M USD range, driven primarily by the cryptocurrency mining segment. Cash flows remain volatile and free cash flow is still negative, which is typical for miners actively expanding capacity and upgrading infrastructure. This is not a dividend or value story, but a leveraged bet on scale, efficiency, and the broader crypto market cycle.
Technically, the structure is clean and well defined. On the 4 hour chart, price formed a falling wedge that has already broken to the upside with a clear and confirmed retest. The breakout held, sellers failed to push price back inside the pattern, and momentum stabilized. All previously existing gaps have now been fully closed, reducing downside risk from unfinished price imbalances. Price is currently sitting on a strong daily support zone, while the working timeframe remains the 4 hour chart. Higher timeframe structure confirms support validity, and price action shows early accumulation behavior.
From a tactical standpoint, Bitfarms is transitioning from a corrective phase into a potential new impulse. As long as price holds the current support zone, the path opens toward the 3.91 area. If the broader structure remains intact and crypto sentiment stays constructive, continuation toward the 6.60 zone becomes technically justified. This is not a short term hype trade, but a structured continuation setup after a confirmed breakout and retest.
Sometimes the market clears all unfinished business first, and only then starts the real move. .

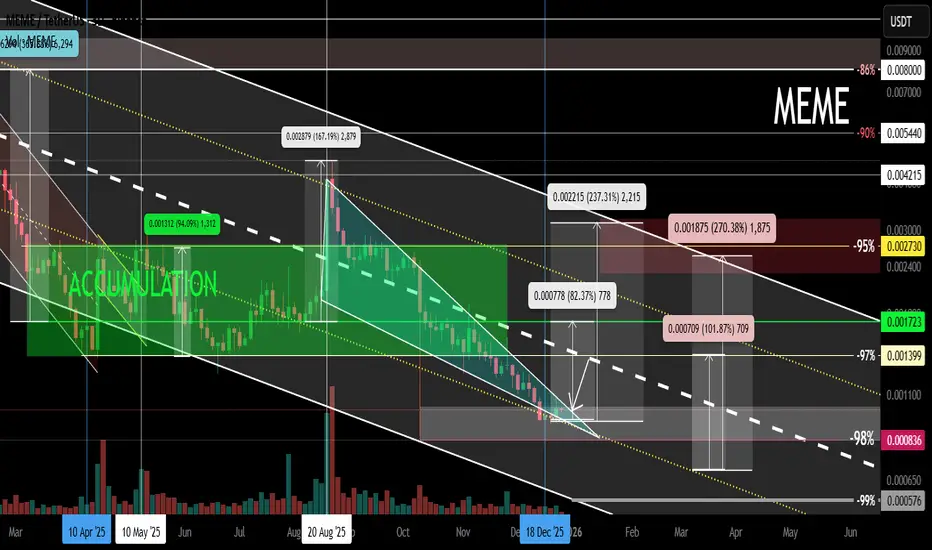
MEME Local Trend. Wedge. Reversal Zone. December 27, 2025Logarithm. 3-day timeframe.
The main trend is shown for clarity (dynamic support zone of the internal descending channel).
-98% decline from the high
The price is near the long squeeze zone, 10 10 2025. A descending wedge has formed, and the price is being squeezed. This is the local trend reversal zone if its resistance is broken, which can occur through sideways consolidation, i.e., a double bottom or dragon...
Alibaba (BABA) - Structure Reload Before the Next Expansion?📈After a powerful impulsive leg higher, BABA is now doing exactly what strong trends are supposed to do: correct, not reverse. Price is pulling back into a key structural support, aligning perfectly with the lower bound of the rising blue channel.
⚔️This area is critical. As long as this structure holds, the market remains overall bullish, and pullbacks are viewed as opportunities rather than threats.
The plan is simple and disciplined:
🏹I’ll be looking for trend-following longs around the intersection of structure support and the rising channel, with continuation toward the upper channel and higher levels.
Only a clean breakdown below structure would invalidate this bullish scenario. Until then, the trend remains intact and patience is rewarded.
Is this consolidation the calm before the next expansion leg? 🤔📊
⚠️ Disclaimer: This is not financial advice. Always do your own research and manage risk properly.
📚 Stick to your trading plan regarding entries, risk, and management.
Good luck! 🍀
All Strategies Are Good; If Managed Properly!
~Richard Nasr

XMR keeps failing at 450 resistance, is a major breakdown comingYello Paradisers— how many times can XMRUSDT hit the same wall before it collapses for good? The rejection from the 448 to 450 zone is starting to look like more than just noise.
💎XMRUSDT respected an ascending channel for a while but that structure has now clearly broken. The recent breakdown along with an internal CHoCH signals a shift in short-term momentum. The impulsive rejection has cooled off the buyers and the current consolidation just below the broken channel shows that sellers are gaining control while buyers struggle to hold ground.
💎After the breakdown, price made a corrective attempt but was quickly rejected again around the 0.5 to 0.618 Fibonacci retracement area. This zone has now become a supply region and continues to suppress any bullish attempts. As long as price stays under that structure with no strong bullish displacement the bias remains bearish with a likely push toward lower liquidity zones and key support levels.
💎This view changes only if price closes a strong candle above the 450 resistance. That would reclaim the previous range high, cancel the bearish structure shift and signal renewed bullish strength with potential to target higher liquidity above the current range.
🎖Right now is not the time for emotional moves. Stay calm and stay focused. We are only interested in the cleanest and most high probability setups. That is how you win in this game long-term.
MyCryptoParadise
iFeel the success🌴

Silver XAG to $47 soonBreaking Out - silver is second most used commodity after oil and reserves are running low. It’s not difficult to work out that soon large companies, like apple , Samsung, Microsoft etc will be HODL silver like a baby on breast milk. Not to mention when the vampires come out to bite you will need your silver bullets so don’t sell your silver .
