Swing Trade Idea ENS/USDT – Long Setup (8H timeframe)Entry Range: $23.30-23.50
Take Profit 1: $23.99
Take Profit 2: $24.59
Take Profit 3: $25.18
Stop Loss: $22.51
Leverage: 10-15x
Please trade with care and use proper position sizing and risk management always ✅
Wedge

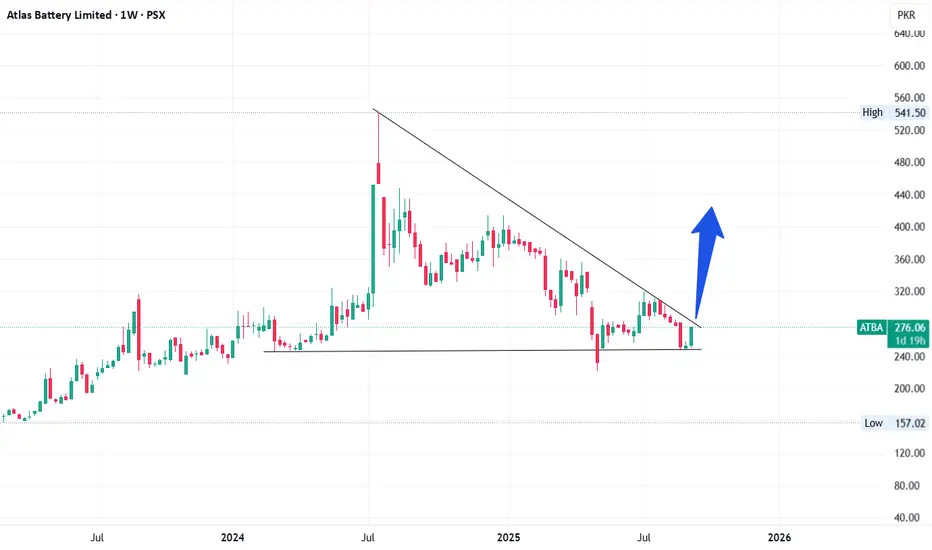
ATBA Taking Trendline ResistanceATBA is currently taking trendline resistance as shown in chart. Once broken (weekly closing above 287), it will bounce back to its recent high (~450).
On weekly timeframe, a falling wedge pattern can be observed which is a bullish pattern.
Bad result in recent quarter may cause this trendline resistance to be a tough task to break. However, on a bigger (monthly) timeframe, a beautiful inverse head and shoulder is forming that may take its effect in coming months.
This is not a buy / sell call, be cautious while investing in fundamentally weak stocks.
Keep your stoploss at 221 (Recent low on May 7th).
BTCUSD: Fake Breakout and Drop to Support LineHello everyone, here is my breakdown of the current Bitcoin setup.
Market Analysis
From a broader perspective, the price of Bitcoin has transitioned from a downward channel into a large rising wedge pattern. This structure has defined the price action for several weeks, creating a volatile environment with clear boundaries at the support zone near the 109000 level and the resistance zone up to the 113000 area.
Currently, we are at a very interesting and critical point. The price has once again rallied to the top of the Wedge and is testing the major horizontal resistance at the 112500 level. This is the third significant test of this ceiling in recent history.
My Scenario & Strategy
My scenario is built on a repeating pattern of behavior I've observed at this resistance. On the two previous tests of this 112500 area, the price created a 'fake breakout', briefly pushing above the level only to be aggressively sold off. This repeated failure is a strong clue that sellers are dominant here.
My expectation is that history will repeat itself. I'm looking for the price to make one more 'fake breakout' push into the 112500 - 113000 resistance zone. A swift reversal and a fall back below the 112500 level would be the key signal that sellers have once again taken control. The primary target for this move is 110700, which aligns with the ascending wedge support line.
That's the setup I'm tracking. Thank you for your attention, and always manage your risk.

TIA - Bullish wave awaited! LSE:TIA - bullish breakout awaited💣
Trend remain hihly oversell on the monthly basis
I expect to see a bull run toward 2.20 - 2.300$ key resistance next! 📈
Key support to be maintained: 1.675$

$NXXT long? Large move incoming?NASDAQ:NXXT has been in a falling wedge and it looks to be set to break out in the near future.
Should it break above $2.30 or so, I can see the start of a large move up to the $7 resistance, or potentially higher.
Let's see how it plays out over the coming weeks/ months.


COW - TP2 HITTSX:COW - TP2 ✅
Clean falling wedge H4 breakout & retest ✅📈
We could see a big bull impulse similar as 🚀

Babydoge - bullish Following my previous outlook at perfection! 📈
Excpeting a +10/15% move again on #babydoge

ENAUSDT → Attempting a trend change. Focus on 0.700BINANCE:ENAUSDT is forming an attempt to change the trend. The price breaks the descending resistance and forms a new trading range. The focus on the 0.7 support and the bulls' reaction...
Bitcoin looks quite positive after breaking the downside resistance, but there is a strong 112K zone ahead and news on Thursday / Friday. If the general backdrop maintains its bullishness, BTC's rise will support strong altcoins and the market could turn green, including the coin discussed in this publication...
ENAUSDT breaks through the downtrend resistance. Price is consolidating above the boundary and forming a trading range. The focus is on the 0.7 - 0.683 area. If the bulls keep the price above this area, it will confirm the fact of trend change, which could trigger a rally to 0.7745 - 0.853
Support levels: 0.7, 0.683, 0.668
Resistance levels: 0.736, 0.7745
Technically, there is a possible struggle between market participants for the area 0.7 - 0.668. In this case, I will not consider the return to the channel as a false breakout of the trend, as a strong upward impulse was formed earlier, which generally broke the local market structure. However, based on the technical situation, I will consider entering the position after clear signs of price holding above the key support zone.
Regards R. Linda!

XAUUSD 15M – Bullish Structure | BULLS STEPING INFOREXCOM:XAUUSD
Structure | Trend | Key Reaction Zones
Price is moving inside an ascending channel, showing higher lows (HL) and bullish structure. Demand zone around 3643 – 3645 has been retested successfully, keeping buyers active.
Market Overview
Gold is maintaining bullish momentum with strong buyer interest from the lower trendline. As long as 3628 holds as invalidation, we can expect continuation to the upside. A breakout above 3659 resistance will confirm further momentum.
Key Scenarios
✅ Bullish Case 🚀 →
🎯 Target 1: 3652
🎯 Target 2: 3659
🎯 Target 3: 3665
❌ Bearish Case 📉 (if 3628 breaks) →
🎯 Downside Target: 3613
🎯 Extended Target: 3606
Current Levels to Watch
Resistance 🔴: 3659
Support 🟢: 3643 – 3645
⚠️ Stoploss: 3628 (below invalidation zone)
⚠️ Disclaimer: This analysis is for educational purposes only. Not financial advice.

Long bond bulls’ eye bigger breakoutThe bullish move in U.S. ultra-long bond futures anticipated last week has played out nicely, with the contract surging higher over the subsequent days, taking out a key topside hurdle comprising the 200DMA and horizontal resistance at 119’19. The move has now stalled at a downtrend from the highs set in September last year, a period when the Fed went full-bore dove on concerns the U.S. was potentially slipping into recession. Sound familiar?
Zooming out, the contract is coiling within a falling wedge, a continuation pattern that points to the potential for a far larger extension of the bullish move should the price break and hold above the September 2024 downtrend. The signal from the breakout may not be as reliable as others given long bond futures have been anything but bullish in recent years, but convention suggests we could eventually revisit the September 2024 highs, implying a 30-year yield of less than 4%.
122’18 and 124’24 are minor levels to monitor on the topside before more significant tests await at 129’00, 132’00, 135’13 and the September 2024 swing high. RSI (14) and MACD point to building bullish momentum, favouring a similar directional bias that should improve the odds of the breakout sticking, should it occur.
Good luck!
DS

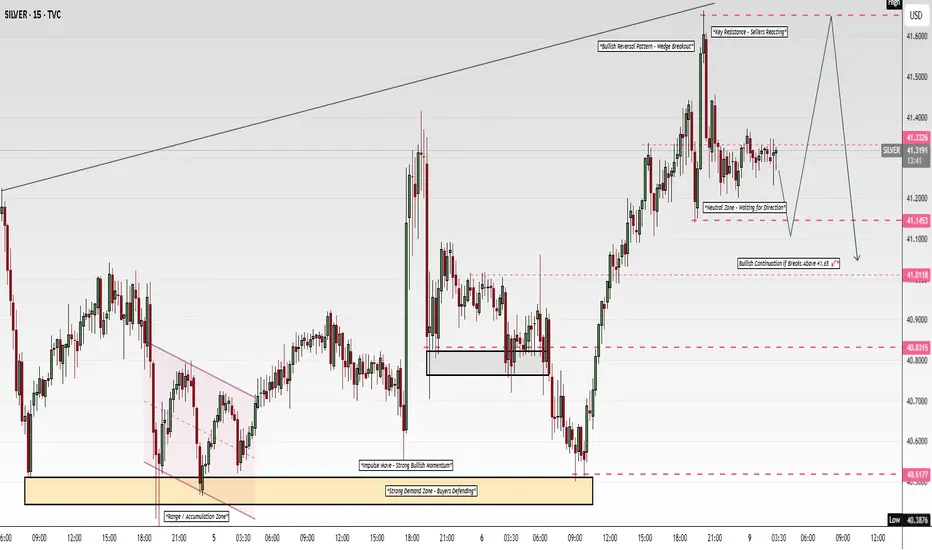
SILVER 15m – Key Resistance Test | PULLBACK/CORRECTION PENDINGFOREXCOM:XAGUSD
📊 SILVER 15m – Key Resistance Test ⚡
Structure | Trend | Key Reaction Zones
Silver rejected at 41.65 (key resistance). Buyers are active from 41.00–41.15, but a breakout above 41.65 is needed for further continuation.
Market Overview
The market is consolidating near resistance. A push above 41.65 could extend gains, but failure will drag price back to demand zones near 41.00 and below.
Key Scenarios
✅ Bullish Case 🚀
Target 1: 41.45
Target 2: 41.65
Target 3: 41.90 – 42.00
Stop Loss: Below 41.00
❌ Bearish Case 📉
Target 1: 41.15
Target 2: 41.00
Target 3: 40.52
Stop Loss: Above 41.65
Current Levels to Watch
Resistance 🔴: 41.65
Support 🟢: 41.15 – 41.00
⚠️ Disclaimer: This analysis is for educational purposes only. Not financial advice.
ETHUSD 1H – Critical Breakout Zone Ahead | BUY LIMIT SELL ACTIVEBITSTAMP:ETHUSD
Structure | Trend | Key Reaction Zones
Ethereum is stuck between resistance at 4,324–4,362 and strong support at 4,215. Price is consolidating, and a breakout will define the next big move.
Market Overview
Buyers are defending the 4,215–4,230 demand zone. A push above 4,362 will confirm bullish continuation toward 4,400+, but rejection could drag ETH back toward 4,215.
Key Scenarios
✅ Bullish Case 🚀
Target 1: 4,324
Target 2: 4,362
Target 3: 4,400 – 4,437
Stop Loss: Below 4,282
Current Levels to Watch
Resistance 🔴: 4,324 – 4,362
Support 🟢: 4,230 – 4,215
⚠️ Disclaimer: This analysis is for educational purposes only. Not financial advice.

XAUUSD 30m – Continuation Outlook | BULLISH TREND | BUYERS ONLYFOREXCOM:XAUUSD
Structure | Trend | Key Reaction Zones
Gold remains bullish with higher highs (HH) and higher lows (HL). Price is consolidating near 3630–3640, creating a decision zone for the next move.
Market Overview
Buyers are still in control after the breakout, but price is facing strong resistance at 3646. A breakout continuation could fuel upside momentum, while rejection risks a pullback.
Key Scenarios
✅ Bullish Case 🚀
Target 1: 3660
Target 2: 3685
Target 3: 3720
Stop Loss: Below 3612
❌ Bearish Case 📉
Target 1: 3612
Target 2: 3592
Target 3: 3577
Stop Loss: Above 3646
Current Levels to Watch
Resistance 🔴: 3646 – 3660 zone
Support 🟢: 3612 – 3592 zone
⚠️ Disclaimer: This analysis is for educational purposes only. Not financial advice.

$ADA - bullish area above 0.800$ support. CRYPTOCAP:ADA - bullish area above 0.800$ support.
Back to 1.00$ soon? 📈

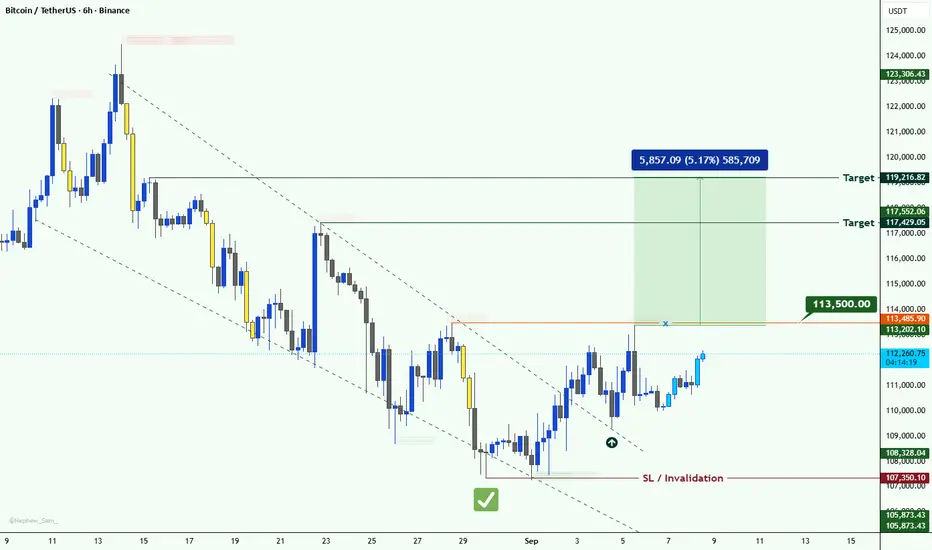
BTC Falling Wedge Breakout – Key Confirmation at 113.5K📊 #BTCUSDT Update
— #BTC cleared the liquidity around 107K and bounced back. ✅
— Currently, the price has formed a Falling Wedge and already broken it. Still, we need extra confirmation.
— If BTC breaks 113.5K with a strong bullish candle, we can expect higher levels as the next targets. 📈
BREAKING: Grayscale just filed for Chainlink $LINK ETF🚨BREAKING: Grayscale just filed for Chainlink CRYPTOCAP:LINK ETF with the SEC.
🟩20% + correction from previous monthly level Given
🟩Clean falling wedge & continuation pattern 📈
🟩Weekly ichimoku flipped bullish
🟩Long term uptrend keep supporting prices
🚀Next step: 30$+
Key support to be maintained for bull scenario:
20.00 - 19.50$

FETUSDT: Ascending Wedge Bottom_Ready to take another FlightFETUSDT
Monthly
Continuously moving within an Ascending Wedge.
On a monthly time frame, it is continuously forming HH, HL
Historically, 12 bars (approx. 1 year) correction is observed.
However, it takes a good flight after such correction.
Price is squeezing (and hence profit/loss too) respecting ascending wedge.
Good news! the correction bars have been completed, touching the bottom of ascending wedge.
Flight is ready to take an upside move.
Daily
Flag pattern,
current price range is forming a support zone.
Fundamentally, it has all the spices to justify the above analysis.
Enjoy the ride!

Key Levels to Watch for USDJPY Ahead of Payrolls DataUSDJPY is contracting in the medium term, while in the shorter term there is a slightly bullish trend channel.
Although there is no clear direction, this tight range offers many trading opportunities. For today, the 147.90–148.00 zone could act as immediate support. After the payrolls data, if USDJPY holds above this support, it may be bullish in the short term. If the level breaks, it could trigger a selloff. The lower and upper lines of the trend channel stand at 146.80 and 149.20, which should be monitored closely if the pair moves sharply after the data.
Traders should also keep in mind that Japan’s ruling party will hold an election on Monday, so the final hours of the week could bring spiky candles.

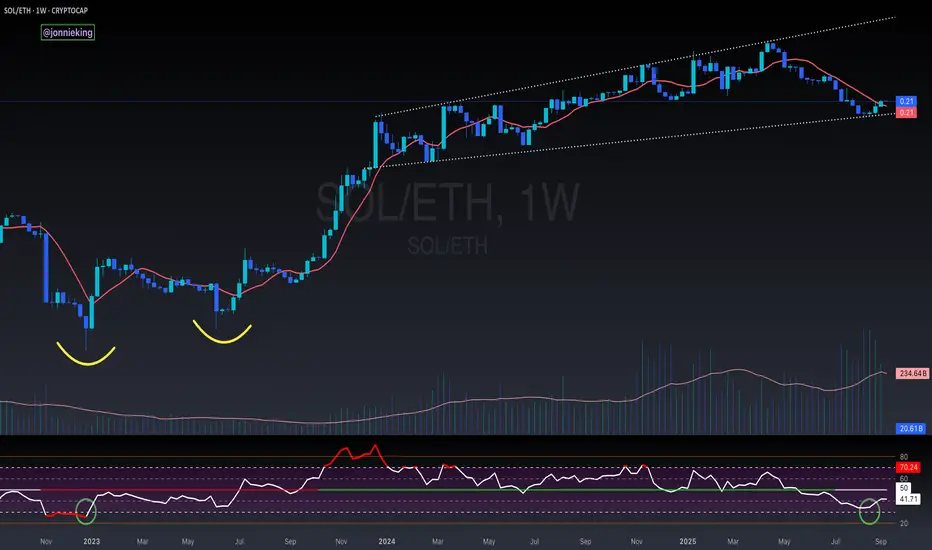
$SOL / $ETH REVERSAL * ALT SEASON *🚨 The CRYPTOCAP:SOL / CRYPTOCAP:ETH REVERSAL has officially been confirmed.
✅ 3 White Solders
✅ Weekly close above 9WMA
✅ Broadening Wedge
Money is moving down risk, which brings outsized returns.
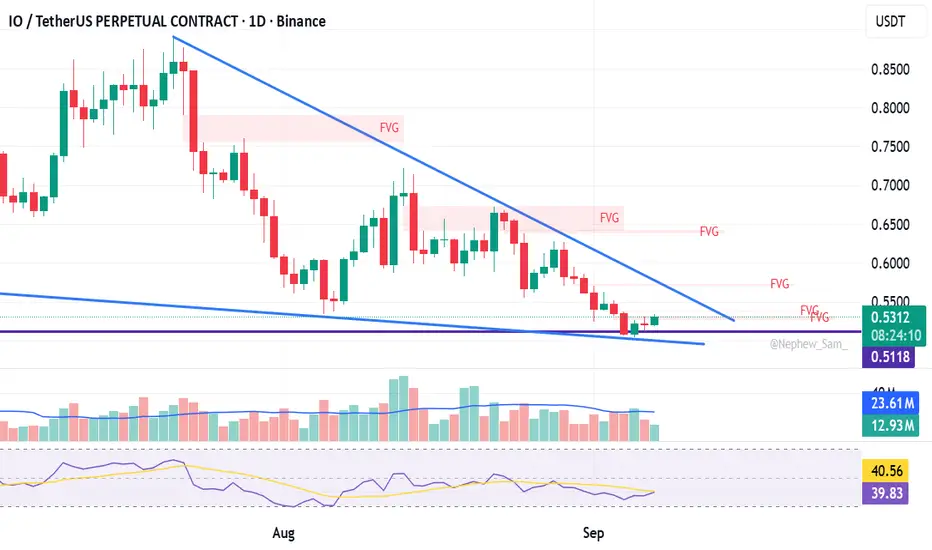
iousdt done liquidity sweep and falling wedge patternthis counter looks good.
done liquidity sweep for 150 days
and potential falling wedge pattern.
watch closely for breakout or breakdown.
Trading GOLD At All-Time Highs - 2 Methods for Profit TakingGold has broken out to all-time highs, leaving traders asking: “Where should I take profits when there’s no structure to target?”
In this video, I’ll walk you through two proven methods for setting profit targets when trading in uncharted territory:
🔹 Price Action & Technical Tools – measured moves, AB=CD patterns, Fibonacci extensions (127 & 1618), and wedge breakout projections.
🔹 Indicator-Based Exits – using RSI, stochastics, and volatility bands (Keltner Channels / Bollinger Bands) to identify exhaustion and exit signals.
You’ll learn:
✅ How to set profit targets without previous structure
✅ Why thinking like the “other trader” gives you an edge
✅ Why catching part of the move beats chasing the very top
If you have any questions or comments, please leave them below.
Akil
