Sand and its recent pumpHey, we are going to talk about a pattern today, called falling wedge, as it happened few days ago in SAND I'm just gonna talk about it as a good example.
Basically a wedge is a shape looking like triangle, it causes to make lower highs and higher lows which are closer to each other as we go along. we have 4 types of wedges listed below :
1. Falling wedge ( in uptrend or downtrend )
2. Rising wedge ( in uptrend or downtrend )
well I'm not gonna tell you how to trade it as its explained in books or some youtube channels; what you'd normally find out there is that when you see Falling wedge in uptrend we are probably going to see another leg up ( what happened in SAND ) and rising wedge in an uptrend would probably cause trend reversal, but lets just say this is not true and market doesn't care about what we all think :D
what I'd suggest is to treat all these shapes as kind of channels, You can buy low sell high and when the break happens get in and ride with it ( DO NOT FOMO ).
But lets talk what is actually happening behind these formations, lets talk price action a bit; a wedge usually happens after a trend, we usually find it after a leg up or leg down, and basically that means market is probably going to play around the highs or lows it made for a while before making a second large move ( Correctional or not ), so it will start forming these shapes.
normally when we see the price making lower highs in an uptrend ( or higher highs in a down trend ) we'd suspect a trend reversal, but in this case , the highs are really close and we are also making higher lows, this tells us, market is not going anywhere yet, because there is a fight going on between bulls and bears. eventually one of these sides will give up, and the support or resistance will break, That's the moment for us to get in and ride along the market.
This is basically all you need to know about wedges. pretty simple but useful. check the price action on Sand as an example and let me know if there are any questions.
Wedge

Elliott Wave BTC Future Targets.Long long term just wanted to make it once and follow or update would love to find out how it turns out not a trading advice do your own ta thanks. It's a leading diagonal and no sir no moon sorry till we see a deep deep correction after 75k max.

PRICE ACTION TRADING | RISING WEDGE PATTERN 🔰
Hey traders,
Rising wedge pattern is one of the most accurate price action patterns.
Being relatively simple to recognize, it is applied in various trading strategies.
⭐️The pattern itself signifies the exhaustion of bulls.
Even though the asset keeps growing in value, the price action legs contract forming a narrowing channel.
Being stuck between two contracting trend lines, one serving as support and one serving as resistance, the price forms a wedge pattern.
🔔The trigger that we are looking for to sell the market is a bearish breakout of the support of the wedge (candle close below).
To not be caught by a false breakout, it is highly recommendable to wait for a bearish violation of the last higher low level as well.
Only then the wedge breakout is confirmed.
⚡️Trading the market aggressively, one opens a short position on spot just after the candle closes.
⚡️The conservative trader will wait for a retest of the broken support of the wedge though for a safer entry.
✔️Safest stop will lie strictly above the highest wick within the wedge.
✔️Initial target will be based on the closest key structure support.
Learn to recognize this pattern and be disciplined to wait for its confirmed breakout. Only then a high trading performance will be achieved.
What price action pattern do you want to learn in the next post?
❤️Please, support this idea with like and comment!❤️

Patterns of possible market correction or reversal 📊
Trend reversal or correction chart patterns signify a reversal of the current trend on the observed chart. In a bullish trend, a reversal formation indicates a highly probable reversal and initiation of a bearish movement.
In a bearish trend, a reversal patterns leaves bullish clues and indicates a highly probable bullish accumulation.
No matter bullish or bullish reversal pattern is spotted,
The trigger that we are looking for is a breakout of the pattern’s support/resistance.
❤️ Please, support our work with like & comment! ❤️

Narrowing Wedges - Advanced AnalysisIn the last post in this series on chart patterns, we described the characteristics, rules, and causes of broadening wedges patterns (if you haven't seen it, see the related ideas below).
In this post, we shall perform an advanced analysis of a related pattern, narrowing wedges. We provide a description of each pattern and its implications.
That's the way it ends. The thin edge of the wedge.
- Bulkowski (1)
1. Narrowing Wedges
Narrowing Wedge patterns are reversal patterns that are characterized by price variations laying within one support and resistance and both having the same direction and narrowing over time. In a narrowing wedge, the apex is located at the end of the formation.
1.1 Rising Wedge
Rising wedges mostly occur during uptrends, with raising local maxima (higher highs) forming an upward sloping resistance and raising local minimas (higher lows) forming an upward slopping support. The slope of both the support and resistance should be significantly different from 0.
Bulkowski suggests the price should test the support and resistance 5 times.
Volume tends to decrease during the formation of such patterns.
Ascending wedges are bearish-biased, with breakouts mostly occurring downward. Downward breakouts are often followed by a decrease in price.
Example of rising wedge on Visa daily followed by a downward breakout.
1.2 Falling Wedges
Falling wedges mostly occur during downtrends, with declining local maxima (lower highs) forming a downward sloping resistance and declining local minima (lower lows) forming a downward slopping support. The slope of both the support and resistance should be significantly different from 0.
Like with rising wedges, Bulkowski suggests the price should test the support and resistance 5 times.
Volume tends to decrease during the formation of such pattern.
Descending wedges are bullish biased with breakouts mostly occurring upward. Upward breakouts are often followed by an increase in price.
Example of falling wedge on Trivago daily.
2. Measure Rule
The measure rule allows for the determination of where to set a take-profit/stop-loss after a breakout in a narrowing wedge formation. Rules differ from an upward to downward breakout of the formation.
When price breaks the support of a rising wedge, the take-profit is determined from the lowest low inside the formation. When the price breaks the resistance, the take-profit is determined by adding the height of the formation to the breakout point.
When price breaks the resistance of a falling wedge, the take-profit is determined from the highest high inside the formation. When the price breaks the support, the take-profit is determined by subtracting the height of the formation from the breakout point.
3. Some Observations
Technical analysts believe that narrowing wedges indicate a sentiment switch. The impulses within the formation have a decreasing amplitude over time, indicating a potential change in trend. The amplitude of the impulses decrease linearly over time.
The underlying trend in narrowing wedges formation is linear. Detrended prices within a narrowing wedge would highlight a damping effect.
Rising Wedges have been studied with climate time-series data (2)
References
(1) Bulkowski, T. N. (2021). Encyclopedia of chart patterns. John Wiley & Sons.
(2) Kaiser, J. (2017). Technical analysis of climate time series data.

price action patterns you need to know ( part 4 ) hi my friends , i'll share with you some patterns which can help you in trading ( part 4 )
Falling Wedge appear in downtrend and it indicates that the sellers are losing momentum in the market, and the buyers are gaining momentum ( long ) you can go long after the break or the retest of the trendline .
rising Wedge appear in uptrend and it indicates that the buyers are losing momentum in the market, and the sellers are gaining momentum ( short ) you can go short after the break or the retest of the trendline
note : Usually we find there is a divergence in the RSI indicator and this can be used as confirmation .
please support me with like and follow me for more ideas .

What are Falling and Rising Wedge Patterns?What Is the Wedge Pattern and Its Common Characteristics?
1. Wedge patterns have converging trend lines that come to an apex with a distinguishable upside or downside slant.
a. Wedge with an upside slant is called a rising wedge
b. Wedge with downside slant is called falling wedge
2. It has declining volumes as the pattern progresses.
3. It breaks out from one of the trend lines.
Why We Should Pay Attention to Wedge Patterns?
Some studies suggest that a wedge pattern will breakout towards a reversal rather than a continuation more often than two-thirds of the time. Therefore as the rule of thumb, people generally treat a falling wedge as a bullish pattern and a rising wedge as a bearish pattern, especially a falling wedge would be a more reliable reversal indicator than a rising wedge.
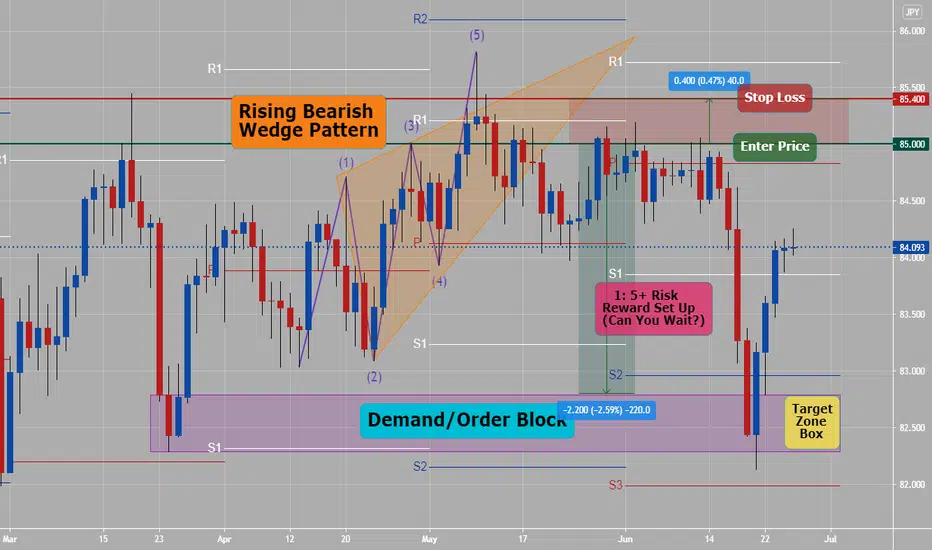
Since we know a wedge pattern has a higher probability to reverse and due to the fact that the price of wedge pattern converges to a smaller area, we can trade the reversal set up with a relatively close stop loss to its entry price, which provides us with a good trading opportunity with a decent Risk:Reward ratio.
Examples of a Bullish Rising Wedge and Bearish Falling Wedge.
Sadly, there is nothing that works 100% in trading. Not every rising or falling wedge will reverse as one might expect. Every trader must properly manage their risk by setting stop losses and not just trading based on price patterns. Below are two examples.
Bullish Rising Wedge (ETHUSDT during 15/NOV/20 - 28/DEC/20)
In the early stages of the epic 20-21 bull market, if traders blindly treat the rising wedge as a bearish signal and trade accordingly, they would pay a heavy price.
Bearish Falling Wedge (LTCUSD during 14/AUG/18 - 14/NOV/18)
On the contrary, in the late stage of the 2018 bear market, any trader who blindly trades the falling wedge to bet on a reversal would also learn a hard lesson.
Comment down your thoughts on Ascending Triangle Pattern in the comment section.
Disclaimer:
This is just an educational post. Never trade just any pattern. And please do your research before making any trades.
Happy Trading!

Broadening Wedges - Advanced AnalysisIn our previous post in this series about chart patterns we described the characteristics, rules, and causes of triangle patterns (if you haven't seen it, see the related idea below).
In this post, we perform an advanced analysis of broadening wedges patterns. We provide a description of each pattern and its implications. We also review the literature in order to find their deterministic cause.
1. Broadening Wedges
Broadening wedges are characterized by price variations laying within one support and resistance, both having the same direction and broadening over time. As such the apex of the support/resistance in a broadening wedge is located to the left.
Broadening wedges must not be confused with other broadening formations. While they all have a broadening characteristic they can have different identification rules
Broadening wedges are classified depending on the direction of the support/resistance.
1.1 Ascending
Ascending broadening wedges mostly occur during uptrends with rising local maxima (higher highs) forming an upward sloping resistance and raising local minimas (higher lows) forming an upward slopping support. The slope of both the support & the resistance should be significantly different from 0.
Bulkowski suggests the price needs to test the support and resistance three times each. Additionally, the resistance should be steeper than the support.
Volume tends to increase during the formation of such pattern.
Ascending broadening wedges have a bearish bias with breakouts mostly occurring downward. Downward breakouts are often followed by a decrease in price.
Example of an ascending broadening wedge followed by a downward breakout on SOLUSDT 4h.
1.2 Descending
Descending broadening wedges mostly occur during downtrends with declining local maxima (lower highs) forming a downward sloping resistance and declining local minimas (lower lows) forming a downward slopping support. The slope of both the support & the resistance should be significantly different from 0.
Similarly to ascending broadening wedges, Bulkowski suggests the price needs to test the support and resistance three times each. Additionally, the support should be steeper than the resistance.
Volume tends to increase during the formation of such pattern.
Descending broadening wedges have a bullish bias with breakouts mostly occurring upward. Upward breakouts are often followed by an increase in price.
Example of an ascending broadening wedge followed by a downward breakout on AVAX 1h.
2. Partial Rises/Declines
Partial rises/declines are phenomena described by Bulkowski in broadening formations and are described as being common. Partial rises/declines often indicate the direction of a breakout.
Partial rises commonly occur in broadening ascending wedges, price bounces off the support, moves towards the resistance without reaching it, and go back to the support. We can expect a potential downward breakout after that. Note that a partial rise always starts from the test of the support.
Partial declines commonly occur in broadening descending wedges. The price bounces off the resistance, moves towards the support without reaching it, and then goes back to the resistance where we can expect a potential breakout upwards. Note that a partial decline always starts from the test of the resistance.
Partial rises and declines can offer a better price to buy/sell instead of waiting for a breakout.
3. Measure Rule
The measure rule for broadening wedges allows us to determine the position of a take-profit/stop-loss.
For a broadening ascending wedge the measure rule would place our take profit at the lowest low inside the formation. Selling directly after a partial rise would allow for higher profits.
For a broadening descending wedge the measure rule would place our take profit at the highest high inside the formation. Selling directly after a partial decline would allow for higher profits.
Certain analysts close trades caused by partial rises/declines when the price reaches the support/resistance of the wedge, opening a new position in the case of a breakout while using the metric rule for setting their take profit.
4. Causes Of Broadening Wedges
Bulkowski offers a description of the causes of broadening wedges in the market in terms of the market participant's behavior.
The cause of an ascending broadening wedge is a surge from an initial buying impulse, driving the price higher. Momentum traders follow the initial impulse further pushing prices up.
Contrarian traders judge the price to be trading above its intrinsic value, selling and thus creating a decline in prices. However, before the decline reaches the previously established low, certain market participants buy again. These participants can be composed of initial buyers, accumulating positions, or late traders seeing the potential to buy at a better price. This allows the creation of a new impulse, with only a divergence left.
This scenario eventually repeats itself with increased volume, causing impulses and retracements of higher magnitude reinforcing a positive feedback loop until the price is judged overbought even by initial buyers.
A broadening falling wedge follows the same scenario structure but with sellers instead of buyers.
5. Other Observations
The amplitude of the cyclical variations within a broadening wedge increases over time, thus potentially highlighting volatility clusters in higher time-frames.
Another interesting observation that can be made is that prices within a broadening wedge are subject to heteroscedasticity (variability is not constant, it increases inside a broadening wedge), while prices inside a channel are homoscedastic (variability remains constant). This concept is inherent to regression analysis.
6. Conclusion
In this post we described broadening wedge patterns in depth. We have highlighted partial rises/declines as well as how the measure rule applies to such patterns. We then focused on showing how market participants act during the formation of broadening wedges.
Note that unlike triangles patterns we did not find a significant amount of studies mentioning such patterns, nor any agent models developed to describe their occurrence.
7. References
(1) Bulkowski, T. N. (2021). Encyclopedia of chart patterns. John Wiley & Sons.

Compression Supply and Demand ¦ Key Patterns!Compression is the term every trader should understand. Reading the price is most important in the technical analysis of forex trading. Like if the price is changing at a fast rate then you must know the reason behind it. If you are a technical analyst you should use only technical tools. Like why the price is forming big bullish candlesticks at a certain zone or why the price is forming small candlesticks at a certain zone? You must know the reason behind it.
What’s Compression in forex?
There are only two reasons for the movement of price. One is demand and another one is supply. The price will go up when there is demand. The price will go down when there is supply. What will happen when there’s no demand left but only supply? What will happen when there’s no supply left but only demand? Bullish movement
Compression pattern forex
When the price is moving slowly up as well as consuming all the demand on the way then there will be no demand left until the origin of this pattern. As there is no demand so large amount of supply will cause the price to come straight to the origin of this pattern without any hindrance. This pattern is the main reason behind a large bearish candle or big price movement in a very short interval of time. This is called compression in the forex.
How to trade compression in forex?
This topic will be different for different traders. As every trader has its own strategy to trade forex. Only the top 1% are winners because they are unique from others. So don’t copy strategies but try to make your own strategy. You can use a compression pattern in your existing strategy to increase the risk-reward ratio or winning rate or increase your take program level or modify the stop loss level. It depends on you only. For your help, I have mapped you a simple trend line breakout strategy with a compression pattern above.

Open Tutorial ⚪ How To Never Lose Money? "Losing is the part of the game."
- said the loser and kept losing.
Are you a loser?
Or do you open your mind?
Losers lose because they BELIEVE in their loss.
They refuse to comprehend reality.
In reality, you can't learn from failures.
A loss is a loss.
Nothing more.
In truth, you can learn only from successes.
But what if you only lost so far?
Good news:
It doesn't have to be your success.
You can learn from the success of others.
Let's specify an ideal strategy.
The ideal strategy is never wrong.
You don't have to know this strategy.
It suffices if it exists.
Somewhere.
To someone.
We experimented with pattern matching + AI a lot.
Our theory:
Wedges can approximate any strategy.
You can draw wedges.
You don't have to know an ideal strategy.
Yet you can approximate it with wedges.
Is it possible to learn this power?
Not from a Jedi.
What we know:
It works on all major cryptocurrencies with USDT.
+100% profit on BTC/USDT:
It works on altcoins.
+200% profit on XEM/USDT (x10):
It works on cryptocurrency-cryptocurrency pairs.
+300% profit on TVKBTC (x10):
Thus, +100% success rate.
More than +700% profit.
All within a week.
"One stoke, two halves."
- said the winner and kept winning.

Where do you place your stop-loss? 🌐Where do you place your stop loss? 🌐
First, read our tutorial about market orders and limit orders:
Your stop-loss is such a limit order that you place above the point of collision of the trend lines that print the technical pattern on your chart:
- If you've got a Bullish Pattern (Bullish Wedge or Bullish Pennant), you place it below the pattern.
- If you've got a Bearish Pattern (Bearish Wedge or Bearish Pennant), you place it above the pattern.
In channels (Bullish Flag or Bearish Flag), you do not place the stop loss outside the pattern because you put it inside your channel around the point where the price last touched the left trendline.
Where would you place your stop loss in the pattern above?
(The solution's in a comment.)
Regards,
OXY

What is Symmetrical Triangle Pattern?What is a Symmetrical Triangle Pattern?
The Symmetrical Triangle is usually a continuation pattern. It represents a pause in the existing uptrend after which the original uptrend gets resumes. A breakout from the upper trend line marks the continuation of an uptrend while a breakdown from the lower trend line marks the start of a new bearish trend. This pattern is also known as a wedge chart pattern.
How does Symmetrical Triangle Pattern Work?
Phase 1: Existing Uptrend
When there is an extreme demand in prices there is an uptrend. It continued as the demand increases.
Phase 2: Pause
When demand is equal to supply the there is a pause in an uptrend and investors start to book profits here. As prices consolidate it forms converging trend lines. As there is equal demand and supply investors buy on the lower trend line and sell on the upper trend line. Which results in forming a Symmetrical Triangle Pattern.
Phase 3: Uptrend Continuation
After demand matching the supplies when there is when buyers are again interested to buy demand increases. Which results in breakout! And the continuation of the uptrend.
Role of Volume:
Volume plays a major role in a symmetrical triangle pattern. When in an uptrend the volume is quite higher. In the second phase, the volume starts to diminish due to equal demand and supply. And again on the breakout, the volume surges. Volume with Breakout gives a good indication of a successful uptrend.
Above Chart Explanation:
This is a 4H chart of AXSUSDT we can see it's in an uptrend previously with good volumes. Now after successful uptrend prices consolidate with diminishing volumes. And after it, there is a breakout with above-average volumes. And then the uptrend continues.
Conclusion:
Symmetrical Triangle Pattern is a continuation pattern. Which on upper trend line breakout can give a potential bull move and when on lower trend line breakout gives a possible bear move.
Comment your thoughts on Symmetrical Triangle Pattern down below.
Disclaimer:
This is just an educational post never trade just any pattern. And please do your research before making any trades.
Happy Trading!

Closer look into Rising/Falling Wedge, Reversal Price Action
Closer look into Rising/Falling Wedge, Reversal Price Action structures/patterns
Hi traders:
Today I will go more in detail on rising/falling wedge correction in price action structures/patterns.
You might have already heard about these types of correctional structures, and many traders who utilize them.
Certainly there are many ways of traders identifying them and taking advantage of these kinds of price action, so it's ideal for you to understand them in your analysis.
We first need to understand that a rising/falling wedge is a REVERSAL price action. Meaning when the correction completes, there's a higher probability of the price to reverse.
You might have already seen multiple price action videos from me that go over all sorts of continuation and reversal price action (I will share links below),
and I always talk about when combining multiples of different price action structures/patterns will give you a better edge at entering positions that work out in your favor.
Same idea here, so let's take a look at how rising/falling wedges are, how to identify them, and how to effectively use them in your analysis.
Rising/falling wedge, just as the name suggests, is an ascending/descending type of correction where the price is getting squeezed into a “wedge”.
As the price gets narrower and narrower, there's a higher probability of the price to “reverse” from the wedge.
Now about entries, certainly many traders have their own method of entering, so I will share my point of view and the way how I like to enter them.
Any questions, comments or feedback welcome to let me know :)
Thank you
Risk Management: 3 different entries on how to enter the impulsive phrase of price action
Multi-time frame analysis
Identify a correction for the next impulse move in price action analysis
Continuation and Reversal Correction
Continuation Bull/Bear Flag
Parallel Channel (Horizontal, Ascending, Descending)
Reversal Ascending/Descending Channel
Reversal Double Top/Bottom
Reversal Head & Shoulder Pattern
Reversal “M” and “W” style pattern
Reversal Impulse Price Action
Continuation/Reversal Expanding Structure/Pattern

Falling Wedge PatternFalling wedge pattern is a reversal chart pattern that changes bearish trend into bullish trend.

Wedge Pattern TradingRising Wedge Pattern is a trend reversal chart pattern that that indicates gradually decrease in market momentum.
if it is traded with confluence like a supply or resistance level then Winning probability of this setup will increase.

Top 10 Patterns ( Wedge Patterns ) #3Example on daily Aud/Jpy pair of a Wedge Pattern ( can be falling wedges and on any time frames):
Wedge patterns are of two types, falling wedge as well as the rising wedge. While the falling wedge is associated with bullish reversals, the rising wedge is seen as a bearish reversal indicator.
The wedge pattern has over three properties that a trader needs to look for if hunting for it on their charts.
Converging trend lines.
Decline in volume while the price is progressing through the pattern.
A breakout from any of the trend lines.
You can spot the rising wedge, usually when a currency's price has been climbing over a reasonable period. However, they have been known to form during a currency price's downward trend as well.
As for the falling wedge, it has been observed to form correctly when a currency's price has been on a decline for a while. The pattern's hot spot is just when the market trend is in its final plunge.
Of the two, the falling wedge has been noted to be more reliable than the rising wedge in terms of predicting the market's price trend.
EDUCATION - Rising & Falling Wedges - Reversal PatternsWhat is an ascending/descending correction?
The most common reversal pattern is the rising and falling wedge, which typically occurs at the end of a trend. The pattern consists of two trendiness which contract price leading to an apex and then a breakout appears.
Rising Wedge – Bearish Reversal
The ascending reversal pattern is the rising wedge which consists of higher highs and higher lows whilst losing momentum to the upside. Price contracts and eventually has a bearish break.
Falling Wedge – Bullish Reversal
The falling wedge reversal pattern occurs at the end bear run and indicates that price is ready to reverse. Again, price contracts and then eventually breaks out upwards.
There are 2 types of ways we can trade wedge patterns; Risky Entry & Safe Entry. See below for the pros and cons for both and how to enter them
__________________________________________________________________
Risk Entry:
The reason why it is called a risk entry is because we haven't got many confirmations apart from the third touch of the trendline (as indicated in the chart above). Price may have the potential to go past the trendline for a deeper correction before moving up hence why this is called a risk entry. Whereas for the safe entry, the confirmation would be the break of the wedge.
How to trade using Risk Entry:
Wait for price to bounce off the trendline and then enter with stops below/above the correction depending on whether it’s a rising wedge or falling wedge.
One of the advantages of doing a risk entry is that we can have small stop loss and have a great risk:reward ratio. Also, we can gain an entry at the start of the move and have massive gains!
Safe Entry:
Safe entry requires more than one confluence and requires confirmation. One of the confirmations of the safe entry is the third touch bounce and then another confirmation is when price breaks the correction which confirms that the structure has changed and that we are in a reversal.
How to trade using Safe Entry:
For a safe entry, enter when price has broken the correction with stops above/below the correction. Please note that with this entry method, the stoploss will be greater.
The disadvantage to using a safe entry is that we require a bigger stop loss which makes the risk:reward ratio not as great as the risk entry. However, the probability of the trade succeeding is higher.
RISING WEDGE EXAMPLES
RISK ENTRY
SAFE ENTRY
FALLING WEDGE EXAMPLES
RISK ENTRY
SAFE ENTRY

Falling Wedge
Prior Trend: To qualify as a reversal pattern, there must be a prior trend to reverse. Ideally, the falling wedge will form after an extended downtrend and mark the final low. The pattern usually forms over a 3-6 month period and the preceding downtrend should be at least 3 months old.
Upper Resistance Line: It takes at least two reaction highs to form the upper resistance line, ideally three. Each reaction high should be lower than the previous highs.
Lower Support Line: At least two reaction lows are required to form the lower support line. Each reaction low should be lower than the previous lows.
Contraction: The upper resistance line and lower support line converge to form a cone as the pattern matures. The reaction lows still penetrate the previous lows, but this penetration becomes shallower. Shallower lows indicate a decrease in selling pressure and create a lower support line with less negative slope than the upper resistance line.
Resistance Break: Bullish confirmation of the pattern does not come until the resistance line is broken in convincing fashion. It is sometimes prudent to wait for a break above the previous reaction high for further confirmation. Once resistance is broken, there can sometimes be a correction to test the newfound support level.
Volume: While volume is not particularly important on rising wedges, it is an essential ingredient to confirm a falling wedge breakout. Without an expansion of volume, the breakout will lack conviction and be vulnerable to failure.

How to trade with Falling wedge pattern-Live exampleFalling wedge pattern's considered as continuation pattern (Bullish continuation pattern) We can catch this pattern
after some bullish reversal or in a continuous bullish run.Best place to enter bullish was after the break of the upper side trend line
(After converging).The primary target would be the topmost rejection level of the wedge and we can fix our extended target with the help
of Fibonacci.

What is a falling wedge?A falling wedge is a bullish chart pattern (said to be "of reversal"). It is formed by two converging bearish lines.
A falling wedge is confirmed/valid if it has a good oscillation between the two falling straight lines. The upper line is the resistance line; the lower line is the support line.
Each of these lines must have been touched at least twice to validate the pattern.
A break of the resistance line definitively validates the pattern. This break out is generally accompanied by high volumes. The price objective is determined by the highest point that caused the wedge to form.
NB: it is often observed that the steeper the falling wedge’s trend lines, the faster the price objective is reached.
For XRP this is of course a load of crap, but it keeps me from jumping into a pool filled with great whites...

HOW TO TRADE WEDGE PATTERNS IN A RIGHT WAY This is an Educational post regarding ' HOW TO TRADE WEDGE PATTERNS IN RIGHT WAY '
1. There should be a nice uptrend or downtrend before you start marking the pattern
2. join the most touches of body candle or wicks as per your trading style and what works for you
3. If a Fakeout has happened then most the chances of pattern to work increases
4. check the volume of recent price
5. always pay closer attention to price when price is near to the breakout
6. Always look for good body momentum candle breakout with good volume
7. aggressive traders can enter after the breakout
8. I always buy on the retest of the resistance level which became support or vice versa for short trade
9. Use your personal favorite indicator to add confluence to the trade
Do let me know if you learned anything from this post

How to trade wedge patterns? An example based on EURUSD chartWedge Patterns are a type of chart pattern that is formed by converging two trend lines.
Wedge patterns can indicate both continuation of the trend as well as reversal.
Rising Wedge- On the left upper side of the chart, you can see a rising wedge.
Rising wedges usually form during an uptrend and it is denoted by the formation higher highs(HHs) and Higher Lows(HLs).
This pattern gives traders the opportunity to take short positions in the market.
When price breaks out of the lower Trend Line(TL) of the wedge, a trader can execute a short position.
Falling Wedge - On the left lower side of the chart, you can see a falling wedge.
Falling wedges when formed during a downtrend is a reversal pattern and it denoted by the formation of lower lows(LLs)
and lower highs(LHs).
If you notice this pattern during a downtrend, it usually indicates that the downtrend is losing momentum and buyers
are stepping into the market gradually.
When price breaks out of the upper TL, one can execute a buy trade.
On the right side, you can see the recent EUR/USD chart. The wedge pattern in this particular chart is the Broadening Wedge
Traders can trade this pattern by taking short positions whenever bearish price action takes place in the upper TL of the wedge.
On the other hand, buy trades can be executed on the lower trend line of the wedge.
