Bitcoin - Last drop, then a huge pump! (watch this wedge)Bitcoin is currently trading at around 78,000 at the time of writing this article, and I expect the price to go down to 71k - 72k in the short term. Why? As we can see on the chart, there are many reasons why Bitcoin should go down. The first reason is that whales (banks, institutions) still didn't sweep liquidity below the April 2025 swing low. This is a huge point of interest because a lot of retail traders have their stop losses exactly below this swing low. The second reason is that the price should touch the falling wedge's downward-sloping trendline.
I think this is a pretty good opportunity to buy/long Bitcoin at these levels because also the RSI indicator is starting to be oversold. I think we should definitely see a temporary rise to 83k - 84k before eventually going lower. It depends on the falling wedge pattern - will bulls be strong enough to break out of this pattern? We will see, but right now, we want to buy this strong support of 72k!
This is my plan for the next weeks. Right now I expect a drop, but soon we should see a pretty strong rebound. If you watch my previous ideas and you are my follower, you probably know that Bitcoin will go down even lower this year, probably below 60k! So, I am not recommending buying any altcoins whatsoever. We may see some interesting gains in the short term, but in the mid-term altcoins are still bearish. A good opportunity to buy altcoins would be in October 2026, but we still need more data to confirm this bias.
Write a comment with your altcoin + hit the like button, and I will make an analysis for you in response. Trading is not hard if you have a good coach! I am very transparent with my trades. Thank you, and I wish you successful trades!
Wedge

Selena | USDJPY – 4H – Bullish Channel ContinuationFX:USDJPY
After a corrective pullback from the channel mid/high region, price dipped into a strong demand area aligned with channel support and the rising trendline. This zone absorbed selling pressure effectively, leading to a sharp bullish response. As long as price holds above the channel support, the broader bullish momentum remains intact.
Key Scenarios
✅ Bullish Case 🚀 →
Continuation toward the upper channel and previous highs.
🎯 Target 1: 158.80 – 159.50
🎯 Target 2: 160.80 – 162.00
❌ Bearish Case 📉 →
A clean breakdown below channel support would invalidate the bullish structure.
🎯 Downside Target: 149.50 – 147.00
Current Levels to Watch
Resistance 🔴: 159.50 / 160.80
Support 🟢: 152.00 – 150.80 (Demand + Channel Base)
⚠️ Disclaimer: This analysis is for educational purposes only. Not financial advice.

GOLD (XAUUSD): Correction After Selloff
Gold may finally start recovering after a strong bearish rally.
A bullish violation of a resistance line of a falling channel
indicates a local strong buying interest.
Goal - 4926
❤️Please, support my work with like, thank you!❤️

Selena | XAUUSD – 30M – Corrective Channel vs HTF TrendPEPPERSTONE:XAUUSD FOREXCOM:XAUUSD
After sweeping sell-side liquidity near 4,400 demand, price formed a controlled ascending channel. This move appears corrective rather than impulsive. Multiple internal supply blocks are present inside the channel, making this zone critical for either distribution and rejection or continuation toward HTF resistance.
Key Scenarios
✅ Bullish Case 🚀 →
Acceptance above channel resistance and internal supply opens upside continuation.
🎯 Target 1: 5,150
🎯 Target 2: 5,300 – 5,350
🎯 Extended: 5,550 – 5,600 (Major HTF Supply)
❌ Bearish Case 📉 →
Rejection from internal supply + trendline confluence resumes bearish continuation.
Current Levels to Watch
Resistance 🔴: 4,980 – 5,020 / 5,150 / 5,550 – 5,600
Support 🟢: 4,660 / 4,500 / 4,400
⚠️ Disclaimer: For educational purposes only. Not financial advice.

GBPJPY short entry waitingWaiting for GBPJPY risk short entry. If 1h pattern breaks with full candle you enter trade. It's best if higher time frame candles close with full candle. You can still enter with 30min candle but it sometimes reverse.

BLDR - HH-HL Pattern BLDR is moving in a falling vedge
on daily TF, started making HH/ HL
tested breakout of 116.
respected EMA89 previouly, now it is support.
Expecting rebound from here and for a target of 125-130 for now
breakout above 130 will lead towards 150 and 190s.
swing SL would be 100. should not close below 100 on daily TF

JKCEMENT – Coiled inside a big wedgeMarkets rarely explode without building tension — this wedge might be that tension.
JK cement's long-term support zone broadly intact, but short/medium-term trend has seen pressure. Recent weeks show lower highs , forming a downward sloping upper trendline. But there's a wider, long-term rising trendline at the bottom — forming a potential large contracting triangle / wedge-like structure on daily chart (as I marked).
So, we are in a coil / compression phase. Price consolidating inside a wedge/triangle after prior swing down, while long-term support holds. That means either breakout or breakdown — but with risk-reward skewed toward bounce if support and structure hold.
If price breaks above upper trendline with volume, upside could target previous swing highs. But if it breaks below support — risk of deeper correction exists.
Save this chart. Wedges crack. This one might too.
Best regards,
Alpha Trading Station

Selena | XAUUSD – 4H –Bullish Structure with Corrective PullbackFOREXCOM:XAUUSD PEPPERSTONE:XAUUSD
The recent sell-off appears corrective rather than a trend reversal. Price is reacting around a key demand zone within the rising channel, suggesting buyers may step back in if structure support holds. Momentum remains bullish unless price breaks and accepts below channel support.
Key Scenarios
✅ Bullish Case 🚀 →
Sustained support above 5,000 – 4,950 keeps bullish continuation intact.
🎯 Target 1: 5,600
🎯 Target 2: 5,750 – 5,800
❌ Bearish Case 📉 →
A clean breakdown and acceptance below 4,950 could open deeper correction toward 4,540.
Current Levels to Watch
Resistance 🔴: 5,580 – 5,600
Support 🟢: 5,000 – 4,950, then 4,540
⚠️ Disclaimer: This analysis is for educational purposes only. It is not financial advice.

The Anatomy of a Trap: Why Structure Alone Isn’t EnoughMarkets often look their most convincing right before they become the most deceptive. Clean chart patterns, widely recognized levels, and textbook formations can create a powerful sense of certainty — especially when many traders are seeing the same thing at the same time. Yet, certainty in markets is often where risk quietly concentrates.
The current structure on E-mini Dow Jones futures offers a textbook example of this dynamic. A rising wedge on the daily timeframe, a retracement toward a prior all-time high, and growing bearish conviction all appear neatly aligned. On the surface, the setup looks straightforward. Underneath, however, the market structure tells a more nuanced story — one centered on positioning, order flow, and the risk of traders getting trapped.
This article explores why structure alone is rarely enough, and how technically “correct” ideas can fail when they ignore what sits beneath price.
YM and MYM Futures: Setting the Context
The Dow Jones index futures complex is represented by two primary contracts:
E-mini Dow Jones Futures (YM)
Micro E-mini Dow Jones Futures (MYM)
Both track the same underlying index and reflect the same market structure, with differences primarily in contract size and capital exposure. On the daily timeframe, YM has been trading within a rising wedge — a structure that typically signals slowing upside momentum and an increased risk of a downside resolution.
What makes this moment particularly important is location. The market is not breaking down from a random price zone, but from a region tightly connected to historical reference points and trader memory.
The Rising Wedge: A Structure Everyone Recognizes
Rising wedges are among the most commonly taught chart patterns. They reflect higher highs and higher lows, but with diminishing upside slope — often interpreted as bullish exhaustion.
In this case, price has been retracing within the wedge, drifting toward its lower boundary. From a purely structural standpoint, a break below that lower trendline would appear to confirm the bearish thesis. Many traders anticipate that:
Support failure invites momentum sellers
Stops from late longs are triggered
Short sellers gain directional confirmation
This is where structure becomes compelling — and where risk begins to build.
The Prior All-Time High: A Psychological Fault Line
Just beneath the lower boundary of the rising wedge sits a highly visible reference level: the prior all-time high at 48,528.
Former highs often play a dual role. They act as:
Support for dip buyers expecting continuation
Trigger levels for bearish participation if broken
A decisive trade below such a level tends to shift sentiment quickly. Longs may exit, and short sellers often step in aggressively, expecting downside follow-through. From a traditional technical perspective, this behavior is logical.
But markets are not driven by logic alone — they are driven by positioning.
The Trap: Where Conviction Meets UnFilled Orders
Directly below the wedge and the prior all-time high lies a key element that changes the entire narrative: a notable UFO (UnFilled Order) support zone near 48,004.
UFOs represent areas where significant order flow previously entered the market but was not fully resolved. These zones often act as latent liquidity pockets, capable of absorbing aggressive participation when price revisits them.
Here is where the trap forms.
If price trades below the wedge and below the prior all-time high, it is likely to attract a surge of short sellers acting on:
Pattern breakdown logic
Momentum confirmation
Bearish sentiment reinforcement
However, if that downside move runs directly into unresolved demand from the UFO zone, the market may not continue lower. Instead, selling pressure can be absorbed faster than expected.
At that point, short sellers — confident moments earlier — may find themselves positioned on the wrong side of the market.
Why Structure Alone Isn’t Enough
This is the limitation of standalone technical analysis.
Chart patterns describe shape, not intent. They show where price has been, not how participants are positioned or where liquidity is likely to respond. A structure can break “correctly” and still fail to deliver continuation.
When too many traders act on the same signal at the same location, the market often does the opposite — not out of randomness, but out of mechanics.
In this case:
The rising wedge creates a bearish narrative
The prior high validates that narrative
The UFO support beneath invalidates trader expectations
Understanding this interaction is critical. Structure must always be evaluated alongside order flow context, not independently.
Illustrative Trade Scenario: Understanding Asymmetry
The following is a purely illustrative case study, designed to demonstrate risk logic — not to provide trading instructions.
One hypothetical framework might involve:
Price trading below the wedge and prior all-time high
Short sellers committing aggressively on perceived confirmation
Price interacting with the UFO support zone near 48,004
If selling pressure fails to extend and price stabilizes or reclaims broken structure, short sellers may be forced to cover. That covering process can accelerate upside movement, not because of new bullish conviction, but because trapped positions must be unwound.
In such scenarios:
Risk is defined by invalidation below the support
Reward emerges from forced repositioning
The edge comes from asymmetry, not prediction
The key lesson is not direction, but context.
Risk Management: Traps Cut Both Ways
Traps do not always work. Support and resistance zones based on order flow could fail too, and price can continue lower. This is why risk management remains non-negotiable.
Key principles include:
Predefined risk before engagement
Acceptance of invalidation
Position sizing aligned with volatility
Markets punish certainty. Risk management exists to survive uncertainty.
YM and MYM Contract Specifications
Understanding contract mechanics is essential when applying any analysis.
E-mini Dow Jones Futures (YM)
Contract multiplier: $5 × Dow Jones Index
Minimum tick: 1 index point
Tick value: $5 per contract
Current margin requirement: ~$14,250
Micro E-mini Dow Jones Futures (MYM)
Contract multiplier: $0.50 × Dow Jones Index
Minimum tick: 1 index point
Tick value: $0.50 per contract
Current margin requirement: ~$1,425
Margin requirements vary by broker and market conditions. Micro contracts offer reduced exposure and granularity, while standard contracts provide higher notional exposure. Both reflect identical market structure.
Key Takeaways
This YM case study highlights several enduring market lessons:
Widely recognized structures attract crowded positioning
Breakdowns near major reference levels amplify conviction
UnFilled Orders can absorb participation and reverse expectations
Structure without order flow context is incomplete
Markets don’t move because patterns exist. They move because traders are positioned — and sometimes trapped.
Data Consideration
When charting futures, the data provided could be delayed. Traders working with the ticker symbols discussed in this idea may prefer to use CME Group real-time data plan on TradingView: www.tradingview.com - This consideration is particularly important for shorter-term traders, whereas it may be less critical for those focused on longer-term trading strategies.
General Disclaimer
The trade ideas presented herein are solely for illustrative purposes forming a part of a case study intended to demonstrate key principles in risk management within the context of the specific market scenarios discussed. These ideas are not to be interpreted as investment recommendations or financial advice. They do not endorse or promote any specific trading strategies, financial products, or services. The information provided is based on data believed to be reliable; however, its accuracy or completeness cannot be guaranteed. Trading in financial markets involves risks, including the potential loss of principal. Each individual should conduct their own research and consult with professional financial advisors before making any investment decisions. The author or publisher of this content bears no responsibility for any actions taken based on the information provided or for any resultant financial or other losses.

February Overview – BTCJanuary closed below 80K, something that did not happen in any monthly candle during 2025.
This shift opens two main scenarios:
*A potential bear market
*Or a broader consolidation year
As long as we do not get a monthly close below 70.5K, the base case remains consolidation, not a clear bear market.
Additionally, during 2025 we did not fully fill the monthly Fair Value Gap (FVG), located around 73.6K.
This keeps that level technically open, making it a valid level to revisit and a strong demand zone to look for a corrective long.
Daily Structure & Momentum
On the daily timeframe, price has printed a lower low, which is structurally bearish;
However, we can clearly see a double bottom on RSI
This effectively acts as a bullish RSI divergence, suggesting downside exhaustion rather than continuation
February Range Expectation
For February, the expectation is continued consolidation or correction.
A reasonable working range for the month:
*Lower bound: ~70K
*Upper bound: ~95K
As long as price remains inside this range, we are still operating within a consolidation environment.
A clean break outside of these boundaries would imply a shift into a different market regime.
It is also important to remember that the yearly Point of Control (POC) is located around 90K, making it a key magnet and reference level for price.
Trading Plan:
Primary idea for February:
Look for a corrective long around 73K–73.5K, targeting a move back toward 90K, aligned with the open monthly FVG and higher-timeframe structure(Montly EQL's)
Weekly Probability Trades (CoinGlass-Based)
What this data represents:
The “Week with the highest probability to close Bullish or Bearish” does NOT refer to weekly returns.
It is based on CoinGlass historical data, specifically on how many times a given week has closed Bullish or Bearish throughout history.
In other words, this is a probability of weekly close direction, not percentage performance.
Based on CoinGlass data for February:
Week 7 (February 9 – February 15):
Highest probability to close Bullish → Bullish bias
Week 8 (February 16 – February 22):
Highest probability to close Bearish → Bearish bias
These probabilities define a directional bias, not an automatic trade.
Execution Logic:
Because this is about weekly close probabilities, the plan is to trade toward the expected weekly close.
If we are at the beginning of the week, we look to align early with the probabilistic direction.
If we are already in the middle or later part of the week and price is still moving against the direction with the highest probability to close, we will look for entries in favor of that probabilistic bias.
Targets & Positioning:
*The Weekly Open, or
*Beyond the Weekly Open, if structure and momentum allow it
Prefering wide invalidations based on Mid TimeFrames like H1 and H4
Non-Negotiable Rule:
No price confirmation = no trade in that direction
Probabilities will provide context and bias, not entries, execution is always driven by price action confirmation.

SHREECEM – Weekly ChartPrice is approaching a broad trendline support while forming a descending triangle on the upper side. Weekly structure shows compression. We can expect a possible strong move ahead once it reaches the major support zone. As of now watch the trendline.
Break down = momentum shift in the downward direction
Bounce = continuation to the upside

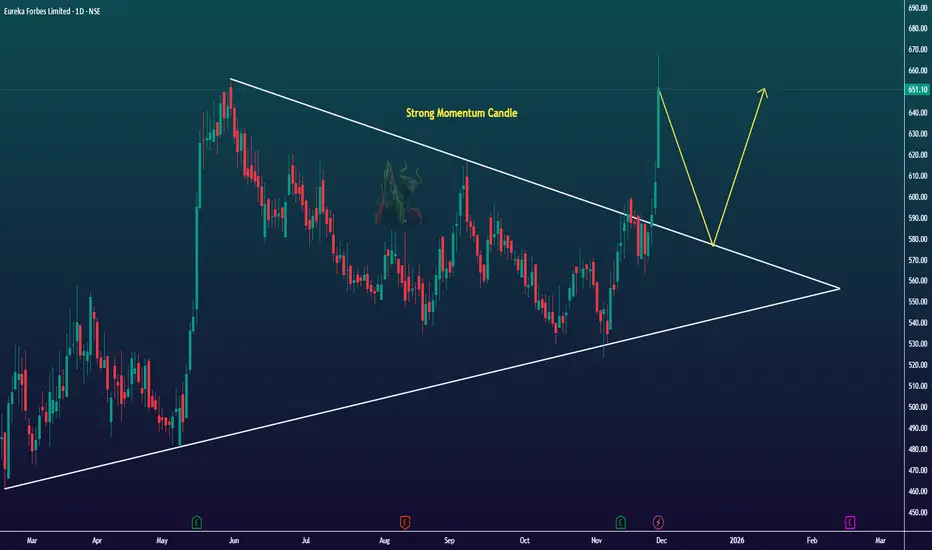
Momentum Shift Detected in EUREKAFORBNSE:EUREKAFORB shows a strong momentum candle on the daily chart after weeks of choppy structure. Price is pushing into a higher zone.
momentum is clear, but structure is still broad. Watching how it behaves in the next few sessions.
FET: Still hasn't decoupled from BTC. Trade may be invalidatedWith the dominance chart still showing its self in a topping phase, and FET showing repeat bear market bottom patterns, I was very excited to see what it may do.
As the counter-trend has developed and under-whelmed for BTC, altcoins still have not decoupled from BTC as you would have expected them to. BTC is on the verge of another big leg down if it follows historical TA, and altcoins will follow along in how they are behaving now.
FET recently tested the big picture RSI trendline on the weekly chart, and rejected from it. It did the same thing once at its most recent market cycle bottom, only to overcome it after doing a bear trap downward move. We may see the same thing happen again.
We didn't even get to test the 1W 21 SMA, which we have always done each time FET has seen a major downward move. I think that we still need to do that.
If we are lucky - we may push down to the bottom trendline of the big falling wedge that FET is in now. This could coincide with a test of the 17.5 cent Support/Resistance. If this structure fails when/if BTC follows along with historical TA -- then we are going to face some more downside, obviously.
Anyway, it would be nice to just have a quick bear trap at worst, and then a new bullish cycle for FET : )

$BMNR: The $161 Ghost Top – Will the Great price void be filled?💀📉 💀📉
We need to talk about #BMNR.
Tom Lee’s vision of an 'Ethereum Treasury' is a grand experiment, but for retail investors, it’s becoming a house of mirrors.
The Trap: Thousands of retail accounts are trapped at the $100+ entry levels. With the current price at $25, the psychological damage is already done.
The Gap: Look at the monthly chart. There is a massive, unfilled gap from $12.38 down to the $4.57 zone.
The Reality: $4 billion of unrealised losses on just $79.3M in revenue is not a business; it's a high-stakes bet with YOUR capital. $200M stake on youtuber is a massive gamble. Completely unrelated to bringing Tradfi on chain.
Warning: If we lose the $24.33 support, the next unfulfilled targets will likely be met.
With $16.70 a high conviction probability imho.
#BMNR #TomLee #Ethereum #StockMarketCrash #RetailTrap #DilutionWarning
📉 3 Red Flags
1. The "Split-Adjusted" Illusion & High-Price Trap
The stock reached an all-time high of $161 earlier in the year but is currently trading around $25.10.
The Danger: Retail investors who "bought the top" are now sitting on 84% losses.
The Gap: There is a significant technical gap back toward the $3.20 - $5.00 range (the 52-week low). If the market loses faith in the "Ethereum Treasury" narrative, the stock could gravity-pull toward its DCF (Discounted Cash Flow) fair value of just $0.18.
2. The "Alchemy of 5%" vs. Extreme Dilution
Tom Lee’s strategy, "The Alchemy of 5%," aims to control 5% of the total ETH supply.
The Dilution: To fund this, Lee recently asked shareholders to approve a 100x increase in authorised shares—from 500 million to 50 billion.
The Warning: While Lee claims this keeps the share price "reasonable," it effectively ensures that current retail holders will be massively diluted unless ETH prices go parabolic immediately.
3. The Financial "Flippening"
The company’s latest financials (Q1 2026) showed a staggering $5.2 billion net loss, flipping from a profit just one quarter prior.
Fragile Model: Despite having $14 billion in assets, the revenue from staking.
Is only revenue if sold for Dollars.
He made himself a Eth whale --- where dumping is part of the business model.
The Risk: This creates a situation where the stock trades purely on the sentiment of ETH, but with the overhead of a massive corporate cash-burn.

$CRCL to $28-40 before higher?This is is a long term chart of CRCL. You can see that we've been consolidating in a falling wedge ever since the IPO. I think it's likely that we see a capitulation style move down to the lower supports at $28-40, and then we'll see a bounce after that will setup a long term bull market.
Don't get shaken out before the bull run.
I think you'll want to bid the lower support levels on the chart and hold for $300-500+.

$BBAI: From Hibernation to 4X AI rocket ship?🐻🐻🐻
BigBear.ai is no longer just a struggling SPAC; it is positioning itself as the "Palantir for the Rest of Us" in the defense and cargo security sectors.
(at least that is the narrative)
I'm looking at a 4X potential move on #BBAI as it coils at the bottom of a massive #HVF pattern
@TheCryptoSniper
The Move: A high-volume break of $6.62 targets the previous highs near $10.36, with an ultimate 'cycle' target in the mid $20s.
The Fuel: Debt is gone, and the company is now a 'Smart Trade' powerhouse after the CargoSeer and Ask Sage acquisitions.
Don't sleep on the only sub-$3B AI play with deep U.S. Army and Middle East government ties. If this 'coiling' breaks up, it could make some peoples' entire year."
#BBAI #BigBearAI #AIStocks #SmallCap #Breakout #TechnicalAnalysis


Falling wedge pattern on zillow!OptionsMastery:
🔉Sound on!🔉
📣Make sure to watch fullscreen!📣
Thank you as always for watching my videos. I hope that you learned something very educational! Please feel free to like, share, and comment on this post. Remember only risk what you are willing to lose. Trading is very risky but it can change your life!

01/18/2026 HOOD longHello traders,
I’m seeing many S&P stocks forming wedge patterns (QQQ is also forming a wedge), and HOOD is one of them. While the exact catalyst for the next market move is unclear, it appears something is cooking, and a directional move may be approaching. HOOD is currently sitting near the lower boundary of its wedge and could bounce toward the upper range. Let’s stay disciplined and trade cautiously in this choppy market.
May the trend be with you.
AP

Platinum catch up trade shows +33% upside.AI says:
1. The Great Supply Vanishing Act
South African Grid Collapse: Mining in the Bushveld Complex (75% of global reserves) is crippled by ongoing energy instability. Deep-level mines cannot operate without consistent power, creating a permanent floor under the price.
The Russian Deficit: Geopolitical friction and US tariffs (with dumping margins estimated at 828%) have effectively "locked out" a massive portion of global supply.
Depleted Buffers: Above-ground inventories that buffered the market for years have been eroded by three consecutive years of deep deficits.
2. The "Rich Man's Gold" Re-Rating
The Catch-Up Trade: Historically, platinum traded at a 1.2x premium to gold. With gold sitting at record highs near $4,400, a "normalization" of this ratio would put platinum well above $5,000.
Investment Surge: In 2025, Chinese investment demand for platinum grew by 47% as it shifted from an industrial metal to a "store of value" and hedge against currency devaluation.
3. The $4K Technical Trigger
The Breakout: Bank of America recently "panic-raised" its 2026 forecast to $2,450, a target that was almost immediately blown away by the current spot price of ~$2,658 - $2,900.
The Extension: Analysts are now eyeing the $3,400 - $4,000 zone as the next major Fibonacci extension if the current "volatility coil" breaks to the upside.

$PLG: The 'Waterberg' Giant is Waking Up!⛏️🇿🇦⛏️
Don't let the 'No Production' tag fool you. Institutional accumulation is hitting 5-year highs as #PLG increases its stake in the massive Waterberg Project.
The Play: We just cleared the 52-week high of $3.49. Volume is supporting the move.
The Catalyst: Funding news or a formal 'Concentrate Offtake' agreement could re-rate this from a $3 'penny' play to a $7+ institutional favorite.
Risk: It's high-beta and overbought on the RSI (77), so expect some volatility at the open.
Target: $3.87 (Next Resistance) -> $6.96 (Institutional Consensus).
#PLG #Mining #Platinum #Palladium #SouthAfrica #Waterberg #Breakout"
🐂 The Fundamental Bull Thesis
While AMEX:PLG isn't pulling metal out of the ground yet, the "smart money" is betting on the Waterberg Project being the most strategic PGM (Platinum Group Metals) asset of the decade.
World-Class Scale: Waterberg is projected to be one of the largest and lowest-cost underground PGM mines globally, targeting platinum, palladium, rhodium, and gold ("4E").
The "Implats" Opportunity: Major partner Impala Platinum (Implats) recently diluted its stake to 14.6% after pausing capital calls. AMEX:PLG stepped in to fund the gap, increasing its direct ownership and leverage to the project's success.
Stage Six Greenlight: The JV recently approved a Rand 92.1 million (~$5.1M) budget to keep pre-construction and infrastructure work moving through August 2026.
Saudi Refinery MOU: AMEX:PLG is exploring a game-changing MOU with Saudi Arabia for a potential smelter and refinery, which could bypass traditional South African processing bottlenecks.

$USDT & $USDC vs. $ETH - Warning a Funeral could occur. 💀 💀 💀
Watch the Stablecoin/ETH Market Cap ratio carefully.
A spike here isn't always 'Dry Powder' waiting to buy.
The Trap: If ETH breaks the $2,400 support level, we could see a 'Liquidation Spiral' that sends the ratio to all-time highs.
This isn't new money coming in—it's ETH value vanishing.
Safe Haven: Cash is King until ETH reclaims its 200-day SMA at $3,400."
#ETH #Ethereum #Stablecoins #MarketCrash #LiquidityTrap #CryptoAnalysis @thecryptosniper #HVF
what does AI say:
📉 The Doomsday Ratio: (USDT + USDC) / ETH
In a crash, this ratio spikes vertically. But unlike a "healthy" spike (where new money enters), this is a "Deleveraging Spike."
1. The ETH Collapse (The Denominator Shrinks)
Revenue Compression: Layer 2s are so efficient now that they are starving the Mainnet of fees. Without a high "burn" rate, ETH is becoming slightly inflationary again, losing its "Ultra Sound Money" appeal.
The ETF "Exodus": If institutional investors see ETH as a "leveraged claim on ecosystem activity" that isn't growing, they may rotate back to Gold or Bitcoin. A sustained outflow from spot ETFs could trigger a -40% re-rating.
The Liquidation Spiral: Since many "loopers" use ETH as collateral to borrow stablecoins, a price drop below $2,400 could trigger a cascade of liquidations on Aave/Compound, forcing more ETH onto the market and crushing its market cap.
2. The TradFi Standoff (The Numerator Stagnates)
The "Trust Gap": If the ratio increases simply because ETH is dying, TradFi institutions won't "buy the dip" with new USDC. They will wait for more regulatory "Supervision" rather than just "Legislation".
The Yield Trap: If stablecoins like USDT/USDC don't offer higher yields than risk-free US Treasuries (currently highly competitive in 2026), there is no incentive for a corporate treasurer to move cash onto the blockchain.

Selena | XAUUSD –Intraday Bullish Continuation After CorrectionPEPPERSTONE:XAUUSD FOREXCOM:XAUUSD
Following a sharp expansion move, XAUUSD entered a controlled correction rather than distribution. Buyers stepped in precisely at the lower demand zone, preserving higher-low structure. As long as price holds above this base, continuation toward higher liquidity remains the higher-probability scenario.
Key Scenarios
✅ Bullish Case 🚀 →
Holding above 5,460–5,480 supports continuation
🎯 Target 1: 5,560 – 5,580
🎯 Target 2: 5,640 – 5,700 (Liquidity Extension)
❌ Bearish Case 📉 (Invalidation) →
Sustained acceptance below 5,440 would weaken bullish structure and delay continuation.
Current Levels to Watch
Resistance 🔴: 5,560 – 5,580
Support 🟢: 5,460 – 5,440
⚠️ Disclaimer: This analysis is for educational purposes only. It is not financial advice.
