Bitcoin's Trend Changes after Reaching 0.5/0.6 Fibonacci LevelBTC Trendline Breakout, so market may retrace to Fibonacci levels 0.5(63919) or 0.6(62196)...
After reaching these levels, BTC may either Bounce or change from Downtrend to Uptrend.
I want to help people Make Profit all over the "World".
Crypto market

Chart Pattern Analysis Of BTC.D
In week Chart,
K2 close upon the neck line of a potential bullish head-shoulder pattern.
The supply or demand pressure keeps at high level.
The larger scale horizontal trend still has its power to pull back the price.
If the high supply pressure candle K1 want to reverse the bullish market,
K2 must close below the support immediately.
It seems that the following candles will consolidate here for weeks.
It is not easy to take more money on other crypto tokens.
The ultimate price target of the bull market is about 60%.
A final upthrust wave will likely take the price there.

USTCUSDT UPDATE#USTCUSDT(Update)
Hey dear traders. Hope you are enjoying analysis with our team. we are here to analyze USTCUSDT today.
Symmetrical Triangle Formation in 1D time frame.
Incase of Successfull Breakout Expecting Massive Bullish wave📈🚀

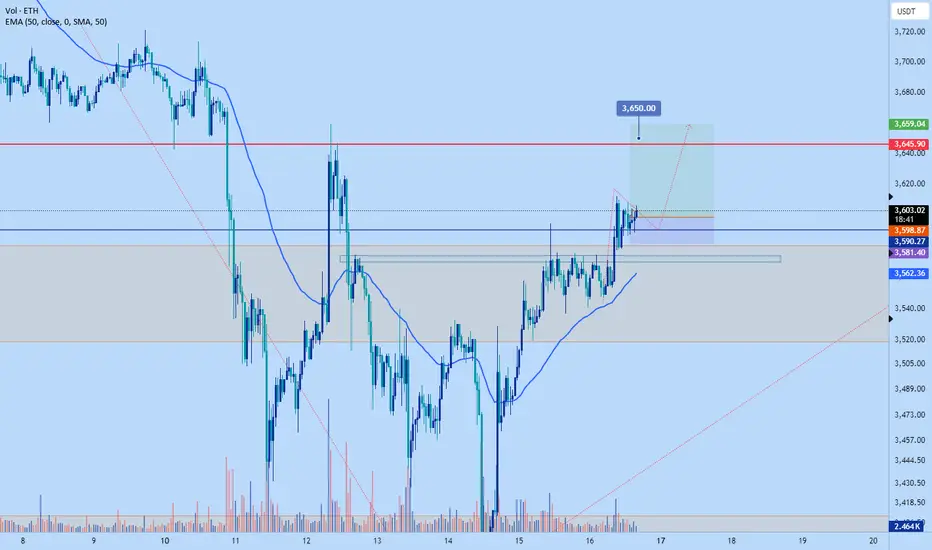
Eth to pump to $3650 by EODI'm anticipating Ethereum to make and impulsive push to close the week above $3650
Stop $3581 or lower
Target :$3650-$3660
Roughly 3 RR trade.
I trade price action, trends, support and resistance with confluences like volume, certain time of day, fibs and EMA . I don't have any fundamental theory as to why the price will go up or down other than demand being more than supply or vice versa.
BTC/USD Poised for Bullish Momentum Amid ConsolidationBTC/USD Daily Chart Analysis
Trend Analysis:
- The daily chart shows an overall bullish trend with higher highs and higher lows since late last year.
- Recently, the price has been experiencing consolidation with some volatility but remains above key support levels.
Support and Resistance Levels:
- Immediate Support Level: 65,000, which could act as a strong support if the price pulls back.
- Next Support Level: 62,400, a significant support level that has been tested previously.
- Immediate Resistance Level: 70,000, which could act as a barrier to upward movement.
- Next Resistance Level: 73,800, a key resistance level that aligns with recent highs.
Technical Indicators:
- The recent price action and candlestick patterns suggest consolidation within a bullish context.
- The overall momentum remains positive, indicating potential for continued upward movement.
Direction Preference:
Given the current bullish trend and the higher time frame, the preferred direction for BTC/USD in the short to medium term is bullish. The price is likely to continue moving higher towards the resistance levels of 70,000 and potentially 73,800.
Key levels to watch:
- Pivot Price: 66120
- Resistance: 70000, 73810, 76500
- Support: 64900, 62400, 59940
Conclusion:
The BTC/USD daily chart indicates a bullish trend with continued upward momentum. It is advisable to consider long positions, targeting the resistance levels at 70,000 and 75,000. Monitor for any signs of consolidation or pullback, but as of now, the bullish trend remains the preferred direction for today and the near future.

BTCUSD retest 70k?While the price of bitcoin continues to be undervalued, i genuinely think we see a bullish rally back to 70k, while this isn’t the usual ideal trade I’ve been long since day candle open and so far so good. I will wait and see if price holds till we hit 70k.

FLOKI TALLIES WIH PEPE - SAME BLUEPRINT
The striking correlation between $flokisusdt and BINANCE:PEPEUSDT will make you think they're being developed by the same developer, it is insane. Starting from the wave 2 and 4 of the of wave 1-yellow being a classic Zigzag and Triangle and wave 2-yellow for both being a classic Zigzag as well.
If you missed that big run for Floki and Pepe (called it since) there is still some juice left, at least 100% before we sell both and go away again.
PREVIIOUS ANALYSIS
OTHER ANALYSIS

ETHUSDTETHUSDT : SELL
Open: 3740
SL: 4150
TP: 2220
===================
Disclaimer: Any content in this text does not constitute investment advice. This text provides an objective description of the market situation and should not be considered an offer to sell or a solicitation to buy.
Any decisions made based on the information provided in this text are your personal responsibility. Any investments made or to be made should be analyzed based on your financial situation and personal goals.

Algorand (ALGO): Head&Shoulders Pattern About To Break NecklineAlgorand is looking sweet with a ncie H&S pattern where we are now at the final stage of breakdown (price is testing the neckline zone).
We are looking here for a full-scale breakdown, which would result in a movement to the lower target zone!
Swallow Team

Cardano (ADA):Multiple Rejections From EMAs / Breakdown IncomingCardano has made a good movement after having multiple successful re-tests of that 200EMA, where each one of them gave more and more confirmations of the seller's dominance.
With that being said, we are now back at the liquidity grab zone, which is also a smaller support. Upon breaking it, we should see a really good downward movement here!
Swallow Team

SOLANA Super Trend. SOL trend continues to look strong & one of the best charts out there. Possible deviation & liquidity grab lower to search some bid.

Xrp zone to open longPotential zone for XRP BINANCE:XRPUSDT
Possible Targets and explanation idea
➡️Absolutely no make sense in this victory against SEC. What people waited over 5 years
➡️We swept one liquidity pool and road now open to another ss liquidity
➡️At that level also we can find out based on TP indicator buy line and fundamental price
➡️No money inflow now in XRP based on MP indicator
➡️block for potential long marked! target take profit line on D.
Hope you enjoyed the content I created, You can support with your likes and comments this idea so more people can watch!
✅Disclaimer: Please be aware of the risks involved in trading. This idea was made for educational purposes only not for financial Investment Purposes.
---
• Look at my ideas about interesting altcoins in the related section down below ↓
• For more ideas please hit "Like" and "Follow"!

#Ethusdt set to hit 3500we can sell when it hits again the lower highs and we must make sure to set our stoploss

Bome LongBOME has a perfect bounce from the support line maintaining from last eum and is showing bullish momentum, currently trading at 0.104. This upward trend indicates a promising entry point at 0.010400.

ORNUSDT UPDATE#ORNUSDT(Update)
Hey dear traders. Hope you are enjoying analysis with our team. we are here to analyze ORNUSDT today.
Symmetrical Triangle Breakout Done in 1D time frame.
Expecting Massive Bullish wave📈🚀

Op scalping trade #scalpI am currently considering a quick trade on Op Coin. My entry point is based on the RSI divergence and price movement. That's the main reason for my decision.

CRO in weekly chart Hello
I don't think that this analysis works for your today situation but it can make a simple plan for your next decisions.
There is an alternative for this chart that says what did happen was an ABC and we are in the beginning of a bearish impulse but it is so far from my mind.
We can decide about next movements whenever this trend passes confirmation 2.
For now the best strategy is to increase your spot coins in your wallet and leave it.

ETHFI - Confirmed Breakout for a LONG trade$BINANCE:ETFIUSDT (4H CHART) Technical Analysis Update
ETHFI is currently trading at $4.1 and showing overall bullish sentiment. Price has broken out from the resistance zone and showing a good bullish momentum. Our first target is around the resistance zone (4.3-4.4) and we can expect the price to reach around 4.8
This is a short term trade and if the price breaks below the support of 3.7 then bearish trend will continue and we will have a short trade opportunity.
Entry level: $ 4.09
Stop Loss Level: $
TakeProfit 1: $ 4.224
TakeProfit 2: $ 4.352
TakeProfit 3: $ 4.481
TakeProfit 4: $ 4.684
TakeProfit 5: $ 4.862
Max Leverage: 3x
Position Size: 1% of capital
Don't forget to keep stop loss.
Follow Our TradingView Account for More Technical Analysis Updates, | Like, Share and Comment Your thoughts.
Cheers
GreenCrypto

My clear view on #SNXUSDT bearish are in position now let enter with good stoploss of 2% with high win rate

15x Gain vs ETH is programmed 🫵😹 MOGGERS
The chart's setup is looking bullish, and we could be on the verge of another big move. Here's the breakdown.
📈 Price Action and Patterns:
The chart shows a classic bull flag formation, a continuation pattern indicating the potential for further upside. After a massive 1,629% measured move, MOG broke out of the flag and is currently retesting the breakout level. This retest is crucial—if the price holds, we could see another leg up.
🔑 Key Fibonacci Levels:
We're focusing on the Fibonacci extension levels for our next targets:
211.3% extension at 0.00000010 ETH
265.0% extension at 0.00000039 ETH
The 165% target has already been hit, so our eyes are set on the next levels.
📊 Volume and Momentum:
Volume has been steady, supporting the current uptrend. We're seeing increased interest and activity around MOG, which is a bullish sign.
💬 Market Sentiment:
The MOG community is buzzing, with a lot of enthusiasm and positive sentiment. This meme-powered coin is riding the wave of viral content and community-driven hype. With Ethereum's recent bullish trend, the gains in USD terms could be even more significant.
💡 Final Thoughts:
Stay vigilant and watch those key levels. If we maintain the current support and break through resistance, MOG is poised for another explosive move.

The ONLY #bitcoin model you ever needIf she breaks to the upside, a minimum 100% expansion of the break our price range, we can see #bitcoin make it to $95,000 area. 2 expansions will put bitcoin at $125,000 plus price range area.

BTCUSDt - Bitcoin H4The moving average system (MA168. MA42. MA24) has become the "Downtrend ranking" and recommends "Short Position at High Level" as the main operating strategy of H4.

TOTAL 3 - Can do +30% move versus #BTC pre halving #ALT runThis chart Total 3 minus the 3 biggest stablecoins
OVER the price of #Bitcoin
If this number is going up so are your #altcoins
We have a clear double bottom forming
just a matter of clearing the neckline to confirm.
Also interesting to note how the 0.786 Fibonacci was front-run by eager investors looking for Risk assets.
