#RLC/USDT breaks the Diagonal Trendline in 1-Hour TF!#RLC/USDT breaks the Diagonal Trendline in 1-Hour TF!
GETTEX:RLC needs to fill the FVG before a lag up. #RLCUSDT's major resistance level is around $2.21. #RLC support level is $1.985.
Crypto market

"Ethereum and ETHBTC Analysis: ETF Opening Impact"🕵️♂️ Let's dive into Ethereum, the queen of the market, and update last week's analysis while assessing the potential impacts of the upcoming Ethereum ETFs and identifying new triggers.
🌟 Weekly Updates:
Starting from Monday to Wednesday, we'll cover , Monday: Bitcoin and Dominance analysis , Tuesday: Ethereum and ETH/BTC analysis , Wednesday: Gold analysis
These are in addition to our daily analyses.
🎉 Channel Milestone 800 Followers:
Thank you all for helping this channel reach 800 followers! Our next goal is 1,000 followers. Let's keep growing together!
💎 Previous Analysis Recap:
In our previous analysis, we noted Ethereum being stuck in the range between 3638 and 3407. After moving out of this range and hitting support at 3283, we have once again moved back into this range. This movement is heavily influenced by Bitcoin and BTC dominance, causing other coins to correct when Bitcoin finds support. Until further notice, open positions aligned with Bitcoin.
📅 Weekly Timeframe:
In the weekly timeframe, after last week's candle closed, we saw significant selling pressure and a bearish move at the start of this week. However, today we observed a rest day with an upward correction. Key entry points for holding Ethereum or using it in DeFi will be after breaking above 3919. For short-term holders, exiting after breaking below 2932 is advisable as it increases the likelihood of further decline.
⏰ Daily Timeframe:
In the daily timeframe, after being rejected from 3881 and forming lower highs, we have seen a decline. The presence of small candles with shadows indicates a lack of momentum and trend in the market. Although sellers attempted to push the price down in the previous candle, they were not successful. Watch for red candles with volume in the coming days to indicate seller re-entry. Key supports are at 3246 and 2892.
⏱️ 4-Hour Timeframe:
In the 4-hour timeframe, after breaking support at 3409, we saw increased volume and entered the oversold area before bouncing to the resistance. We are currently in a pullback phase with decreased volume. For long positions, no triggers are present at the moment. For short positions, look for rejection from 3409 with a high-volume candle with an upper shadow, or move to a lower timeframe to confirm the first trigger and pullback.
💰 ETHBTC Analysis:
Finally, ETHBTC has stabilized above the daily resistance at 0.05184, indicating some independence from the market. If we move above 0.05638, ensure to have long positions in Ethereum if the market turns bullish. In a bearish market, Ethereum will likely experience less decline than Bitcoin and other coins.
🏅 On-Chain Data and Liquidity:
Despite breaking support, there were no significant orders to drive the price back, indicating a lack of selling interest. Buyers entered the market post-breakdown. It's a good practice to check on-chain data during market stagnation. I'll likely provide an educational piece on this soon.
🏦 Impact of Ethereum ETFs:
The launch of Ethereum ETFs can significantly impact the cryptocurrency market and investors by increasing acceptance and legitimacy of Ethereum. This acceptance can boost investor confidence and lead to price increases as institutional demand grows. The launch of ETFs also makes it easier for retail investors to access Ethereum, potentially expanding the investor base.
🔑 Key Support and Resistance Levels:
Supports Levels: 3272 , 3040
Resistances Levels: 3628 , 3922
😊 If you'd like me to analyze a specific coin or currency pair, be sure to comment so that I can allocate the next analysis for you!
⚠️ Also, please remember that I'm just an analyst, and this isn't financial advice. We're here to stay in the market and maximize profits by adhering to risk and capital management principles.

Safety zone - SMA-200Historically, buying below SMA-200 is one of the safest places because price always went up from here. Nevertheless, i would wait until price decline at least 30% more from here first

MTLUSDTHM signal v5.0 (High momentum) spotted. Looking good with previous wave up with increasing volume and momentum.
- Heathy retracement and support well at good level @ 1.2999-1.3569
- Trending slow and steady if able to hold above the support zone
It is at extremely good reward to risk level now if able to hold above the support level.

LTC/USDT Showing Bear SignsEntering into a bear market now. It's been a while sense I have posted.
Exact targets wont be given. But will be on future posts.

$$$WIFUSDT, Move to the dky soon.Welcome, Trader. Welcome to our cryptocurrency community!
We are going to discussing #WIFUSDT 💹
#WIFUSDT🔥🚀
---------------
Update:
#WIF forming a descending channel pattern on a 4 Hr time frame✅👉.
The breakout to this pattern is done successfully and now waiting for another bullish candle close.➡️✅
If this candle close above to the previous candle, we are expecting 44% very soon.📈👀
Crypto Analyst Hub
#crypto #cryptocurrency #bitcoin #ethereum #blockchain #btc #cryptotrading #cryptonews #eth #cryptocurrencies #nft #bitcoinnews #bitcoins #trading #bitcoinmining #forex #binance #cryptoart #nfts#trading #forex #trader #investing #stocks #forextrader #stockmarket #daytrader #forextrading #invest #bitcoin #daytrading #cryptocurrency #crypto #investor #investment #forexsignals #nse #chartpattern #cedarforex #candlepatterns #learntrading #bseinstitute #shorttermtrade #bankniftytrading #stockmarketph #calloptions #mqlsignal #futuretrader #tradingmemes #chartpatterns #tradingview #tradinglife #tradinglifestyle #tradingstrategy #tradingtips #tradingplan #tradingsignals #tradingaccounts #tradingsignal #tradingforex #tradingsync #tradingroom #litecoin #ethereum #bitcoincash #cryptocurrencies #ripple #btc #bitcoinnews #bitcoinmining #blockchain #eth #bitcoin #bitcoins #coinbase #cryptocurrency #crypto #bitcointrading #dogecoin
BTC
ETH
USDT
PEPE
DOGE

#PHB/USDT breaks the Diagonal Trendline in 4-Hour TF!#PHB/USDT breaks the Diagonal Trendline in 4-Hour TF!
AMEX:PHB retest is already done. we have been looking good for a long. The first local resistance level is PWH $2.034, and the strong support level is PWL $1.554.

INJ Gears Up For $24.50 Injective Protocol bounced amazingly at its local bottom yesterday. Since hitting $20, INJ is on fire and delivers a strong performance.
But it is getting better: INJ printed a #bullish EMA crossover on the 4H chart. This signal further underpins the uptrend and should fuel INJ's run toward the next resistance at the 24.5 - 25 level.
Although the backtests do not perfectly support gains of 7-9%, the chart definitely supports them.
Currently, INJ is trading in a mini bull flag, and I expect a breakout and test of the 24.5 level within 24 hours.
--
Please visit my profile for more free trade strategies.

ETH Is Getting Ready To Pump!Comparing the BTC and ETH charts after ETF approval:
Following Bitcoin ETF approval, the price initially dropped in a classic "buy the rumor, sell the news" scenario. However, after ETF trading began and inflows increased, the price pumped.
We're seeing a similar pattern with Ethereum. After the recent ETF approval, the price dipped, but a correction might already be underway. With Ethereum ETF trading expected to start on July 2nd, potential inflows could propel the price upwards.
Reagrds
Hexa

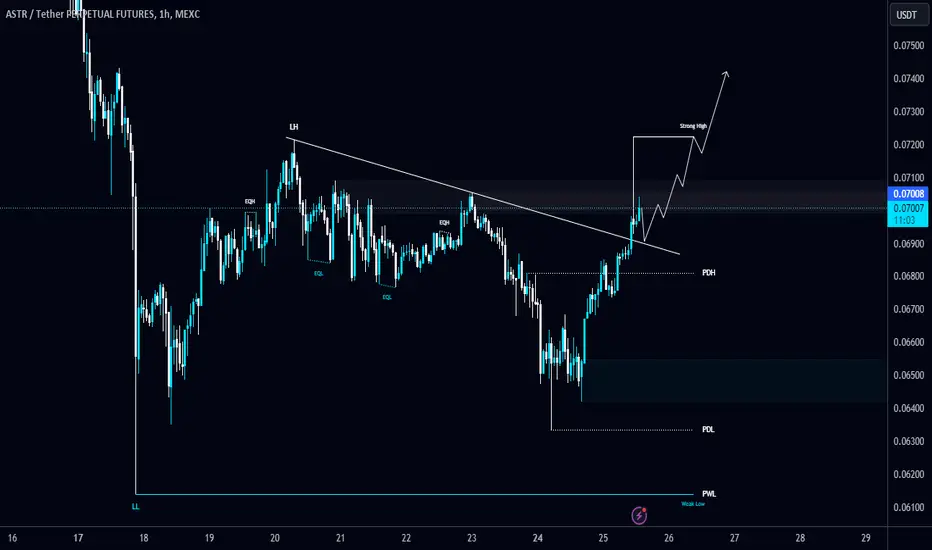
#ASTR/USDT breaks the Diagonal Trendline in 1-Hours TF!#ASTR/USDT breaks the Diagonal Trendline in 1-Hours TF!
MOEX:ASTR looks bullish here. Wait for a retest to open a long position. The local support level is PDL $0.0681.
My PredictionIf it goes to resistance expecting it to go bearish if it breaks support, it will continue to sell

ADAUSDT Elliott wave countCardano may find support into 0.618 fib retracement of wave ((1)) ending a complex correction started from 0.8104.
Price must clear 0.49 level before we may declare an end of the correction at 0.3575.
Also oscillators are showing bullish divergence that may signal a potential shift of the trend.

#AGIXUSDT, Soon we will see a good pumpWelcome, Trader. Welcome to our cryptocurrency community!
We are going to discussing #AGIXUSDT 💹
#AGIXUSDT🔥🚀
---------------
Update:
#AGIX is moving down followed by the trend line over a 4 Hr time frame✅👉.
The trend line breakout is done successfully and now going to retest it➡️✅
In case of a successful retest, we are expecting 42% very soon.📈👀
Crypto Analyst Hub
#crypto #cryptocurrency #bitcoin #ethereum #blockchain #btc #cryptotrading #cryptonews #eth #cryptocurrencies #nft #bitcoinnews #bitcoins #trading #bitcoinmining #forex #binance #cryptoart #nfts#trading #forex #trader #investing #stocks #forextrader #stockmarket #daytrader #forextrading #invest #bitcoin #daytrading #cryptocurrency #crypto #investor #investment #forexsignals #nse #chartpattern #cedarforex #candlepatterns #learntrading #bseinstitute #shorttermtrade #bankniftytrading #stockmarketph #calloptions #mqlsignal #futuretrader #tradingmemes #chartpatterns #tradingview #tradinglife #tradinglifestyle #tradingstrategy #tradingtips #tradingplan #tradingsignals #tradingaccounts #tradingsignal #tradingforex #tradingsync #tradingroom #litecoin #ethereum #bitcoincash #cryptocurrencies #ripple #btc #bitcoinnews #bitcoinmining #blockchain #eth #bitcoin #bitcoins #coinbase #cryptocurrency #crypto #bitcointrading #dogecoin
BTC
ETH
USDT
PEPE
DOGE


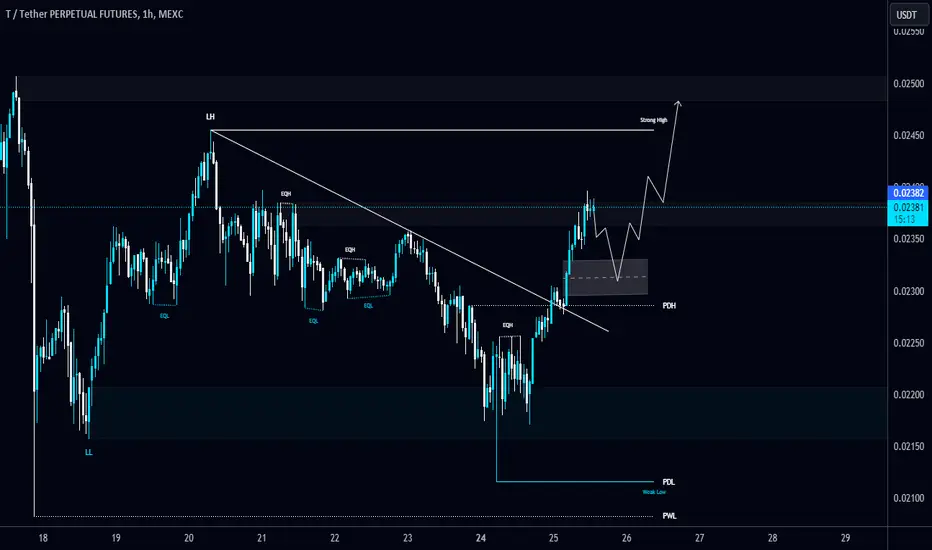
#T/USDT breaks the Diagonal Trendline in 1-Hour TF!#T/USDT breaks the Diagonal Trendline in 1-Hour TF!
I'm expecting a retest before the next lag. Keep an eye on NYSE:T and wait for a retest to long it. The local support level is $0.0228 and the resistance level is $0.02455.
FIL seems longWill Fill get in shape again?
FIL seems long
Will Fill get in shape again?
FIL seems long
Will Fill get in shape again?
FIL seems long
Will Fill get in shape again?
FIL seems long

#COTI/USDT breaks the Diagonal trendline and looks bullish#COTI/USDT breaks the Diagonal trendline and looks bullish in 1-Hour TF!
OTC:COTI local resistance level is PML $0.0997 and the support level is PWL $0.088. I'm expecting a bullish momentum.

#RUNE/USDT breaks the Diagonal Trendline in 1-Hour TF!#RUNE/USDT breaks the Diagonal Trendline in 1-Hour TF!
CRYPTOCAP:RUNE needs to bounce from here. The local resistance level is PML $4.5. The local support level is $3.9. Looking good for a long position.

GRT - Rising bottomsWith rising bottoms, GRT rewrites a new graphic pattern, deconstructing the figure of the descending channel
Pattern: The price is approaching resistance, which is a level where it could pause or reverse its recent advance, at least temporarily. Resistance is at 0. Once the price breaks above the resistance, it may move towards the next resistance level at 0.2529. its support zones are: 0.1963 and 0.1875
The short-term trend is bullish.

#GRT/USDT breaks the Diagonal Trendline in 1-Hour TF!#GRT/USDT breaks the Diagonal Trendline in 1-Hour TF!
JSE:GRT is looking good for the Long position. Wait for a FVG to fill. #GRTUSDT is holding PWL $0.1876 support level, the resistance level is PWH $0.2377.

ETH Update (Demand Zone) JUN-25I am looking for Ethereum to reach my demand zone around 2800. As we know, Ethereum is in a supply and demand movement, but we need to be careful that it doesn't make a retracement first. Always consider your technical analysis and stay alert to the movements Ethereum makes at midnight, as they are very aggressive.
Best regards and thank you for following my analysis.
You can follow me at X (Twitter) @Rocketmike111

NOTUSDT aiming higherHi there traders
We received a new signals from the EnF Breakout Strategy:
BUY on NOTUSDT
See idea for breakout entry, targets and stoploss
Only enter the trade when the price breaks above entry
Check out more on the script:
To get access to this script, DM me

COMBOUSDTHM signal v5.0 (High momentum) spotted. Looking good with previous wave up with increasing volume and momentum.
- Heathy retracement and support well at good level @ 0.6556-0.6583
- Trending slow and steady if able to hold above the support zone
It is at extremely good reward to risk level now if able to hold above the support level.
