Excited bulls? For your sake, don't be... just noWe are at a triple top with a low circa 12 VIX max is 5400 before the fall.
We will not get what Deutche Bank wants 5500 mark my words
Market indices

Nifty returning from 22591 indicates strong resistance zone.Nifty returning from high of 22591 has given indication of strong resistance zone ahead. Also closing above Mid-Channel resistance was a good move but still it is not a convincing upward gallop with market breadth remaining negative and FII still selling relentlessly. Some decent mid and large cap stocks are not moving despite good results and some average stocks and PSU are moving towards exaggerated valuation. PE investing or comparing the 10 year PE to the current PE of the stock should be the way to go for investors. Do not get trapped at levels which might not return for years. (I am nor fear mongering but that should be the case in every and any circumstance anyway.)
Nifty Supports levels: 22470, 22402, 22345, 22257 and 22055.
Nifty Resistance levels: 22530, 22591, 22658, 22730 and 22831.

CHART BREAKDOWN US30: Key Levels, Targets and Thoughts!🎯Brief Description🖊️:
The chart provides insights into critical market levels, emphasizing an essential supply zone (medium-risk sell zone) spanning from 39600 to 39570. Additionally, medium-risk sell zone between 40050-40090, respectively, are highlighted.
Things I Have Seen👀:
Medium-Risk Buy Zone🟠: Noted between 39600 and 39570, suggesting another area with moderate risk for potential buying positions.
Medium-Risk Sell Zone🟠: Noted between 40050 and 40090, suggesting another area with moderate risk for potential selling positions.
Bearish Targets📉:
40000: Possible retracement area.
39900: Possible retracement area.
39800: Area with laying low liquidity.
Ultimate Target: 39600- Essential Demand Zone
Bullish Targets📈:
39700: Possible retracement area.
39850: Possible retracement area.
40100: Area with a lot of liquidity.
What's Important Now❗
Currently, the crucial approach is to wait and observe the price action at this level. We need to assess how the market reacts before considering any decisive moves. Stay observant and responsive to real-time developments in the market.

CHART BREAKDOWN NASDAQ: Key Levels, Targets and Thoughts!🎯Brief Description🖊️:
The chart provides insights into critical market levels, emphasizing an essential demand zone (low-risk buy zone) spanning from 18330 to 18315, respectively, are highlighted.
Things I Have Seen👀:
Important Demand Zone🟢: Identified between 18330 and 18315, serving as a low-risk buy.
Bullish Targets📈:
18400: Possible retracement area.
18500: Possible retracement area.
18580: Possible retracement area.
18670: Area with a lot of liquidity.
What's Important Now❗
Currently, the crucial approach is to wait and observe the price action at this level. We need to assess how the market reacts before considering any decisive moves. Stay observant and responsive to real-time developments in the market.

2024-05-21 - a daily price action after hour update - daxGood Evening and I hope you are well.
overall market comment
Markets went mostly flat today. Nasdaq printed a new ath on another low volume day. Unless markets strongly break above the highs or lows, very uneventful price action. Play the range until it clearly is not working anymore. SP500 printed a tripple top now and selling it again is a reasonable trade.
dax
comment: Bears making lower highs and lower lows but they are too weak to push the market below meaningful lower lows. Bulls are not too eager to print yet another ath and so we chop inside they given range. My head & should pattern lives as long as market stays below 18835, which is 15 points from when I wrote this, so low probability. For now we continue to oscillate around the 1h 20ema but I think the daily 20ema is close enough now for more algos to buy it, for another ATH or another melt-up to my weekly targets.
current market cycle: trading range - bulls broke 19000 but no follow through.
key levels: 18700 - 19000 - below 18700 is 18400 next and above 18840 is 19000 or much much higher again
bull case: Bulls kept it above 18700 which is still uber bullish. Next they will probably break above the bear trend line from ath and above 18840 for retest of the highs. Invalid below 18800.
bear case: Still no gap close to 18850 and we are making lower highs and lower lows. Bears need to step in above 18800 to stay inside the drawn triangle. Bulls closed above the 15 and 1h 20ema, which is not good for the bears. They need strong momentum around EU open to break below again. Bears also have going for them, that US closed green today and retest the highs or made newer highs, while dax made lower highs and lower lows. Their next target below 18800 is 18700 and then the daily ema around 18650. Invalid above 18840.
short term: Neutral 18700 - 18840. Head & Shoulders has still a very low chance of breaking down to around 18400 but don’t bet on then unless you see many strong consecutive bear bars tomorrow.
medium-long term: My long term outlook stays bearish and I expect at least a -20% correction in 2024. Medium term is 17100 while I think we can touch the big bull trend line starting 2022-10 around 16700 in 2024. —unchanged
trade of the day: Long from the EU open was ok, since bears could not close the gap to Friday. Bullish enough for target 18900ish.

DAX Will Keep Growing! Buy!
Hello,Traders!
DXY is trading in a
Strong uptrend and
The index broke the
Key horizontal level
Of 18,550 and is now
Consolidating above it
So we will be expecting
A further move up
Buy!
Like, comment and subscribe to help us grow!
Check out other forecasts below too!

CHN50 to continue in the upward moveCHN50 - 24h expiry
There is no clear indication that the upward move is coming to an end.
Although we remain bullish overall, a correction is possible with plenty of room to move lower without impacting the trend higher.
Risk/Reward would be poor to call a buy from current levels.
A move through 12850 will confirm the bullish momentum.
The measured move target is 12950.
We look to Buy at 12700 (stop at 12600)
Our profit targets will be 12950 and 13000
Resistance: 12850 / 12900 / 12950
Support: 12750 / 12700 / 12650
Risk Disclaimer
The trade ideas beyond this page are for informational purposes only and do not constitute investment advice or a solicitation to trade. This information is provided by Signal Centre, a third-party unaffiliated with OANDA, and is intended for general circulation only. OANDA does not guarantee the accuracy of this information and assumes no responsibilities for the information provided by the third party. The information does not take into account the specific investment objectives, financial situation, or particular needs of any particular person. You should take into account your specific investment objectives, financial situation, and particular needs before making a commitment to trade, including seeking advice from an independent financial adviser regarding the suitability of the investment, under a separate engagement, as you deem fit.
You accept that you assume all risks in independently viewing the contents and selecting a chosen strategy.
Where the research is distributed in Singapore to a person who is not an Accredited Investor, Expert Investor or an Institutional Investor, Oanda Asia Pacific Pte Ltd (“OAP“) accepts legal responsibility for the contents of the report to such persons only to the extent required by law. Singapore customers should contact OAP at 6579 8289 for matters arising from, or in connection with, the information/research distributed.

DOW JONES INDEX (US30): Waiting for FOMC
Do not forget, traders, that tomorrow we are expecting FOMC.
Ahead of these fundamentals, US30 started to consolidate
within a narrow intraday range on a 4H time frame.
I will wait for its bullish breakout for a strong bullish confirmation.
4H candle close above that will confirm the violation.
A bullish continuation will be expected then.
❤️Please, support my work with like, thank you!❤️

spx last hour pushspx last hour push -seems to be right on time. the last 1hr or 30 mins full of trading opprotunity

Us30 = = = Bullish internal signal 99% returnDaily internal signal analysis
The trend is bullish, with higher highs and lows, but now H4 is diverging and the short position is up to 39635
Now there are two scenarios
The first case
1. If the trend will break the Fibonacci 0.6 level, there is already a divergence
Then there will be a reversal
2. If the level Fibonacci 0.6 is rejected and the EMA is below the Fibonacci level, the trend is more likely to continue
If this level is not broken, then the trend will continue its trend
There is a wait-and-watch position on the trend


You can't miss professional analysis and strategy!May 13-18 is a super bullish sweep before ATH creates a new one. Further upward momentum needs to be reversed. The CPI OB looks likely to be a sustained bullish zone.
When the price decides to trade in this area, it will expand to 15 m /5 m, which can gain a lower TF scalp or enter the highs of the current week.

Professional analysis and strategy, hopefully will help youS&P500 (US500) is falling towards the pivot which acts as a pullback support and could potentially bounce from this level to the 1st resistance.
Pivot: 5,275.81
1st Support: 5,203.86
1st Resistance: 5,379.39

Shock! This analysis strategy is worth a look!Hello, traders
The trend is bullish, with higher highs and lows, but now H4 is diverging and the short position is up to 39635
Now there are two scenarios
The first case
1. If the trend will break the Fibonacci 0.6 level, there is already a divergence
Then there will be a reversal
2. If the level Fibonacci 0.6 is rejected and the EMA is below the Fibonacci level, the trend is more likely to continue
If the trend is rejected
0.6 level, moving average below current level
The trend towards more opportunities will continue
If this level is not broken, then the trend will continue its trend
Maybe we should have a wait-and-watch position on the trend

This analysis is really good, I suggest you take a closer lookHello guys, we are in a very strong trendline resistance area and I am not bearish. If the S&P 500 breaks through 5150, I would be very bearish. I am already long SQQQ and UVIX, UVXY, VXXB and long VIX etn.
Happy trade

Professional trend analysis and strategy, don't missHello, traders, thoughts on potential future price movements.
- 2 Potential options.
- Opportunities can only be realized in one of two "potential" price paths.
- Technical analysis only.
- "No" Consider fundamental analysis.
- Consider "NO" relevance.
Happy trade


BANKNIFTY Trading Plan for 22-May-2024
Overview
On 22-May-2024, BANKNIFTY took support at the marked opening support zone, breached the upper band of the resistance zone but retreated back near the lower band, signaling a potential reversal. Here’s a detailed plan for trading BANKNIFTY on 22-May-2024 (expiry day).
Gap Up Opening
If BANKNIFTY opens above 48150:
Sustains above 48180 for the first trading hour:
Buy Trade:
Target: 48419
Sideways Movement: Prices might face rejections and trade sideways at this level.
Break and Sustain Above 48450:
Next Target: 48606
Doesn’t sustain and trades below 48000:
Short Trade:
Target: 47879
Below 47800: Prices may drop to 47674 – 47621
Flat Opening
If BANKNIFTY opens flat:
Faces rejection at 48000 – 48025 and trades below 48000:
Short Trade:
Target: 47879 – 47850
Extended Drop: To 47674 – 47621 where a buying trade can be considered for a reversal move.
Trades above 48050 and takes support at 48024:
Buy Trade:
Target: 48200
Break and Sustain Above 48250: Prices may target 48419 and above 48450, prices could reach 48606.
Gap Down Opening
If BANKNIFTY opens below 47800:
Takes support at 47879 and spends time above this level:
Buy Trade:
Target: 48024 and 48180
Fails support at 47850:
Short Trade:
SL: 47900
Target: 47674 – 47621
Conclusion
Traders should be prepared for various opening scenarios and follow the appropriate trading strategies. Proper risk management through stop-loss settings and strategic profit booking is essential.
Disclaimer
This plan is intended for educational purposes only and should not be interpreted as financial advice. Trading in the stock market carries risks, and consulting with a financial advisor before making trading decisions is recommended.

Riding the Trend on CH20CHFBought as I recognised the strong moving trend of CH20CHF trending on the 6EMA discounted price zone.
Despite multiple small "sellers" selling, price continued to trend upwards, and strongly.
Currently the buyers want the CH20CHF, so I bought some too, in hopes of selling to the next Big Boy Buyer.
Both TP at 1R. It isn't exactly 1R for me in terms of dollars(SGD), its more of like 1R = 28$ +- SGD, and it is fine.
1418SGT
21052024

NIFTY Trading Plan for 22-May-2024
Overview
On 22-May-2024, NIFTY closed near the lower band of the profit booking zone (22517 – 22586) after facing rejection from the upper band. This suggests a potential retracement move. Here is a detailed trading plan based on different opening scenarios for 22-May-2024 (Wednesday).
Gap Up Opening
If NIFTY opens above 22560:
Sustains for the first hour and closes above 22560:
Buy Trade:
Target: 22701
Stop Loss (SL): 22517
Profit Booking: Book the first profit near 22700. If prices sustain or spend time above 22720, the next target is 22803.
If prices start declining after a gap up open and trade below 22500:
Short Trade:
Target: 22437 – 22400
SL: 22560
Further Drop: Below 22400, prices may drop towards 22308.
Flat Opening
If NIFTY opens flat:
Faces rejection near 22500-22517:
Short Trade:
Target: 22437 – 22400
SL: 22560
Trades higher and above 22560 during the first trading hour without breaking 22480:
Buy Trade:
Target: 22587 – 22701
SL: 22500
Gap Down Opening
If NIFTY opens below 22400:
Takes support near 22350 - 22362:
Buy Trade:
Target: 22437 and 22510
SL: 22300
Fails to support at 22300 and spends time below this level:
Short Trade:
Target: 22204
Conclusion
Traders should be vigilant of the opening scenarios and corresponding levels. Proper stop-loss settings and profit booking strategies are crucial to manage risk effectively.
Disclaimer
This plan is for educational purposes and should not be construed as financial advice. Trading in the stock market involves risks, and it is advisable to consult with a financial advisor before making trading decisions.

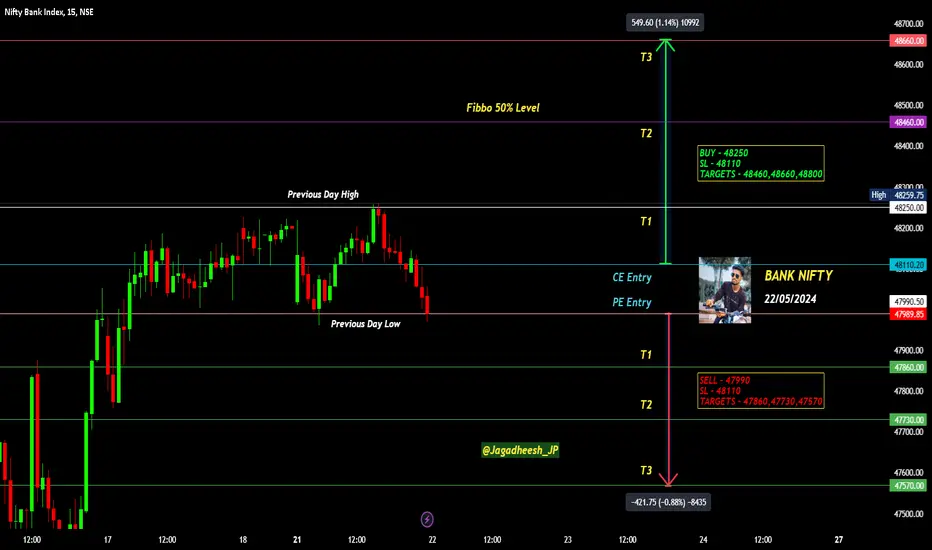
BANK NIFTY INTRADAY LEVELS FOR 22/05/2024BUY ABOVE - 48250
SL - 48110
TARGETS - 48460,48660,48800
SELL BELOW - 47990
SL - 48110
TARGETS - 47860,47730,47570
NO TRADE ZONE - 47990 to 48100
Previous Day High - 48250
Previous Day Low - 47990
Based on price action major support & resistance's are here, the red lines acts as resistances, the green lines acts as supports. If the price breaks the support/resistance, it will move to the next support/resistance line. White lines indicates previous day high & low, high acts as a resistance & low acts as a support for next day.
Trendlines are also significant to price action. If the price is above/below the trendlines, can expect an UP/DOWN with aggressive move.
Please NOTE: this levels are for intraday trading only.
Disclaimer - All information on this page is for educational purposes only,
we are not SEBI Registered, Please consult a SEBI registered financial advisor for your financial matters before investing And taking any decision. We are not responsible for any profit/loss you made.
Request your support and engagement by liking and commenting & follow to provide encouragement
HAPPY TRADING 👍