Prime-Time × Vortex (3/6/9) — Ace (clean v3)1️⃣ Prime-Time Index (PT)
A bar becomes Prime-Time when the count satisfies the formula:
4·n − 3 is a perfect square
This generates the sequence:
1, 3, 7, 13, 21, 31, 43, 57, 73, 91, …
These are time windows where price is more likely to form:
Shifts in market structure
Impulses
Reversals
Liquidity expansions
These PT bars are drawn as small circles above the candle.
If labels are enabled, the counter value (n) is also shown.
2️⃣ Vortex 3/6/9 Digital-Root Timing
Every bar also has a digital root, calculated from the counter:
If n → digitalRoot(n) = 3, 6, or 9,
the bar is considered a Vortex bar.
These moments often align with:
Swing highs / swing lows
Micro shifts
Mini-reversals
Minor liquidity grabs
When a Prime-Time bar is also a 3/6/9 bar → high-probability timing.
These bars are highlighted in green by default.
3️⃣ Filters & Display
You can customize:
Anchor time → when counting begins
Reset daily → restart counter each new trading day
Show only 3/6/9 → hides normal PT hits
Label offset → distance above the candle
Color themes
This makes the indicator usable on:
1Min
5Min
15Min
1H
Any timeframe you want
4️⃣ How To Apply It in Trading
Use it as a time confluence tool, not a signal generator.
✔ Best ways to use:
Look for MSS, sweeps, OB retests, FVG reactions when
they occur on or near a Prime-Time or 3/6/9 bar
Expect volatility increases after PT bars
Use 3/6/9 hits to anticipate internal turning points
Combine with:
Session High/Low
Killzones (London, NYO, PM)
Purge Protocol
MMXM Execution
✔ Example:
If price sweeps a level and prints a 3/6/9 vortex bar inside a PT window →
you have a very strong timing alignment for reversal.
5️⃣ Simple Summary
Feature Meaning
Prime-Time Hit (PT) Major time window where price often shifts
3/6/9 Vortex Bar Micro-timing for internal swings
PT + 3/6/9 together High-probability timing for entries
Reset Daily Perfect for intraday models like NYO & London
Anchor Time Defines the entire cycle structure
Candlestick analysis

Weekly False Breakdown ScannerWeekly False Breakdown Scanner Weekly False Breakdown ScannerWeekly False Breakdown ScannerWeekly False Breakdown ScannerWeekly False Breakdown ScannerWeekly False Breakdown ScannerWeekly False Breakdown ScannerWeekly False Breakdown ScannerWeekly False Breakdown ScannerWeekly False Breakdown ScannerWeekly False Breakdown ScannerWeekly False Breakdown ScannerWeekly False Breakdown ScannerWeekly False Breakdown ScannerWeekly False Breakdown ScannerWeekly False Breakdown ScannerWeekly False Breakdown ScannerWeekly False Breakdown ScannerWeekly False Breakdown ScannerWeekly False Breakdown ScannerWeekly False Breakdown ScannerWeekly False Breakdown ScannerWeekly False Breakdown ScannerWeekly False Breakdown ScannerWeekly False Breakdown ScannerWeekly False Breakdown ScannerWeekly False Breakdown ScannerWeekly False Breakdown ScannerWeekly False Breakdown ScannerWeekly False Breakdown ScannerWeekly False Breakdown ScannerWeekly False Breakdown ScannerWeekly False Breakdown ScannerWeekly False Breakdown ScannerWeekly False Breakdown ScannerWeekly False Breakdown ScannerWeekly False Breakdown ScannerWeekly False Breakdown ScannerWeekly False Breakdown ScannerWeekly False Breakdown ScannerWeekly False Breakdown ScannerWeekly False Breakdown ScannerWeekly False Breakdown ScannerWeekly False Breakdown ScannerWeekly False Breakdown Scanner

EMA Crossover + Angle + Candle Pattern + Breakout (Clean) finalmayank raj startegy of 9 15 ema with angle more th5 and bullish croosover or bearish crooswoveran 3

EMA Crossover + Angle + Candle Pattern + Breakout (Clean) finalmayank raj 9 15 ema strategy which will give me 1 crore

HTF FVG + SessionsThis indicator combines multi-timeframe FVG A–C detection with intraday session boxes on a single chart.
It automatically finds bullish and bearish Fair Value Gaps on 15m, 30m, 1H, 4H, 1D and 1W timeframes.
Fresh FVGs are drawn in a transparent gold color, then dynamically shrink as price trades back into the gap.
Once price fully fills the gap, the FVG box and its label are automatically removed from the chart.
After the first touch, each FVG changes to a per-timeframe gray shade, making overlapping HTF gaps easy to see.
You can toggle each timeframe on/off and also globally enable/disable all FVGs from the settings panel.
Session boxes highlight Asia, London, NY AM, NY Lunch and NY PM using soft colored rectangles.
Each session box is plotted from the high to the low of that session and labeled with its name in white text.
A global “Show all session boxes” switch allows you to quickly hide or display the session structure.
This tool is designed for traders who want to combine FVG liquidity maps with clear intraday session context.

Current Candle Vertical LineDescription
The Current Candle Vertical Line indicator draws a fully customizable vertical line on the most recent candle (live bar). This provides a clear visual anchor for active traders, especially during fast-moving markets or multi-chart setups.
The line extends from the top of the chart to the bottom, ensuring maximum visibility—regardless of zoom level or price scale.
Features
✔ Fully customizable line color
✔ Adjustable opacity (0–100%)
✔ Custom line thickness
✔ Three selectable line styles: Solid, Dashed, or Dotted
✔ Automatically deletes old line and redraws on the newest bar
✔ Works on any timeframe, chart type, and asset
Use Cases
Highlight the current candle during live trading
Keep visual focus when scalping or trading futures
Align entries with indicators on lower or higher timeframes
Improve visibility during high volatility
Support multi-monitor or multi-chart layouts
Notes
The indicator draws the line only on the last active bar.
Since overlay=true, the line appears in the main chart panel.
This script does not generate alerts (visual marker only).

Mark Minervini SEPA - Balanced
📊 MARK MINERVINI SEPA BALANCED - COMPLETE USER GUIDE
🚀 WHAT IS THIS INDICATOR?
This is a professional swing trading indicator based on Mark Minervini's famous
Trend Template strategy. It automatically identifies high-probability setups where:
✅ Long-term trend is BULLISH (confirmed by moving averages)
✅ Stock is OUTPERFORMING the market (relative strength improving)
✅ Price is CONSOLIDATING (forming a base for breakout)
✅ Volume is CONFIRMING (volume spike on breakout)
Result: CLEAR BUY SIGNALS when everything aligns! 🎯
🎨 WHAT YOU SEE ON YOUR CHART
1️⃣ FOUR MOVING AVERAGE LINES:
🟠 Orange Line (MA 20) = Short-term trend
🔵 Blue Line (MA 50) = Intermediate trend
🟢 Green Line (MA 150) = Long-term trend
🔴 Red Line (MA 200) = Very long-term trend
IDEAL: All lines stacked in order (Orange > Blue > Green > Red)
2️⃣ BACKGROUND COLOR:
🟢 GREEN background = Trend template is VALID (bullish setup ready)
🔴 RED background = Trend template is BROKEN (avoid trading)
3️⃣ DASHBOARD PANEL (Top-Right):
Real-time checklist showing:
✓ 6 core trend template rules
✓ Relative strength status
✓ VCP base quality
✓ Stage classification (S1/S2/S3/S4)
✓ Volume breakout status
4️⃣ VCP BASE BOXES (Blue Rectangles):
Shows where consolidation is happening
This is your potential entry zone
5️⃣ BUY SIGNAL LABEL (Green Text Below Candle):
Green "BUY" label appears when ALL criteria are met
This is your strongest entry signal
6️⃣ STOP LOSS LINE (Red Dashed Line):
Shows your stop loss level (base low)
📖 HOW TO USE - STEP BY STEP
STEP 1: ADD INDICATOR TO CHART
────────────────────────────────
1. Open TradingView chart
2. Click "Indicators" (top toolbar)
3. Search "Minervini SEPA Balanced"
4. Click to add to your chart
5. Use DAILY (1D) timeframe for swing trading
STEP 2: CHECK THE DASHBOARD (Top-Right Panel)
1. Look at all the checkmarks
2. Count how many are GREEN (✓)
3. Check Stage column - is it showing S2 or S1?
STEP 3: LOOK FOR SETUP PATTERNS
─────────────────────────────────
Ideal setup shows:
✓ Dashboard: 10+ criteria are GREEN
✓ Stage: S2 (green) or S1 (orange)
✓ Blue VCP box visible on chart (base forming)
✓ Moving averages aligned (50 > 150 > 200)
✓ Price above all moving averages
✓ Background is GREEN
STEP 4: WAIT FOR ENTRY SIGNAL
──────────────────────────────
Option A: BUY SIGNAL label appears
→ Green "BUY" label = ALL criteria met
→ ENTER at market price immediately
Option B: Setup looks good but no BUY label yet
→ Wait for price to break above blue VCP box
→ Volume should spike (1.3x or higher)
→ Then enter at breakout
STEP 5: PLACE YOUR TRADE
────────────────────────
📍 ENTRY: At breakout from VCP base
📍 STOP LOSS: Base low (red dashed line)
📍 TARGET: 20-30% move (typical Minervini target)
📍 HOLDING TIME: 2-4 weeks
🎯 BALANCED VERSION - WHY IT'S BETTER FOR INDIAN STOCKS
Volume Multiplier: 1.3x (NOT 1.5x)
→ Original was too strict for Indian market
→ 1.3x is realistic and catches good breakouts
→ Results: 5-10 signals per stock per year (tradeable!)
Trend Template: Core 6 rules (NOT all 8)
→ Focuses on the most important rules
→ Still maintains quality, but more flexible
→ Works better with Indian stock behavior
Stage Allowed: S1 OR S2 (NOT just S2)
→ Catches earlier moves
→ Allows you to enter sooner
→ But maintains quality with other criteria
📊 DASHBOARD INDICATORS - WHAT EACH MEANS
TREND SECTION (Core 6 Rules):
─────────────────────────────
P>200 ✓ = Price above 200-day MA (long-term uptrend)
150>200 ✓ = MA150 above MA200 (MA alignment)
200↑ ✓ = MA200 trending up (uptrend accelerating)
50>150 ✓ = MA50 above MA150 (intermediate uptrend)
50>200 ✓ = MA50 above MA200 (overall alignment)
P>50 ✓ = Price above MA50 (pullback level intact)
RS STRENGTH SECTION:
───────────────────
RS↑ ✓ = Stock outperforming NIFTY index
✗ = Stock underperforming NIFTY (avoid)
VCP BASE SECTION:
────────────────
In Base ✓ = Consolidation zone detected
✗ = No consolidation yet
Vol Dry ✓ = Volume drying up (base tightening)
✗ = Normal volume (consolidation weak)
ENTRY SECTION:
──────────────
Stage S2 = GREEN (best for swing trading)
S1 = ORANGE (acceptable, early entry)
S3 = RED (avoid - distribution phase)
S4 = RED (avoid - downtrend)
Vol Brk ✓ = Volume confirmed breakout (1.3x+ average)
✗ = Weak volume (breakout likely to fail)
❌ WHEN NOT TO TRADE
SKIP if ANY of these are true:
❌ Background is RED (trend template broken)
❌ Stage is S3 or S4 (distribution or downtrend)
❌ Vol Brk is RED (volume not confirming)
❌ RS↑ is ORANGE/RED (stock underperforming market)
❌ Blue box is NOT visible (no base forming)
❌ Base is very loose/messy (not tight enough)
❌ Moving averages are not aligned
❌ Less than 8 GREEN criteria on dashboard
⚙️ CUSTOMIZATION GUIDE
Click ⚙️ gear icon next to indicator name to adjust settings:
VOLUME MULTIPLIER (Default: 1.3)
────────────────────────────────
Current: 1.3x = BALANCED for Indian stocks ✅
Change to 1.2x = MORE signals (more false breakouts)
Change to 1.4x = FEWER signals (very selective)
Change to 1.5x = ORIGINAL (too strict, rarely triggers)
RS BENCHMARK (Default: NSE:NIFTY)
─────────────────────────────────
Current: NSE:NIFTY = Large-cap stocks
Change to NSE:NIFTY500 = Mid-cap stocks
Change to NSE:NIFTYNXT50 = Small-cap stocks
MINIMUM BASE DAYS (Default: 20)
───────────────────────────────
Current: 20 days = 4 weeks consolidation ✅
Change to 15 = Shorter bases (more frequent signals)
Change to 25 = Longer bases (higher quality)
ATR% FOR TIGHTNESS (Default: 1.5)
──────────────────────────────────
Current: 1.5% = BALANCED ✅
Change to 1.0% = ONLY very tight bases
Change to 2.0% = Loose bases accepted
📈 REAL TRADING EXAMPLE
SCENARIO: Trading RELIANCE over 4 weeks
WEEK 1: Base Starts Forming
────────────────────────────
- Price consolidating around ₹1,500
- Dashboard: 5/14 criteria green
- Action: MONITOR (not ready yet)
WEEK 2: Base Tightens
─────────────────────
- Price still ₹1,500 (no movement)
- VCP box appearing on chart
- Dashboard: 8/14 criteria green
- Vol Dry: ✓ (volume shrinking - good!)
- Action: MONITOR (almost ready)
WEEK 3: Perfect Setup Formed
──────────────────────────────
- Base still ₹1,500
- Dashboard: 12/14 criteria GREEN ✓✓✓
- Stage: S2 ✓
- Blue box tight and clean
- Action: WAIT FOR BREAKOUT
WEEK 4: Breakout Happens!
──────────────────────────
- Price closes at ₹1,550 (breakout!)
- Volume: 1.6x average (exceeds 1.3x requirement)
- Dashboard: BUY SIGNAL ✓ (all criteria met)
- Action: ENTER TRADE
Entry: ₹1,550
Stop: ₹1,480 (base low)
Target: ₹1,850 (20% move)
RESULT: +19.4% profit in 2 weeks! ✅
💡 PRO TIPS FOR BEST RESULTS
1. USE DAILY (1D) CHARTS ONLY
Weekly charts = Fewer signals, slower moves
Daily charts = Best for swing trading ✅
Intraday charts = Too many false signals
2. SCAN MULTIPLE STOCKS
Don't just watch 1 stock
Scan 50-100 stocks daily
More stocks = More opportunities
3. WAIT FOR PERFECT ALIGNMENT
Don't enter on 8/14 criteria
Wait for 12+/14 criteria
This increases win rate significantly
4. VOLUME IS CRITICAL
Always check Vol Brk column
No volume = Likely to fail
1.3x+ volume = Good breakout
5. COMBINE WITH YOUR OWN ANALYSIS
Indicator gives technical signals
You add your own fundamental view
Strong fundamental + technical = Best trade
6. BACKTEST ON HISTORICAL DATA
Use TradingView Replay feature
Go back 6-12 months
See how many signals appeared
Verify which were profitable
7. KEEP A TRADING JOURNAL
Track entry, exit, profit/loss
Note what worked and what didn't
Continuous improvement!
⚠️ IMPORTANT DISCLAIMERS
✓ This indicator is for educational purposes only
✓ Past performance does not guarantee future results
✓ Always use proper risk management (position sizing, stop loss)
✓ Never risk more than 2% of your account on one trade
✓ Backtest thoroughly before using with real money
✓ The indicator provides technical signals, not investment advice
✓ Losses can occur - trade at your own risk
🎯 QUICK START CHECKLIST
Before entering ANY trade, verify:
□ Dashboard shows mostly GREEN (10+ criteria)
□ Stage = S2 (green) or S1 (orange)
□ Blue VCP box visible on chart
□ Price just broke above the box
□ Volume is high (1.3x+ average, Vol Brk = ✓)
□ Moving averages aligned (50 > 150 > 200)
□ RS is uptrending (RS↑ = ✓)
□ BUY SIGNAL label appeared (optional but strong confirmation)
ALL CHECKED? → READY TO BUY! 🚀
📞 FOR HELP & SUPPORT
Questions about the indicator?
→ Check the dashboard - each criterion has a specific meaning
→ Review this guide - answers most common questions
→ Backtest on historical data using TradingView Replay
→ Start with paper trading (no real money) first
🎓 LEARNING RESOURCES
To understand Mark Minervini's method better:
→ Read: "Trade Like a Stock Market Wizard" by Mark Minervini
→ Watch: TradingView educational videos on trend templates
→ Practice: Backtest this indicator on 6-12 months of historical data
→ Learn: Study successful traders who use similar strategies
GOOD LUCK WITH YOUR TRADING! 🚀📈
May your trends be bullish and your breakouts be explosive! 🎯

Superior-Range Bound Renko - Alerts - 11-29-25 - Signal LynxSuperior-Range Bound Renko – Alerts Edition with Advanced Risk Management Template
Signal Lynx | Free Scripts supporting Automation for the Night-Shift Nation 🌙
1. Overview
This is the Alerts & Indicator Edition of Superior-Range Bound Renko (RBR).
The Strategy version is built for backtesting inside TradingView.
This Alerts version is built for automation: it emits clean, discrete alert events that you can route into webhooks, bots, or relay engines (including your own Signal Lynx-style infrastructure).
Under the hood, this script contains the same core engine as the strategy:
Adaptive Range Bounding based on volatility
Renko Brick Emulation on standard candles
A stack of Laguerre Filters for impulse detection
K-Means-style Adaptive SuperTrend for trend confirmation
The full Signal Lynx Risk Management Engine (state machine, layered exits, AATS, RSIS, etc.)
The difference is in what we output:
Instead of placing historical trades, this version:
Plots the entry and RM signals in a separate pane (overlay = false)
Exposes alertconditions for:
Long Entry
Short Entry
Close Long
Close Short
TP1, TP2, TP3 hits (Staged Take Profit)
This makes it ideal as the signal source for automated execution via TradingView Alerts + Webhooks.
2. Quick Action Guide (TL;DR)
Best Timeframe:
4H and above. This is a swing-trading / position-trading style engine, not a micro-scalper.
Best Assets:
Volatile but structured markets, e.g.:
BTC, ETH, XAUUSD (Gold), GBPJPY, and similar high-volatility majors or indices.
Script Type:
indicator() – Alerts & Visualization Only
No built-in order placement
All “orders” are emitted as alerts for your external bot or manual handling
Strategy Type:
Volatility-Adaptive Trend Following + Impulse Detection
using Renko-like structure and multi-layer Laguerre filters.
Repainting:
Designed to be non-repainting on closed candles.
The underlying Risk Management engine is built around previous-bar data (close , high , low ) for execution-critical logic.
Intrabar values can move while the bar is forming (normal for any advanced signal), but once a bar closes, the alert logic is stable.
Recommended Alert Settings:
Condition: one of the built-in signals (see section 3.B)
Options: “Once Per Bar Close” is strongly recommended for automation
Message: JSON, CSV, or simple tokens – whatever your webhook / relay expects
3. Detailed Report: How the Alerts Edition Works
A. Relationship to the Strategy Version
The Alerts Edition shares the same internal logic as the strategy version:
Same Adaptive Lookback and volatility normalization
Same Range and Close Range construction
Same Renko Brick Emulator and directional memory (renkoDir)
Same Fib structures, Laguerre stack, K-Means SuperTrend, and Baseline signals (B1, B2)
Same Risk Management Engine and layered exits
In the strategy script, these signals are wired into strategy.entry, strategy.exit, and strategy.close.
In the alerts script:
We still compute the final entry/exit signals (Fin, CloseEmAll, TakeProfit1Plot, etc.)
Instead of placing trades, we:
Plot them for visual inspection
Expose them via alertcondition(...) so that TradingView can fire alerts.
This ensures that:
If you use the same settings on the same symbol/timeframe, the Alerts Edition and Strategy Edition agree on where entries and exits occur.
(Subject only to normal intrabar vs. bar-close differences.)
B. Signals & Alert Conditions
The alerts script focuses on discrete, automation-friendly events.
Internally, the main signals are:
Fin – Final entry decision from the RM engine
CloseEmAll – RM-driven “hard close” signal (for full-position exits)
TakeProfit1Plot / 2Plot / 3Plot – One-time event markers when each TP stage is hit
On the chart (in the separate indicator pane), you get:
plot(Fin) – where:
+2 = Long Entry event
-2 = Short Entry event
plot(CloseEmAll) – where:
+1 = “Close Long” event
-1 = “Close Short” event
plot(TP1/TP2/TP3) (if Staged TP is enabled) – integer tags for TP hits:
+1 / +2 / +3 = TP1 / TP2 / TP3 for Longs
-1 / -2 / -3 = TP1 / TP2 / TP3 for Shorts
The corresponding alertconditions are:
Long Entry
alertcondition(Fin == 2, title="Long Entry", message="Long Entry Triggered")
Fire this to open/scale a long position in your bot.
Short Entry
alertcondition(Fin == -2, title="Short Entry", message="Short Entry Triggered")
Fire this to open/scale a short position.
Close Long
alertcondition(CloseEmAll == 1, title="Close Long", message="Close Long Triggered")
Fire this to fully exit a long position.
Close Short
alertcondition(CloseEmAll == -1, title="Close Short", message="Close Short Triggered")
Fire this to fully exit a short position.
TP 1 Hit
alertcondition(TakeProfit1Plot != 0, title="TP 1 Hit", message="TP 1 Level Reached")
First staged take profit hit (either long or short). Your bot can interpret the direction based on position state or message tags.
TP 2 Hit
alertcondition(TakeProfit2Plot != 0, title="TP 2 Hit", message="TP 2 Level Reached")
TP 3 Hit
alertcondition(TakeProfit3Plot != 0, title="TP 3 Hit", message="TP 3 Level Reached")
Together, these give you a complete trade lifecycle:
Open Long / Short
Optionally scale out via TP1/TP2/TP3
Close remaining via Close Long / Close Short
All while the Risk Management Engine enforces the same logic as the strategy version.
C. Using This Script for Automation
This Alerts Edition is designed for:
Webhook-based bots
Execution relays (e.g., your own Lynx-Relay-style engine)
Dedicated external trade managers
Typical setup flow:
Add the script to your chart
Same symbol, timeframe, and settings you use in the Strategy Edition backtests.
Configure Inputs:
Longs / Shorts enabled
Risk Management toggles (SL, TS, Staged TP, AATS, RSIS)
Weekend filter (if you do not want weekend trades)
RBR-specific knobs (Adaptive Lookback, Brick type, ATR vs Standard Brick, etc.)
Create Alerts for Each Event Type You Need:
Long Entry
Short Entry
Close Long
Close Short
TP1 / TP2 / TP3 (optional, if your bot handles partial closes)
For each:
Condition: the corresponding alertcondition
Option: “Once Per Bar Close” is strongly recommended
Message:
You can use structured JSON or a simple token set like:
{"side":"long","event":"entry","symbol":"{{ticker}}","time":"{{timenow}}"}
or a simpler text for manual trading like:
LONG ENTRY | {{ticker}} | {{interval}}
Wire Up Your Bot / Relay:
Point TradingView’s webhook URL to your execution engine
Parse the messages and map them into:
Exchange
Symbol
Side (long/short)
Action (open/close/partial)
Size and risk model (this script does not position-size for you; it only signals when, not how much.)
Because the alerts come from a non-repainting, RM-backed engine that you’ve already validated via the Strategy Edition, you get a much cleaner automation pipeline.
D. Repainting Protection (Alerts Edition)
The same protections as the Strategy Edition apply here:
Execution-critical logic (trailing stop, TP triggers, SL, RM state changes) uses previous bar OHLC:
open , high , low , close
No security() with lookahead or future-bar dependencies.
This means:
Alerts are designed to fire on states that would have been visible at bar close, not on hypothetical “future history.”
Important practical note:
Intrabar: While a bar is forming, internal conditions can oscillate.
Bar Close: With “Once Per Bar Close” alerts, the fired signal corresponds to the final state of the engine for that candle, matching your Strategy Edition expectations.
4. For Developers & Modders
You can treat this Alerts script as an ”RM + Alert Framework” and inject any signal logic you want.
Where to plug in:
Find the section:
// BASELINE & SIGNAL GENERATION
You’ll see how B1 and B2 are built from the RBR stack and then combined:
baseSig = B2
altSig = B1
finalSig = sigSwap ? baseSig : altSig
To use your own logic:
Replace or wrap the code that sets baseSig / altSig with your own conditions:
e.g., RSI, MACD, Heikin Ashi filters, candle patterns, volume filters, etc.
Make sure your final decision is still:
2 → Long / Buy signal
-2 → Short / Sell signal
0 → No trade
finalSig is then passed into the RM engine and eventually becomes Fin, which:
Drives the Long/Short Entry alerts
Interacts with the RM state machine to integrate properly with AATS, SL, TS, TP, etc.
Because this script already exposes alertconditions for key lifecycle events, you don’t need to re-wire alerts each time — just ensure your logic feeds into finalSig correctly.
This lets you use the Signal Lynx Risk Management Engine + Alerts wrapper as a drop-in chassis for your own strategies.
5. About Signal Lynx
Automation for the Night-Shift Nation 🌙
Signal Lynx builds tools and templates that help traders move from:
“I have an indicator” → “I have a structured, automatable strategy with real risk management.”
This Superior-Range Bound Renko – Alerts Edition is the automation-focused companion to the Strategy Edition. It’s designed for:
Traders who backtest with the Strategy version
Then deploy live signals with this Alerts version via webhooks or bots
While relying on the same non-repainting, RM-driven logic
We release this code under the Mozilla Public License 2.0 (MPL-2.0) to support the Pine community with:
Transparent, inspectable logic
A reusable Risk Management template
A reference implementation of advanced adaptive logic + alerts
If you are exploring full-stack automation (TradingView → Webhooks → Exchange / VPS), keep Signal Lynx in your search.
License: Mozilla Public License 2.0 (Open Source).
If you build improvements or helpful variants, please consider sharing them back with the community.

MA200 Deviation Percentile200-Day MA Deviation with Dynamic Thresholds
OVERVIEW
This indicator measures price deviation from the 200-day moving average as a percentage, with dynamically calculated overbought/oversold thresholds based on historical percentiles.
Best suited for broad market indices (SPY, QQQ, IWM, etc.) where the 200-day MA serves as a reliable long-term trend indicator. Individual stocks may exhibit more erratic behavior around this level.
CALCULATION
Deviation (%) = (Close - 200MA) / 200MA x 100
Dynamic thresholds are derived from actual historical distribution rather than assuming normal distribution:
- Overbought threshold = 97.5th percentile of historical deviations
- Oversold threshold = 2.5th percentile of historical deviations
SETTINGS
MA Length (default: 200)
Moving average period.
Lookback Period (default: 1260)
Historical window for threshold calculation. 1260 bars approximates 5 years of daily data.
Threshold Percentile (default: 5%)
Two-tailed threshold. 5% places overbought/oversold boundaries at the 97.5th and 2.5th percentiles respectively.
INTERPRETATION
Deviation Value
- Positive: Price trading above 200MA
- Negative: Price trading below 200MA
- Magnitude indicates extent of deviation
Percentile Ranking (0-100%)
- Shows where current deviation ranks historically
- Above 90%: Historically elevated
- Below 10%: Historically depressed
Dynamic Threshold Lines
- Red line: Upper boundary based on historical distribution
- Green line: Lower boundary based on historical distribution
- These adapt automatically to each asset's volatility characteristics
APPLICATION
Mean Reversion
Extreme deviations tend to normalize over time. When deviation exceeds dynamic thresholds, probability of mean reversion increases.
Trend Assessment
Sustained positive/negative deviation confirms trend direction. Zero-line crossovers may signal trend changes.
NOTES
- Optimized for daily timeframe on market indices
- Requires sufficient historical data (minimum equal to lookback period)
- Extreme readings do not guarantee immediate reversals
- Use in conjunction with other analysis methods

DAILY - 3-Condition Arrows - Buy & SellVersion 1.
On the DAILY time frame, this indicator will add a green BUY arrow to a stock price when the following 3 conditions are ALL true:
BUY (all 3 conditions are true)
1. Stock price > 50 EMA
2. MACD line above moving average
3. Williams %R (Best_Solve version) is above moving average
Conversely, a red SELL arrow will point out when the following 3 conditions are ALL true:
SELL (all 3 conditions are true)
1. Stock price < 50 EMA
2. MACD line below moving average
3. Williams %R (Best_Solve version) is below the moving average

new_youtube_strategy//@version=5
strategy("Dow + Homma 1m Scalper (15m filter)", overlay=true, margin_long=100, margin_short=100, initial_capital=10000)
//===== INPUTS =====
maLen = input.int(50, "Trend SMA Length", minval=5)
htf_tf = input.timeframe("15", "Higher TF")
priceTolPct = input.float(0.05, "SR tolerance %", step=0.01)
wickFactor = input.float(2.0, "Hammer/ShootingStar wick factor", step=0.1)
dojiThresh = input.float(0.1, "Doji body % of range", step=0.01)
risk_RR = input.float(2.0, "Reward:Risk", step=0.1)
capitalRiskPct = input.float(1.0, "Risk % of equity per trade", step=0.1)
//===== 1m TREND (SMA) =====
sma1 = ta.sma(close, maLen)
sma1Up = sma1 > sma1
sma1Down = sma1 < sma1
uptrend1 = close > sma1 and sma1Up
downtrend1 = close < sma1 and sma1Down
//===== 15m TREND VIA request.security =====
sma15 = request.security(syminfo.tickerid, htf_tf, ta.sma(close, maLen), lookahead=barmerge.lookahead_off)
sma15Up = sma15 > sma15
sma15Down = sma15 < sma15
uptrend15 = close > sma15 and sma15Up
downtrend15 = close < sma15 and sma15Down
//===== SWING HIGHS/LOWS (LOCAL EXTREMA) =====
var int left = 3
var int right = 3
swHigh = ta.pivothigh(high, left, right)
swLow = ta.pivotlow(low, left, right)
//===== SR FLIP LEVELS =====
var float srSupport = na
var float srResistance = na
// when a swing high is broken -> new support
if not na(swHigh)
if close > swHigh
srSupport := swHigh
// when a swing low is broken -> new resistance
if not na(swLow)
if close < swLow
srResistance := swLow
//===== CANDLE METRICS =====
body = math.abs(close - open)
cRange = high - low
upperW = high - math.max(open, close)
lowerW = math.min(open, close) - low
isBull() => close > open
isBear() => close < open
bullHammer() =>
cRange > 0 and
isBull() and
lowerW >= wickFactor * body and
upperW <= body
bearShootingStar() =>
cRange > 0 and
isBear() and
upperW >= wickFactor * body and
lowerW <= body
isDoji() =>
cRange > 0 and body <= dojiThresh * cRange
bullEngulfing() =>
isBear() and isBull() and
open <= close and close >= open
bearEngulfing() =>
isBull() and isBear() and
open >= close and close <= open
//===== SR PROXIMITY =====
tol = priceTolPct * 0.01 * close
nearSupport = not na(srSupport) and math.abs(close - srSupport) <= tol
nearResistance = not na(srResistance) and math.abs(close - srResistance) <= tol
//===== SIGNAL CONDITIONS =====
bullCandle = bullHammer() or isDoji() or bullEngulfing()
bearCandle = bearShootingStar() or isDoji() or bearEngulfing()
longTrendOK = uptrend1 and uptrend15
shortTrendOK = downtrend1 and downtrend15
longSignal = longTrendOK and nearSupport and bullCandle
shortSignal = shortTrendOK and nearResistance and bearCandle
//===== POSITION SIZING (IN RISK UNITS) =====
var float lastEquity = strategy.equity
riskCapital = strategy.equity * (capitalRiskPct * 0.01)
//===== ENTRY / EXIT PRICES =====
longStop = math.min(low, nz(srSupport, low))
longRisk = close - longStop
longTP = close + risk_RR * longRisk
shortStop = math.max(high, nz(srResistance, high))
shortRisk = shortStop - close
shortTP = close - risk_RR * shortRisk
// qty in contracts (approx; assumes price * qty ≈ capital used)
longQty = longRisk > 0 ? riskCapital / longRisk : 0.0
shortQty = shortRisk > 0 ? riskCapital / shortRisk : 0.0
//===== EXECUTION =====
if longSignal and longRisk > 0 and longQty > 0
strategy.entry("Long", strategy.long, qty=longQty)
strategy.exit("Long TP/SL", from_entry="Long", stop=longStop, limit=longTP)
if shortSignal and shortRisk > 0 and shortQty > 0
strategy.entry("Short", strategy.short, qty=shortQty)
strategy.exit("Short TP/SL", from_entry="Short", stop=shortStop, limit=shortTP)
//===== PLOTS =====
plot(sma1, color=color.orange, title="SMA 1m")
plot(sma15, color=color.blue, title="HTF SMA (15m)")
plot(srSupport, "SR Support", color=color.new(color.green, 50), style=plot.style_linebr)
plot(srResistance,"SR Resistance",color=color.new(color.red, 50), style=plot.style_linebr)
// Visual debug for signals
plotshape(longSignal, title="Long Signal", style=shape.triangleup, location=location.belowbar, color=color.lime, size=size.tiny)
plotshape(shortSignal, title="Short Signal", style=shape.triangledown, location=location.abovebar, color=color.red, size=size.tiny)

WEEKLY - 3-Condition Arrows - Buy & SellVersion 1.
On the WEEKLY time frame, this indicator will add a green BUY arrow to a stock price when the following 3 conditions are ALL true:
BUY (all 3 conditions are true)
1. Stock price > 50 EMA
2. MACD line above moving average
3. Williams %R (Best_Solve version) is above moving average
Conversely, a red SELL arrow will point out when the following 3 conditions are ALL true:
SELL (all 3 conditions are true)
1. Stock price < 50 EMA
2. MACD line below moving average
3. Williams %R (Best_Solve version) is below the moving average

均线变色K线系统 with 转折箭头//@version=6
indicator("均线变色K线系统 with 转折箭头", overlay=true, max_lines_count=500, max_labels_count=200)
// 输入参数
ma_length = input.int(20, title="均线周期", minval=1)
atr_filter = input.bool(true, title="启用ATR波动过滤")
atr_length = input.int(14, title="ATR周期", minval=1)
atr_multiplier = input.float(1.5, title="ATR波动阈值", minval=0.1, step=0.1)
show_arrows = input.bool(true, title="显示转折箭头")
candle_coloring = input.bool(true, title="启用K线变色")
// 计算均线和ATR
ma = ta.sma(close, ma_length)
atr_value = ta.atr(atr_length)
avg_atr = ta.sma(atr_value, atr_length)
// 判断均线方向和趋势转折点
ma_rising = ta.rising(ma, 1)
ma_falling = ta.falling(ma, 1)
// 使用更严格的趋势转折检测(避免repainting)
ma_rising_prev = ta.rising(ma, 2)
ma_falling_prev = ta.falling(ma, 2)
// 检测趋势转折点(确保只在K线收盘确认时检测)
trend_change_up = ma_rising and not ma_rising_prev and (not atr_filter or atr_value >= avg_atr * atr_multiplier)
trend_change_down = ma_falling and not ma_falling_prev and (not atr_filter or atr_value >= avg_atr * atr_multiplier)
// 设置颜色
ma_color = ma_rising ? color.rgb(255, 0, 0) : color.rgb(0, 0, 255) // 红/蓝
candle_color = ma_rising ? color.rgb(255, 0, 0) : color.rgb(0, 0, 255)
border_color = ma_rising ? color.rgb(255, 0, 0) : color.rgb(0, 0, 255)
wick_color = ma_rising ? color.rgb(255, 0, 0) : color.rgb(0, 0, 255)
// 绘制彩色均线
plot(ma, color=ma_color, linewidth=2, title="变色均线")
// 使用plotcandle绘制彩色K线
plotcandle(candle_coloring ? open : na,
candle_coloring ? high : na,
candle_coloring ? low : na,
candle_coloring ? close : na,
title="变色K线",
color = candle_color,
wickcolor = wick_color,
bordercolor = border_color,
editable = true)
// 绘制趋势转折箭头(只在K线确认时显示)
if show_arrows and barstate.isconfirmed
if trend_change_up
label.new(bar_index, low * 0.998, "▲",
color=color.rgb(0, 255, 0),
textcolor=color.white,
style=label.style_label_up,
yloc=yloc.price,
size=size.normal)
else if trend_change_down
label.new(bar_index, high * 1.002, "▼",
color=color.rgb(255, 0, 0),
textcolor=color.white,
style=label.style_label_down,
yloc=yloc.price,
size=size.normal)
// 背景色轻微提示(可选)
bgcolor(ma_rising ? color.new(color.red, 95) : color.new(color.blue, 95), title="趋势背景提示")

ADX Breakout Enhanced Signal🥋 Trading Dojo – ADX Breakout Enhanced Signal
This indicator combines the trend-strength power of the ADX with dynamic breakout-based signals, designed for traders who want more frequent and higher-probability entries on timeframes like 1 hour.
The core logic focuses on:
📌 1. Trend Strength Detection with ADX
The indicator evaluates whether the market is showing a strong directional trend using an optimized ADX.
When ADX rises above the configured threshold, the system interprets that price has enough momentum to validate an entry.
📌 2. Breakout Entry Logic
It identifies points where price breaks recent highs or lows, confirming the start or continuation of movement.
This breakout-based approach produces more entries than traditional ADX strategies alone.
📌 3. Clear and Simple Signals
🟩 Long when price breaks a recent high with strong trend confirmation.
🟥 Short when price breaks a recent low with strong trend confirmation.
📌 4. Built-In Automated Alerts
The indicator automatically generates JSON alerts ready for use with automation tools such as trading bots, webhooks, BingX, 3Commas, Discord bots, and more.
🎯 Purpose of the Indicator
To provide more frequent, well-distributed, and momentum-validated entries, while maintaining simplicity and speed — perfect for real-time decision-making.
Perfect For:
Intraday trading
1h, 30m, and 15m timeframes
Breakout-based strategies
Automated trading systems

Harris Triple Impulse Candle Detector Triple impulse candle detector system. Indicator uses size multiplier, volume multiplier and body to mick ratio, to calculate the size of its impulse

50, 100 & 200 Week MA (SMA/EMA Switch)Clean, multi-timeframe weekly moving average indicator displaying the classic 50, 100, and 200-week MAs directly on any chart timeframe.
Features:
True weekly calculations using request.security (accurate, no daily approximation)
Switch between SMA and EMA with one click
Individually toggle each MA (50w orange, 100w purple, 200w blue)
Perfect for long-term trend analysis, golden/death crosses, and institutional-level support/resistance
Ideal for swing traders, investors, and anyone tracking major market cycles. Lightweight and repaints-free.

TheStrat: Timeframe Continuity Failed 2This indicator highlights TheStrat Failed 2 reversals only when the market is in Full Time Frame Continuity (FTFC) based on your chosen timeframes.
It is designed for high-probability directional trades with strong trend confirmation.
⸻
What It Detects
Failed 2 (Reversal Setup)
A Failed 2 occurs when price breaks one side of the previous candle, then fails and closes in the opposite direction:
• Failed 2D → Bullish reversal
• Failed 2U → Bearish reversal
This produces trapped breakout traders, often leading to explosive continuation.
FTFC measures whether price is above or below the opening price of higher timeframes.
If selected timeframes are all aligned, trend conviction is strong.
You can toggle ON/OFF each timeframe to define FTFC:
• 1H
• 1D
• 1W
• 1M
• 1Q
• 1Y
Only the timeframes you select must agree.
⸻
Modes for Different Styles
This indicator supports different trading horizons.
Swing Mode (Recommended for Options 1–5 Days Out)
Focus: Fast multi-day trend continuation
Ideal holding: 1–5 days
Best for: Weekly option expirations
Enable:
• 1H → Entry trigger timeframe
• 1D → Short-term direction
• 1W → Swing trend
• 1M → Macro push behind the move
• Q / Y not required
You end up catching the 1H reversal ignition, with Daily/Weekly/Monthly backing it.
Great for:
• Tuesday–Thursday continuation plays
• Multi-day directional runs
• “Ride the weekly magnitude”
Macro Mode (Long-Term Trend Filter)
Focus: Broad market bias
Ideal holding: weeks to months
Best for: Equity swing traders, leaps, ETF positioning
Enable:
• 1W
• 1M
• 1Q
• 1Y
• 1H / 1D not required
Used to ensure you’re riding institutional trend, not counter-trend noise.
Can be paired with a lower-TF entry tool like this indicator running in Swing Mode.
Label Up “F2D FTFC↑!” —— Bullish Failed-2 triggers FTFC → long setup
Label Down “F2U FTFC↓!” —— Bearish Failed-2 triggers FTFC → short setup
Small Circles —— Failed-2 continuation while FTFC remains intact
Optional Intrabar Alerts when price begins to form a Failed-2.
All plotted entries are close-confirmed unless you enable intrabar alerts.

Every Hour 1st/Last FVG vTDL OVERVIEW - Shoutout to Micheal J. Huddleston aka ICT
This indicator identifies the first Fair Value Gap (FVG) that forms within each trading hour, providing traders with potential entry zones, reversal points, and unmitigated gap targets. Based on the concept that the first presented FVG of each hour represents a significant price delivery array where institutional order flow occurred.
The indicator detects FVGs on a lower timeframe (1-minute default) and displays them as boxes on your chart, tracking which gaps get filled and which remain open as potential draw-on-liquidity targets.
WHAT IS A FAIR VALUE GAP
A Fair Value Gap is a 3-candle price pattern representing an imbalance between buyers and sellers:
Bullish FVG: Forms when candle 3's low is above candle 1's high, leaving a gap
Bearish FVG: Forms when candle 3's high is below candle 1's low, leaving a gap
These gaps often act as magnets for price, which tends to return and "fill" the imbalance before continuing. They function as dynamic support and resistance zones.
KEY FEATURES
Detection Types
FVG: Standard fair value gap detection with volume imbalance expansion
Suspension FVG Blocks: Requires outside prints on both sides for more refined signals
Hourly Display Modes
First Only: Shows whichever FVG appears first each hour (bullish or bearish)
Show Both: Shows first bullish AND first bearish FVG independently each hour
Last FVG Tracking
Optionally display the last FVG of each hour
Useful for comparing how the hour developed
Can extend into the next hour for continued tracking
Breakaway Gap Detection
Gaps not traded into during their formation hour extend forward
Extended gaps display labels showing formation time and date
These unmitigated gaps become price targets and reversal zones
Gap Fill Modes
Touch Box: Marks filled when price enters the gap
Touch Midpoint: Marks filled when price reaches the 50 percent level
Fill Completely: Marks filled when price fills the entire gap with visual progress
HOW TO USE
Entry Points
The first FVG of each hour provides potential entry zones based on price reaction:
When price returns to an FVG and shows rejection, enter in the direction of rejection
The gap zone represents where institutional orders likely reside
Use the boundaries of the gap for stop loss placement
A clean rejection of the zone confirms it as valid support or resistance
Reversal Points
Unmitigated gaps that extend beyond their formation hour are high-probability reaction zones:
Extended boxes with labels indicate unfilled gaps
When price finally reaches these zones, expect a reaction
The longer a gap remains unfilled, the stronger the expected response
These zones act as magnets drawing price back to them
Price Targets
Use unmitigated gaps as draw-on-liquidity targets:
Look for extended boxes above or below current price
Price tends to seek out and fill imbalances
The midpoint line often serves as a minimum target
Multiple unfilled gaps in one direction suggest strong momentum potential
FRAMING DIRECTIONAL BIAS
The first presented FVG of each hour acts as a support or resistance zone. The direction of the FVG itself does not determine bias - it is how price reacts to that FVG that reveals the true market intention.
Reading Price Reaction
Price respects a bullish FVG as support and bounces higher = bullish bias confirmed
Price respects a bearish FVG as resistance and rejects lower = bearish bias confirmed
Price fails to hold a bullish FVG and breaks through = potential inversion, look for shorts
Price fails to hold a bearish FVG and breaks through = potential inversion, look for longs
Inversion Fair Value Gaps (IFVG)
When price trades through an FVG and closes beyond it, that gap can invert its role:
A bullish FVG that fails becomes resistance - use it as a short entry zone
A bearish FVG that fails becomes support - use it as a long entry zone
The inversion signals a shift in control from one side to the other
Watch for price to retest the inverted gap before continuing
Support and Resistance Framework
Think of each hourly first FVG as a key level:
Price above the FVG: the gap acts as potential support
Price below the FVG: the gap acts as potential resistance
Watch how price behaves when it returns to the gap zone
A clean rejection confirms the level; a break through signals inversion
SHORT-TERM SCALPING APPLICATION
These FVGs provide scalping opportunities each hour:
Identify the first FVG of the hour as your key level
Wait for price to trade away from it and return
Observe the reaction at the gap zone
Enter in the direction of the reaction with tight risk
Target the next FVG, midpoint, or nearby liquidity
Trade Management
Use the opposite side of the FVG box as your stop loss zone
The midpoint of the gap often provides first target or decision point
Scale out at nearby unmitigated gaps or key levels
If the gap inverts, flip your bias and look for entries in the new direction
MULTI-HOUR CONTEXT
If price consistently respects FVGs as support across hours = uptrend context
If price consistently respects FVGs as resistance across hours = downtrend context
If FVGs keep inverting = choppy or transitional market
Use higher timeframe direction to filter which reactions to trade
Compare first and last FVG of each hour to see how momentum developed
SESSION FILTERING
The indicator automatically excludes unreliable periods:
4 PM to 5 PM New York time (market close hours 16-17)
Weekend closed periods (Saturday and Sunday before 6 PM)
All timestamps use New York timezone for consistency with futures market hours.
SETTINGS GUIDE
Detection Settings
Detection Type: Choose between standard FVG or Suspension FVG Blocks
Lower Timeframe: 15 seconds, 1 minute, or 5 minutes for gap detection
Min FVG Size: Minimum gap size in ticks to filter noise
Display Settings
Hourly Display Mode: First Only shows one gap per hour; Show Both shows first bull and bear
Show First FVG: Toggle visibility of first FVG boxes
Show Last FVG: Toggle visibility of last FVG boxes
Show Midpoint Lines: Display the 50 percent level of each gap
Show Unfilled Breakaway Gaps: Extend boxes until price fills them
Show Only Today: Reduce clutter by hiding older hourly boxes
Gap Fill Detection Mode
Touch Box: Gap marked filled when price enters the zone
Touch Midpoint: Gap marked filled when price reaches 50 percent level
Fill Completely: Gap marked filled only when fully closed, shows visual fill progress
Recommended Settings by Style
Scalping: 1 minute LTF, 4 tick minimum, Show Both mode, Touch Box fill
Day Trading: 1 minute LTF, 4-8 tick minimum, First Only mode, Touch Midpoint fill
Swing Context: 5 minute LTF, Show Unfilled Gaps enabled, Fill Completely mode
COLOR CODING
Blue boxes: First bullish FVG of the hour
Red boxes: First bearish FVG of the hour
Green boxes: Last bullish FVG of the hour
Orange boxes: Last bearish FVG of the hour
Black midpoint lines: 50 percent level of each gap
Filled portion overlay: Shows visual progress in Fill Completely mode
All colors are fully customizable in the settings menu.
PRACTICAL TIPS
The first FVG of each hour is a hidden PD array - treat it as a significant level
Not every gap produces a tradeable reaction - wait for confirmation
Gaps that remain unfilled for multiple hours carry more weight
Use the Show Both mode to see both bullish and bearish opportunities each hour
When multiple gaps cluster in one zone, that area becomes even more significant
Inversions are powerful signals - a failed level often leads to acceleration
NOTES
Works on any instrument and timeframe
Best used on intraday charts (1 minute to 15 minute) viewing 1 minute LTF gaps
Combine with higher timeframe analysis for confluence
These are probability zones, not guarantees - always use proper risk management
The indicator handles HTF to LTF data fetching automatically

Candlestick PatternsWhat It Does:
Automatically identifies and displays:
🟢 16+ Bullish patterns (Hammer, Engulfing ↑, Morning Star, etc.)
🔴 Bearish patterns (Shooting Star, Engulfing ↓, Evening Star, etc.)
🔵 Break & Retest signals (70-80% win rate setups)
⚪ Neutral patterns (Doji, Spinning Top - indecision)
🎯 Automatic alerts for all major patterns
Purpose: Shows you exactly when reversals are likely and identifies the highest-probability entry points (Break & Retest).Key Patterns:Bullish (Green labels above/below):
HAMMER - Long lower wick, small body (reversal from bottom)
ENGULF ↑ - Big green candle swallows previous red (strong reversal)
MORNING★ - Three candles: red, doji, green (major bottom)
3 BULLS - Three consecutive green candles (strong momentum)
PIERCE - Green closes above 50% of previous red
RETEST ↑ (BEST!) - Price broke resistance, pulled back, bounced (cyan circle)
Bearish (Red labels above/below):
SHOOT★ - Long upper wick, small body (reversal from top)
ENGULF ↓ - Big red candle swallows previous green (strong reversal)
EVENING★ - Three candles: green, doji, red (major top)
3 BEARS - Three consecutive red candles (strong momentum)
DARK☁ - Red closes below 50% of previous green
RETEST ↓ (BEST!) - Price broke support, bounced back, rejected (orange circle)
Neutral:
DOJI - Indecision, potential reversal coming
SPINNING TOP - Small body, long wicks (indecision)
Best Practices:✅ Wait for confirmation - Don't trade pattern alone, check context
✅ Combine patterns - Retest + Candlestick = 80%+ win rate
✅ Check trend - Bullish patterns in uptrend work best
✅ Volume matters - Larger patterns with volume = stronger
✅ Fresh retests - First retest after break = highest probability
✅ Use alerts - Set alerts for Engulfing, Retest, Morning/Evening Star
✅ Size matters - Bigger candles = stronger signals❌ Don't trade every pattern - Quality over quantity
❌ Don't ignore context - Hammer at resistance = weak signal
❌ Don't trade against trend - Bearish in strong uptrend = risky
❌ Don't skip stop loss - Always protect your trades
❌ Don't trade small patterns - Need clear, visible patterns

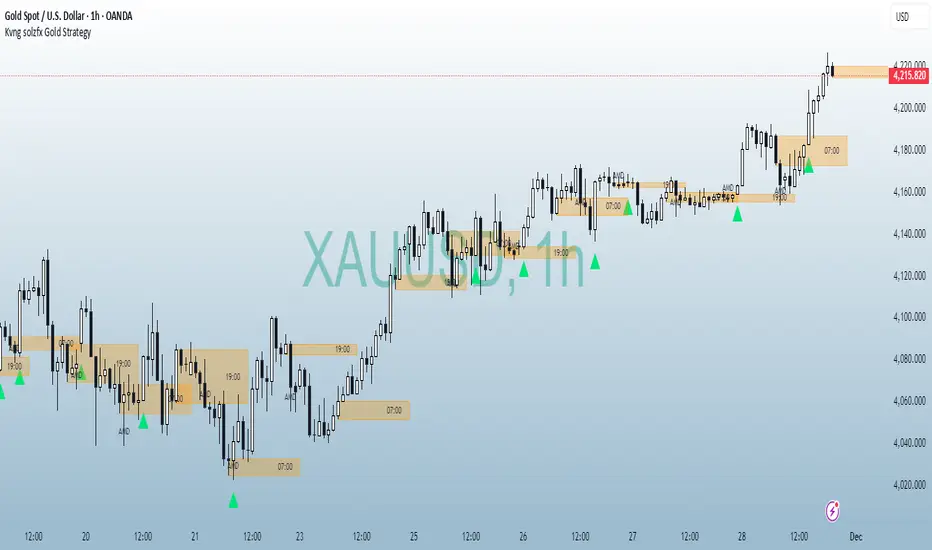
Kvng solzfx Gold StrategyThis indicator helps to find gold setups using kvng solz fx buy only strategy on gold

Gap Finder v6Locate all existing open gaps.
Display gap labels on chart with the size of the gap.
Gap size is based on the percentage of the price prior to when the gap was formed.
Example of label: .............Gap 4.8%

Levels S/R Boxes + Gaps + SL/TPWhat It Does:
Automatically identifies and displays:
🟦 Support/Resistance zones (horizontal boxes)
🟨 Price gaps (unfilled gaps from market open/close)
🎯 Stop Loss levels (where to protect trades)
💰 Take Profit levels (where to exit trades)
Purpose: Shows you exactly where price is likely to bounce, reverse, or break through.
Best Practices:
✅ Trade at the boxes - Don't chase price
✅ Use SL/TP lines - Automatic risk management
✅ Wait for confirmation - Candle pattern + S/R level
✅ Gaps get filled - Trade towards yellow boxes
✅ Solid lines = stronger - Prefer 3+ touch levels
❌ Don't ignore SL - Always protect yourself
❌ Don't trade middle - Wait for S/R zones
❌ Don't fight strong levels - Respect solid boxes
Settings (Quick Reference):
S/R Strength: 10 (default) - Lower = more levels, Higher = fewer stronger levels
Max Levels: 5 (default) - Number of S/R boxes to show
Show Gaps: ON - Display yellow gap boxes
Show SL/TP: ON - Display entry/exit suggestions
