sumeth.com EntryExit ProA professional multi-filter trading tool combining price action, pattern detection, dynamic trend filters, RSI/MACD confirmations, and breakout logic. Designed for precise entry & exit in any market.
Candlestick analysis
(CRT) MTF Candle Range Theory Model# 🚀 **CASH Pro MTF – Candle Range Theory (CRT) Indicator**
**The Smart Money ICT Setup Detector** 🔥
Hey Traders!
Here is the **ultimate Pine Script indicator** that automatically detects one of the most powerful Smart Money / ICT setups: **Candle Range Theory (CRT)**
---
### What is Candle Range Theory – CRT?
**CRT** is a high-probability price action model based on **liquidity grabs** and **range expansion**.
Price loves to:
1️⃣ Raid the low/high of the previous candle (take stop-losses)
2️⃣ Then reverse and run to the opposite side of the range (or beyond)
When this happens near a **key higher-timeframe level**, magic happens!
### Bullish CRT Model
- Price touches a **strong HTF support**
- Previous candle closes near that support
- Next candle **sweeps the low** (grabs liquidity)
- Current candle **closes above the raided low AND breaks the high** of the sweep candle
**Result → Aggressive bullish move expected!**
**Entry:** On close above the high (or on retest + MSS)
**Stop Loss:** Below the swept low
**Take Profit:** CRT High or next liquidity pool
### Bearish CRT Model
- Price touches a **strong HTF resistance**
- Previous candle closes near resistance
- Next candle **sweeps the high** (grabs buy stops)
- Current candle **closes below the raided high AND breaks the low** of the sweep candle
**Result → Strong bearish expansion!**
**Entry:** On close below the low
**Stop Loss:** Above the swept high
**Take Profit:** CRT Low or next downside liquidity
This whole setup can form in **just 3 candles**… or sometimes more if price consolidates after the sweep.
---
### Why This Indicator is Special
This is **NOT** a simple 3-candle pattern scanner!
This is a **true CRT + MTF confluence beast** with:
- **Multi-Timeframe Confirmation** (default 4H – fully customizable)
- **Built-in RSI Filter** (avoid fake moves in overbought/oversold)
- **Day-2 High/Low Levels** automatically drawn (the exact CRT range!)
- **Clean “LONG” / “SHORT” labels** right on the candle (no ugly arrows or offset)
- **Background highlight** on signal
- **Fully grouped inputs** – super clean settings panel
---
### Features at a Glance
| Feature | Included |
|--------------------------------|----------|
| Higher Timeframe Confirmation | Yes |
| RSI Overbought/Oversold Filter | Yes |
| Day-2 High/Low Lines + Labels | Yes |
| Clean Text Signals (no offset) | Yes |
| Background Highlight | Yes |
| Fully Customizable Colors & Text| Yes |
| Works on All Markets & TFs | Yes |
---
### How to Use
1. Add the indicator to your chart
2. Wait for a **LONG** or **SHORT** label to appear
3. Confirm price is near a **key HTF level** (order block, FVG, etc.)
4. Enter on close or retest (your choice)
5. Manage risk with the drawn Day-2 levels
**Pro Tip:** Combine with ICT Market Structure Shift (MSS) or Fair Value Gaps for even higher accuracy!

deKoder | HTF3 - Multi-Timeframe Candle DisplaydeKoder | HTF3 - Multi-Timeframe Candle Display
Overview
HTF3 is a powerful multi-timeframe analysis tool that displays higher timeframe candles directly on your current lower timeframe chart. When trading lower timeframes it is sometimes easy to lose sight of the higher timeframe context. HTF3 enables better trading decisions by keeping your analysis aligned with the dominant trend.
Key Features
• Multi-Timeframe Support : Display daily, weekly, or any custom higher timeframe candles
• Visual Candle Representation : Clear OHLC candles with customizable colors
• Range Display : Show previous candle ranges with dotted center lines
• Trading Signals : Automatic breakout and rejection signals with arrow markers
• Flexible Positioning : Adjustable horizontal offset for optimal placement
• Real-time Updates : Current higher timeframe candle builds in real-time
Use Cases
• Swing Traders : Maintain daily/weekly context on intraday charts
• Position Traders : Align entries with higher timeframe structure
• Breakout Traders : Identify key levels from previous candle ranges
• Market Analysis : Quickly assess multi-timeframe alignment
Configuration
• Timeframe : Select higher timeframe to display (default: D)
• X-Offset : Adjust horizontal positioning (-4 to 50)
• Show Candles : Toggle candle display
• Show Range : Toggle previous candle high/low ranges
• Signals : Display breakout/rejection signals
• Customize bull/bear colors and text appearance
How to Use
1. Select your desired higher timeframe in the settings
2. Adjust offset for optimal positioning
3. Use the range lines to identify potential liquidity zones
4. Watch for signal arrows indicating breakouts/rejections
5. Combine with your existing strategy for confirmation
Pro Tips
• Use daily candles on 1H/4H charts for swing trading context
• The signals are not intended as standalone buy/sell triggers. They should only be used as confluence for your main trade idea

first candle time 60 min by niceshort with chatgpttime and date first 1H candle.
Displaying the date and time of the first candle can be useful when searching for a chart with the longest history for a given asset.
Price Action - Bar CountDrawing from Al Brooks' emphasis on session rhythms in his books, this counts bars from market opens, resetting at US (0930-1600 ET), HK (0930-1200,1300-1600 HKT), or London (0800-1630 GMT) if selected. Labels every N bars (default 2) below, with custom colors per session and after-hours gray. Up to 79 in regular color, then faded. Helps track opening range tests and two-legged moves—focus on first hour dynamics for high-probability trades.

Price Action - H/L BarBased on Al Brooks' "Bar by Bar" (Chapter 09A, p.45-50) and "Trends" (p.98-105), this marks H (higher high with close above mid) and L (lower low with close below mid) swings. Marking pauses after each, resuming on pullback. Labels "H" above and "L" below bars for swing counting in trends or ranges. Key: Markets form two legs—use for measured moves or failed breakouts, always in context of prior extremes.

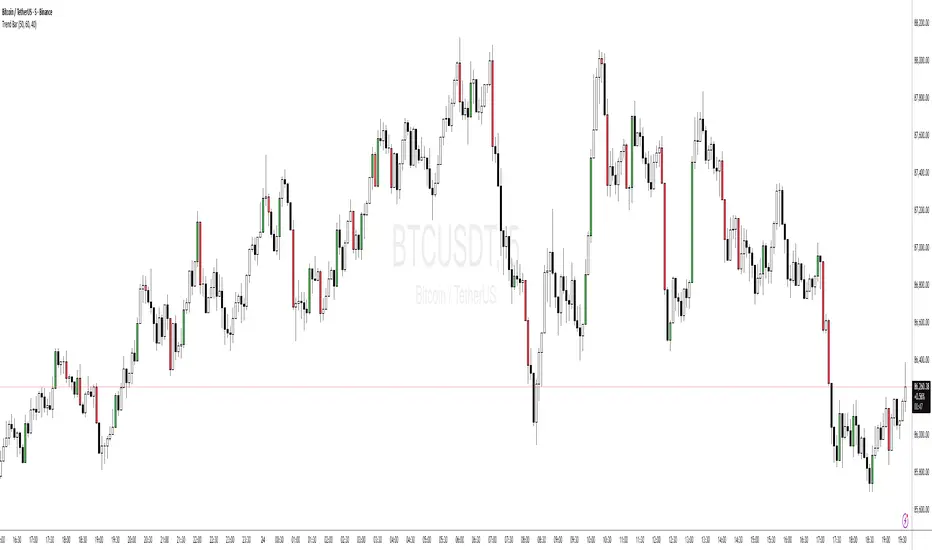
Price Action - Trend BarFrom Al Brooks' "Trading Price Action Trends," this indicator colors strong trend bars. Bull trend bars (green body ≥50%, close ≥60% up range, larger than 1.5x average) highlight buyer control, while bear trend bars (red body ≥50%, close ≤40% down range) show seller dominance. Use to identify trend resumption or climaxes. Philosophy: Trends persist until tested—focus on high-probability entries after pullbacks, avoiding barbwire noise.
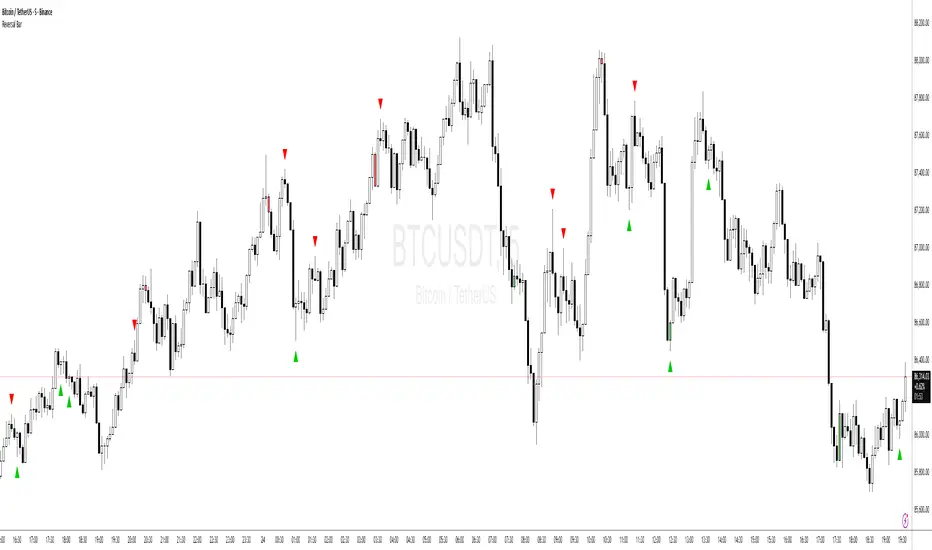
Price Action - Reversal BarInspired by Al Brooks' "Trading Price Action Reversals," this indicator detects potential bull and bear reversal bars. Bull reversals require a green bar with close above mid-range, small upper tail (≤30%), large lower tail (≥30%), and low below previous low without significant overlap. Bear reversals are the opposite. Triangles mark these setups for early reversal signals in trends or climaxes. Remember, markets test extremes—use with trend lines for confirmation, as single bars are often traps without a second leg.
Price Action - Inside/Outside BarsThis indicator highlights Inside and Outside bars based on Al Brooks' price action philosophy from "Reading Price Charts Bar by Bar." Inside bars (high ≤ previous high and low ≥ previous low) represent contraction and potential breakouts, often leading to two-legged moves. Outside bars (high > previous high and low < previous low with min body 50%) signal volatility and possible reversals or trends. Customizable highlights, lines, and labels help identify high-probability setups in trends or ranges. Always focus on context—buy low, sell high, and wait for confirmation.

EMA Trend Pro v1Here is a clear, professional English description you can copy-paste directly (suitable for sharing with friends, investors, brokers, or posting on TradingView):
EMA Trend Pro v5.0 – Strategy Overview
This is a trend-following strategy designed for 15-minute charts on assets like XAUUSD, NASDAQ, BTC, and ETH.
Entry Rules
Buy when the 7, 14, and 21-period EMAs are aligned upward and the 14-period EMA crosses above the 144-period EMA (with ADX > 20 and volume confirmation).
Sell short when the EMAs are aligned downward and the 14-period EMA crosses below the 144-period EMA.
Risk Management
Initial stop-loss is placed at 1.8 × ATR below (long) or above (short) the entry price.
Position size is calculated to risk a fixed percentage of equity per trade.
Profit-Taking & Trade Management
When price reaches 1:1 reward-to-risk, 30% of the position is closed.
At the same moment, the stop-loss for the remaining 70% is moved to the entry price (breakeven).
The remaining position is split:
50% targets 1:2 reward-to-risk
50% targets 1:3 reward-to-risk (allowing big wins during strong trends)
Visualization
Clean colored bars extend to the right showing entry, stop-loss, and three take-profit levels.
Price labels clearly display "Entry", "SL", "TP1 1:1", "TP2 1:2", and "TP3 1:3".
Only the current trade is displayed for a clean chart.
Key Advantages
High win rate due to breakeven protection after 1R
Excellent reward-to-risk ratio that lets winners run
Fully automated, works on any market with clear trends
Professional look, easy to understand and explain
Perfect for swing traders who want consistent profits with limited downside risk.
Feel free to use this description on TradingView, in your trading journal, or when explaining the strategy to others!
If you want a shorter version (e.g., for TradingView description box) or a Chinese version, just let me know — I’ll give it to you right away! 😊

ICT FVG & Swing Detector Basic by Trader Riaz//@version=6
indicator("ICT FVG & Swing Detector Basic by Trader Riaz", overlay=true)
// Display toggles for Bullish FVGs
show_bull_fvg = input.bool(true, "Show Bullish FVGs?")
// Input settings for Bullish FVGs
fvg_bull_count = input.int(1, "Number of Bullish FVGs to show", minval=1)
// Color settings for Bullish FVGs
bullish_fvg_color = input.color(color.green, "Bullish FVG Color")
// Bullish FVG Extend Options
bull_fvg_extendGroup = "Bullish FVG Extend Options"
bull_fvg_extendOption = input.string("Default", "Bullish FVG Extend Option", options= , group=bull_fvg_extendGroup)
bull_fvg_extendCandles = input.int(8, "Bullish FVG Extend Candles (Limited Only)", minval=1, maxval=100, step=1, group=bull_fvg_extendGroup)
// Display toggles for Bearish FVGs
show_bear_fvg = input.bool(true, "Show Bearish FVGs?")
// Input settings for Bearish FVGs
fvg_bear_count = input.int(1, "Number of Bearish FVGs to show", minval=1)
// Color settings for Bearish FVGs
bearish_fvg_color = input.color(color.red, "Bearish FVG Color")
// Bearish FVG Extend Options
bear_fvg_extendGroup = "Bearish FVG Extend Options"
bear_fvg_extendOption = input.string("Default", "Bearish FVG Extend Option", options= , group=bear_fvg_extendGroup)
bear_fvg_extendCandles = input.int(8, "Bearish FVG Extend Candles (Limited Only)", minval=1, maxval=100, step=1, group=bear_fvg_extendGroup)
// Display toggles for Swing Highs
show_swing_high = input.bool(true, "Show Swing Highs?")
// Input settings for Swing Highs
swing_high_count = input.int(2, "Number of Swing Highs to show", minval=1)
// Color settings for Swing Highs
swing_high_color = input.color(color.green, "Swing High Line & Label Color")
// Swing High Extend Options
swing_high_extendGroup = "Swing High Extend Options"
swing_high_extendOption = input.string("Default", "Swing High Extend Option", options= , group=swing_high_extendGroup)
swing_high_extendCandles = input.int(8, "Swing High Extend Candles (Limited Only)", minval=1, maxval=100, step=1, group=swing_high_extendGroup)
// Display toggles for Swing Lows
show_swing_low = input.bool(true, "Show Swing Lows?")
// Input settings for Swing Lows
swing_low_count = input.int(2, "Number of Swing Lows to show", minval=1)
// Color settings for Swing Lows
swing_low_color = input.color(color.red, "Swing Low Line & Label Color")
// Swing Low Extend Options
swing_low_extendGroup = "Swing Low Extend Options"
swing_low_extendOption = input.string("Default", "Swing Low Extend Option", options= , group=swing_low_extendGroup)
swing_low_extendCandles = input.int(8, "Swing Low Extend Candles (Limited Only)", minval=1, maxval=100, step=1, group=swing_low_extendGroup)
// Target Settings
showNextTarget = input.bool(true, "Show Next Target")
nextTargetHighColor = input.color(color.red, "Next Target High Color")
nextTargetLowColor = input.color(color.red, "Next Target Low Color")
// === Time Calculation ===
// Calculate one bar duration in milliseconds
barDuration = time - time
// Define reasonable extension period (4 bars into future)
extensionPeriod = barDuration * 4
// Arrays to store values with timestamps
var bull_fvg_data = array.new(0)
var bear_fvg_data = array.new(0)
var swing_high_data = array.new(0)
var swing_low_data = array.new(0)
var bull_fvg_labels = array.new(0)
var bear_fvg_labels = array.new(0)
var swing_high_labels = array.new(0)
var swing_low_labels = array.new(0)
var bull_fvg_midlines = array.new(0)
var bear_fvg_midlines = array.new(0)
var bull_fvg_tops = array.new(0)
var bull_fvg_bottoms = array.new(0)
var bear_fvg_tops = array.new(0)
var bear_fvg_bottoms = array.new(0)
// Get the last bar index
last_bar = last_bar_index + 3
// Function to determine right boundary based on extend option
get_right_boundary(option, extend_candles, default_right) =>
if option == "None"
bar_index - 2
else if option == "Limited"
bar_index - 2 + extend_candles
else
default_right
// Bullish FVG Detection
if high < low and show_bull_fvg
right_bar = get_right_boundary(bull_fvg_extendOption, bull_fvg_extendCandles, last_bar)
new_box = box.new(left=bar_index-2,
top=low,
right=right_bar,
bottom=high ,
bgcolor=color.new(bullish_fvg_color, 90),
border_color=bullish_fvg_color)
bull_mid = (low + high ) / 2
new_midline = line.new(bar_index-2, bull_mid, right_bar, bull_mid,
color=color.new(bullish_fvg_color, 50),
style=line.style_dashed)
new_label = label.new(right_bar-1, bull_mid, "Bullish FVG",
color=color.new(bullish_fvg_color, 100),
textcolor=bullish_fvg_color,
style=label.style_none,
textalign=text.align_right,
size=size.small)
array.unshift(bull_fvg_data, new_box)
array.unshift(bull_fvg_midlines, new_midline)
array.unshift(bull_fvg_labels, new_label)
array.unshift(bull_fvg_tops, low)
array.unshift(bull_fvg_bottoms, high )
if array.size(bull_fvg_data) > fvg_bull_count
box.delete(array.pop(bull_fvg_data))
line.delete(array.pop(bull_fvg_midlines))
label.delete(array.pop(bull_fvg_labels))
array.pop(bull_fvg_tops)
array.pop(bull_fvg_bottoms)
// Bearish FVG Detection
if low > high and show_bear_fvg
right_bar = get_right_boundary(bear_fvg_extendOption, bear_fvg_extendCandles, last_bar)
new_box = box.new(left=bar_index-2,
top=low ,
right=right_bar,
bottom=high,
bgcolor=color.new(bearish_fvg_color, 90),
border_color=bearish_fvg_color)
bear_mid = (low + high) / 2
new_midline = line.new(bar_index-2, bear_mid, right_bar, bear_mid,
color=color.new(bearish_fvg_color, 50),
style=line.style_dashed)
new_label = label.new(right_bar-1, bear_mid, "Bearish FVG",
color=color.new(bearish_fvg_color, 100),
textcolor=bearish_fvg_color,
style=label.style_none,
textalign=text.align_right,
size=size.small)
array.unshift(bear_fvg_data, new_box)
array.unshift(bear_fvg_midlines, new_midline)
array.unshift(bear_fvg_labels, new_label)
array.unshift(bear_fvg_tops, low )
array.unshift(bear_fvg_bottoms, high)
if array.size(bear_fvg_data) > fvg_bear_count
box.delete(array.pop(bear_fvg_data))
line.delete(array.pop(bear_fvg_midlines))
label.delete(array.pop(bear_fvg_labels))
array.pop(bear_fvg_tops)
array.pop(bear_fvg_bottoms)
// Swing High Detection
is_swing_high = high < high and high > high
if is_swing_high and show_swing_high
right_bar = get_right_boundary(swing_high_extendOption, swing_high_extendCandles, last_bar + 3)
new_line = line.new(bar_index - 1, high , right_bar, high ,
color=swing_high_color)
new_label = label.new(right_bar, high , "Swing High",
color=color.new(color.white, 30),
style=label.style_label_left,
textcolor=swing_high_color,
size=size.tiny)
array.unshift(swing_high_data, new_line)
array.unshift(swing_high_labels, new_label)
if array.size(swing_high_data) > swing_high_count
line.delete(array.pop(swing_high_data))
label.delete(array.pop(swing_high_labels))
// Swing Low Detection
is_swing_low = low > low and low < low
if is_swing_low and show_swing_low
right_bar = get_right_boundary(swing_low_extendOption, swing_low_extendCandles, last_bar + 3)
new_line = line.new(bar_index -1, low , right_bar, low ,
color=swing_low_color)
new_label = label.new(right_bar, low , "Swing Low",
color=color.new(color.white, 30),
style=label.style_label_left,
textcolor=swing_low_color,
size=size.tiny)
array.unshift(swing_low_data, new_line)
array.unshift(swing_low_labels, new_label)
if array.size(swing_low_data) > swing_low_count
line.delete(array.pop(swing_low_data))
label.delete(array.pop(swing_low_labels))
// Clean up if toggles are turned off
if not show_bull_fvg and array.size(bull_fvg_data) > 0
for i = 0 to array.size(bull_fvg_data) - 1
box.delete(array.get(bull_fvg_data, i))
line.delete(array.get(bull_fvg_midlines, i))
label.delete(array.get(bull_fvg_labels, i))
array.clear(bull_fvg_data)
array.clear(bull_fvg_midlines)
array.clear(bull_fvg_labels)
array.clear(bull_fvg_tops)
array.clear(bull_fvg_bottoms)
if not show_bear_fvg and array.size(bear_fvg_data) > 0
for i = 0 to array.size(bear_fvg_data) - 1
box.delete(array.get(bear_fvg_data, i))
line.delete(array.get(bear_fvg_midlines, i))
label.delete(array.get(bear_fvg_labels, i))
array.clear(bear_fvg_data)
array.clear(bear_fvg_midlines)
array.clear(bear_fvg_labels)
array.clear(bear_fvg_tops)
array.clear(bear_fvg_bottoms)
// === Swing High/Low Detection ===
var float swingHighs = array.new()
var int swingHighTimes = array.new()
var float swingLows = array.new()
var int swingLowTimes = array.new()
var line swingHighLines = array.new()
var label swingHighLabels = array.new()
var line swingLowLines = array.new()
var label swingLowLabels = array.new()
isSwingHigh = high > high and high > high
isSwingLow = low < low and low < low
if isSwingHigh
array.unshift(swingHighs, high )
array.unshift(swingHighTimes, time )
if isSwingLow
array.unshift(swingLows, low )
array.unshift(swingLowTimes, time )
// === Next Target Detection ===
var line currentTargetLine = na
var label currentTargetLabel = na
if showNextTarget
if not na(currentTargetLine)
line.delete(currentTargetLine)
if not na(currentTargetLabel)
label.delete(currentTargetLabel)
priceRising = close > open
priceFalling = close < open
// Use slightly longer extension for targets
targetExtension = barDuration * 8
if priceRising and array.size(swingHighs) > 0
for i = 0 to array.size(swingHighs) - 1
target = array.get(swingHighs, i)
targetTime = array.get(swingHighTimes, i)
if target > close
currentTargetLine := line.new(
x1=targetTime, y1=target,
x2=time + targetExtension, y2=target,
color=nextTargetHighColor, width=2,
style=line.style_dashed,
xloc=xloc.bar_time)
currentTargetLabel := label.new(
x=time + targetExtension, y=target,
text="Potential Target", size=size.tiny,
style=label.style_label_left,
color=nextTargetHighColor,
textcolor=color.white,
xloc=xloc.bar_time)
break
else if priceFalling and array.size(swingLows) > 0
for i = 0 to array.size(swingLows) - 1
target = array.get(swingLows, i)
targetTime = array.get(swingLowTimes, i)
if target < close
currentTargetLine := line.new(
x1=targetTime, y1=target,
x2=time + targetExtension, y2=target,
color=nextTargetLowColor, width=2,
style=line.style_dashed,
xloc=xloc.bar_time)
currentTargetLabel := label.new(
x=time + targetExtension, y=target,
text="Potential Target", size=size.tiny,
style=label.style_label_left,
color=nextTargetLowColor,
textcolor=color.white,
xloc=xloc.bar_time)
break

Delta Zones Smart Money Concept (SMC) UT Trend Reversal Mul.Sig.🚀 What's New in This Version (V5 Update)
This version is a major overhaul focused on improving trade entry timing and risk management through enhanced UT Bot functionality:
Integrated UT Trailing Stop (ATR-based): The primary trend filter and moving stop-loss mechanism is now fully integrated.
Pre-Warning Line: A revolutionary feature that alerts traders when the price penetrates a specific percentage distance (customizable) from the UT Trailing Stop before the main reversal signal fires.
"Ready" Signal: Plots a "Ready" warning label on the chart and triggers an alert condition (UT Ready Long/Short) for pre-emptive trade preparation.
V5 Compatibility: All code has been optimized for Pine Script version 5, utilizing the modern array and type structures for efficient Order Block and Breaker Block detection.
💡 How to Use This Indicator
This indicator works best when confirming signals across different components:
1. Identify the Trend Bias (UT Trailing Stop)
Uptrend: UT Trailing Stop line is Green (Focus only on Buy/Long opportunities).
Downtrend: UT Trailing Stop line is Red (Focus only on Sell/Short opportunities).
2. Prepare for Entry (Warning Line)
Action: When you see the "Ready" label or the price hits the Pre-Warning Line (Dotted Orange Line), this is your alert to prepare for a trend flip, or to tighten the stop on your current trade.
3. Confirm the Entry (Multi-Signals)
Look for a primary entry signal that aligns with the desired trend:
High-Conviction Entry: Wait for the UT Buy/Sell label (confirmed trend flip) AND a Combined Buy/Sell arrow (confirmed by your selected Oscillator settings).
High-Liquidity Entry: Look for a Delta Zone Box forming near an active Order Block or Breaker Block (SMC zones), and then confirm with a UT or Combined Signal.
4. Manage Risk (Trailing Stop)
Always set your initial Stop Loss (SL) either just outside the opposite Order Block or at the UT Trailing Stop level itself.
If the price closes back across the UT Trailing Stop, exit your position immediately, as the trend bias has officially shifted.
Features & Components
1. Delta Zones (Liquidity/Wick Pressure)
Identifies periods of extreme buying or selling pressure based on wick-to-body ratios and standard deviation analysis.
Plots colored pressure boxes (Buy/Sell) to highlight potential exhaustion points or institutional activity.
2. Smart Money Concepts (SMC)
Automatically detects and plots Order Blocks (OBs) and Breaker Blocks (BBs) based on confirmed Market Structure Breaks (MSBs).
Includes Chop Control logic to remove less reliable Breaker Blocks.
3. UT Bot Trailing Stop & Warning Line
UT Trailing Stop (ATR-based): Plots a dynamic trend line (Green/Red) that acts as a moving stop-loss and primary trend filter.
Ready/Warning Signals: Alerts traders (via the "Ready" label and orange lines) when the price enters a "Pre-Reversal Zone" near the Trailing Stop.
4. Multi-Indicator Confirmation (Filters)
Includes customizable signals based on the crossover/crossunder of RSI, CCI, and Stochastic indicators against configurable Overbought/Oversold levels.
Allows selection of combination signals (e.g., RSI & CCI, All Combined, etc.) for high-conviction entries.

Gann Levels (Auto) by RRR📌 Gann Levels (Auto) — Intraday, Swing & Elliott Wave Precision Tool
Gann Levels (Auto) is a high-accuracy price-reaction indicator designed for intraday scalpers, swing traders, and Elliott Wave traders who want clean, auto-updating support and resistance levels without manually drawing anything.
The indicator automatically detects the latest swing high & swing low and plots the 8 Gann Octave Levels between them. These levels act as a complete price map—showing equilibrium, structure, trend continuation zones, and reversal points with extreme precision.
🔥 Why This Indicator Stands Out
✔ Fully automatic swing detection
Levels update as structure evolves — no manual adjustments.
✔ All Gann Octave levels
Plots 1/8 through 8/8 including the critical 4/8 midpoint.
✔ Intraday-optimized
Exceptional on 1m, 3m, 5m, and 15m charts.
✔ Ultra-clean support & resistance
Levels act as reliable barriers and breakout zones.
⭐ MOST IMPORTANT LEVELS FOR INTRADAY
4/8 – Midpoint (Major Decision Pivot)
Strongest Gann level.
Controls trend or reversal for the session.
Breakout → Trend Day
Rejection → Reversal Day
8/8 & 0/8 – Extreme Structure Edges
Most likely zones for intraday reversals.
Perfect for scalp entries when combined with volume exhaustion.
🎯 How to Trade ELLIOTT WAVE Using Gann Levels
This indicator is exceptionally powerful when combined with Elliott Wave Theory.
Here is how to use it wave-by-wave:
🔵 Wave 2 → Identify Bottom Using 0/8 or 1/8 Levels
Wave 2 typically retraces deep but remains above key structure.
Gann confirmation:
Price stops at 0/8 or 1/8 zone
Rejection wick + low volume breakdown attempt
Bullish intent starts forming
This gives a perfect Wave 3 entry zone.
🔴 Wave 3 → Breakout Above 4/8 Midpoint
Wave 3 is the strongest impulsive wave.
The 4/8 level works like a force-field.
Wave 3 confirmation:
Price breaks and retests 4/8
Strong volume
No deep pullbacks after break
This is one of the most reliable Elliott + Gann trades.
🟡 Wave 4 → Uses 3/8 or 5/8 as Support/Resistance
Wave 4 is corrective and shallow compared to Wave 2.
Gann alignment:
Wave 4 often consolidates between 3/8 and 5/8
Levels act like range boundaries
Avoid trading inside chop; wait for breakout
This gives perfect continuation entries for Wave 5.
🟣 Wave 5 → Ends Near 7/8 or 8/8 Extreme Zone
Wave 5 usually ends in overbought territory.
Gann confirmation:
Price hits 7/8 or 8/8
Momentum weakens
Divergence builds (RSI/MACD optional)
Last push = exhaustion
This is where reversals or major pullbacks begin.
💥 BONUS: Corrective Waves (A-B-C)
Wave A:
Often rejects from 4/8 or 5/8.
Wave B:
Typically trapped between 3/8–5/8.
Wave C:
Usually ends around 0/8 (for bullish trend)
or 8/8 (for bearish trend).
These zones give ultra-high confidence entries.
⚙️ Who This Indicator Is Perfect For
Elliott Wave traders
Intraday scalpers
Swing traders
Price action & structure traders
Traders who want automatic support-resistance levels
Traders who want clean, non-cluttered levels
⚠️ Disclaimer
This indicator is for educational purposes only.
Trading involves risk. Always use proper risk management.

Reversal Candlestick Setups (Doji, Outside, Extreme, Wick)Reversal Candlestick Setups – Doji, Outside, Extreme & Wick
This indicator identifies four high-probability reversal candlestick patterns across all timeframes: Doji Reversals, Outside Reversals, Extreme Reversals, and Wick Reversals. Each setup is based on clearly defined quantitative rules, allowing traders to filter noise and focus on strong reversal signals instead of relying on subjective visual interpretation.
The tool automatically scans every candle, highlights qualifying patterns on the chart, and provides alert options for both bullish and bearish versions of all four setups. This makes it suitable for intraday traders, swing traders, and positional traders seeking early reversal confirmation.
Included Setups
1. Doji Reversal Setup
Identifies candles with extremely small bodies relative to their range, combined with a smaller-than-average bar size. Useful for spotting market indecision before a directional shift.
2. Outside Reversal Setup
Flags candles that engulf the previous candle’s high–low range and exceed the average range by a multiplier. This is designed to capture strong momentum reversals driven by aggressive buying or selling.
3. Extreme Reversal Setup
Highlights large-bodied candles that dominate their overall range and exceed twice the average bar size. These signals aim to catch climactic exhaustion and institutional-level reversals.
4. Wick Reversal Setup
Detects candles with long rejection wicks, small bodies, and closes near an extreme of the range, supported by above-average bar size. Ideal for identifying sharp intrabar rejections.
Key Features
• Automatically detects all four reversal setups
• Works on all timeframes and symbols
• Customizable variables for deeper testing and optimization
• Clear bullish and bearish labels directly on the chart
• Fully integrated alert conditions for real-time notifications
• Suitable for crypto, stocks, indices, forex, and commodities
Who This Indicator Is For
• Traders who want objective, rule-based reversal detection
• Price action traders looking to enhance accuracy
• Systematic traders wanting quantifiable candlestick criteria
• Beginners learning reversal structures with visual guidance
• Professionals integrating reversal patterns into algorithmic or discretionary systems
How to Use
Add the indicator to your chart and enable alerts for the specific setups you want to track (e.g., “Bullish Wick Reversal”). Combine these signals with market structure, trend filters, volume analysis, or momentum indicators for increased conviction.

SuperEMA RSI Strategy [wjdtks255]Indicator Description and Trading Guide for “SuperEMA RSI Strategy ”
Indicator Name: SuperEMA RSI Strategy
Description
The SuperEMA RSI Strategy combines fast and slow Exponential Moving Averages (EMA) to identify key trend changes, enhanced with the Relative Strength Index (RSI) to filter momentum strength. It plots clear buy and sell signals based on EMA crossovers while highlighting trend zones with colored backgrounds for quick visual reference. This multi-timeframe compatible indicator is suitable for stocks, cryptocurrencies, and other markets.
How to Use the SuperEMA RSI Strategy
Buy Signal:
Enter a long position when the short-term EMA crosses above the long-term EMA, indicated by a green circle below the price bar. Confirm the trend with a green background and consider RSI values showing sufficient momentum (typically RSI above 50).
Sell Signal:
Enter a short position when the short-term EMA crosses below the long-term EMA, indicated by a red circle above the price bar. Confirm the bearish trend with a red background and verify momentum weakening (typically RSI below 50).
Trend Confirmation:
Use the background color-shaded zones to identify prevailing trend strength and avoid counter-trend trades.
RSI Application:
Optionally enable RSI display to avoid overbought/oversold entries by watching for levels above 70 (overbought) or below 30 (oversold).
Additional Tips
Adjust EMA and RSI parameters to suit different timeframes or asset volatility.
Combine this indicator with volume analysis and other technical tools for enhanced signal reliability.
Implement well-defined stop-loss and take-profit levels to manage risk effectively.

Guardian Entry Signal - FreeYou’ll instantly see big green triangles under the candles when all conditions line up. That’s your entry.
Set an alert and it will ping your phone the second one fires.

Fib+BOS/CHOCH+OB# ⭐ 1) **What This Indicator Does**
The indicator combines 4 major concepts:
### **1️⃣ Market Structure (Swing High/Low)**
* Detects major swing highs and lows using pivot logic
* Determines whether the market is **Bullish** or **Bearish**
### **2️⃣ BOS / CHOCH (Break of Structure / Change of Character)**
* **BOS:** continuation of trend
* **CHOCH:** early signal of trend reversal
* Only the **last 5** levels are displayed → keeps chart clean
### **3️⃣ Order Blocks (OB)**
* Detects last opposite candle before BOS/CHOCH
* Displays only **the latest 3 OB zones**
* Ideal for identifying high-probability pullbacks

Breakout Condition Indicator - Long - V2 - Mega 86Script used for swing trading - contains certain adjustable metrics that I use for scanning and day or entry

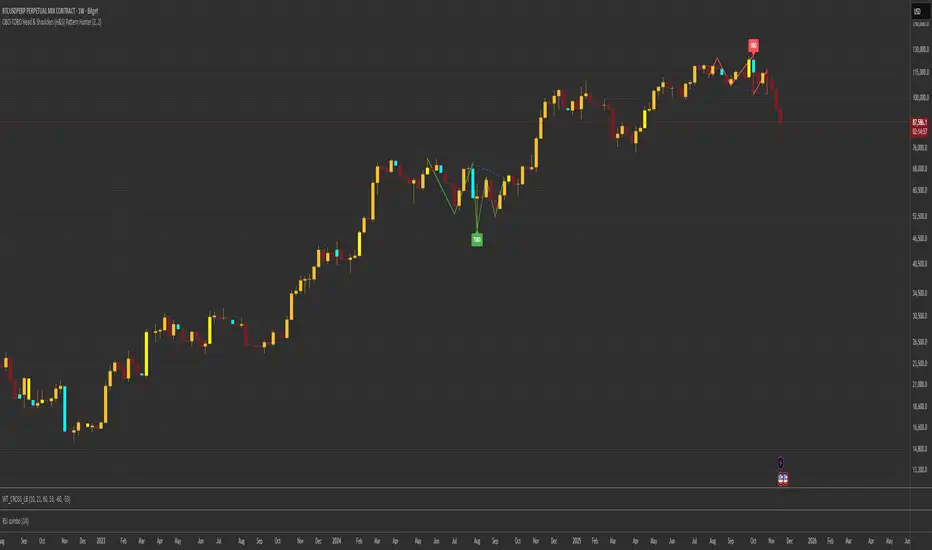
OBO-TOBO Head & Shoulders (H&S) Pattern HunterOBO-TOBO Head & Shoulders (H&S) Pattern Hunter
This indicator automatically detects Head and Shoulders (Bearish) and Inverse Head and Shoulders (Bullish) patterns using a smart ZigZag algorithm. Unlike standard indicators, it does not just mark the pivots; it draws the complete geometric "M" or "W" shape, including all legs from start to finish.
Key Features:
Full Geometry: Draws the complete pattern shape with proper legs, ensuring distinct visibility.
Smart Cleaning (Garbage Collector): Automatically deletes old or invalid patterns when a new one forms. Keeps your chart clean and prevents visual clutter.
Neckline Projection: Automatically draws the neckline projection to identify potential breakout levels.
Symmetry Check: Filters out invalid structures and only detects proportional patterns.
How to Use: You can adjust the "Sensitivity" (Length) setting in the menu to detect smaller or larger patterns according to your trading style.
Advanced Price Ranges — Izaak ButlerThis indicator automatically draws equally-spaced price ranges (based on a user-defined size) above and below the current price. Each range displays its High, Low, 50% midpoint, and 25/75% quarter levels. All lines now extend both forward and backward in time, covering the entire chart. Labels are added on the right edge for easy reference, and optional alerts trigger when price crosses key levels. This tool helps visualize structured price zones and ICT-style range behaviour across all market conditions.
SCOB Pattern with ERC & AlertsSingle Candle Block (SC0B) consists of a single candle appearing at a significant price level, indicating a confirmed reversal in price direction from that particular area of interest.
SCOB is primarily used to confirm and execute trades.
Using a single candle block to enter a trade minimizes risk and maximizes reward.
Single bullish candle block?
1st candle closes at bullish point of interest with a short or long wick.
2nd candle sweeps the low of previous(1st) candle and closes above the low of previous candle.
3rd candle closes above the high of 2nd candle.
How to trade with Scob bullish.
To Trade using Bullish SCOB you have to wait for price to come down and test the single candle order block.
When price tests the SCOB you can directly execute a buy trade or for a precise entry you can wait for a market structure shift in lower time frame.
Scob discount is the opposite of price increase.
This strategy should only be used when price "sweeps through key lever, liquidity, imbalance, poi htf areas.
This indicator will add a filter to help you reduce signal noise.
Use the "Use engulfing candle to test" function to filter the 3rd candle.
Only search for Scob if the 3rd candle is an Engulfing candle.
The logic for finding Engulfing candles can be changed based on the "% maximum wick length" option. The default is that the candle wick is 25% of the total candle wick length.
You can also use the alert function when Scob appears
With Smart money concept, no strategy is perfect in trading, so you should not risk too much of your capital on this strategy.
To be safer, always remember to use stop loss for every trade.

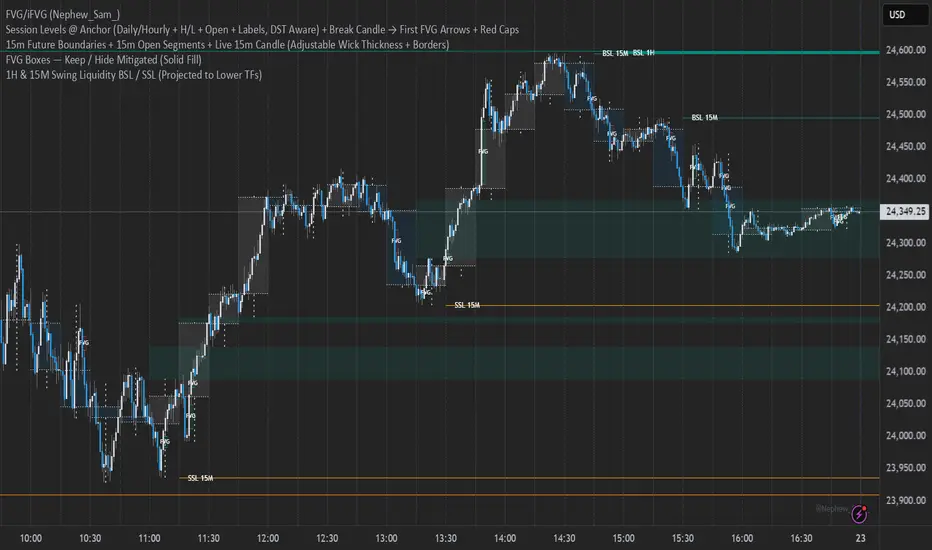
15m Open Segments + Live 15m Candle I created this script for so you can add a 15m candle overlay on your lower timeframes, to better view the price action of the 15m candle.
Powerful Zone Detector (V19 - Hibrit)With the Powerful Zone Detector, you can easily identify support and resistance zones close to the price zone.
