Candlestick analysis
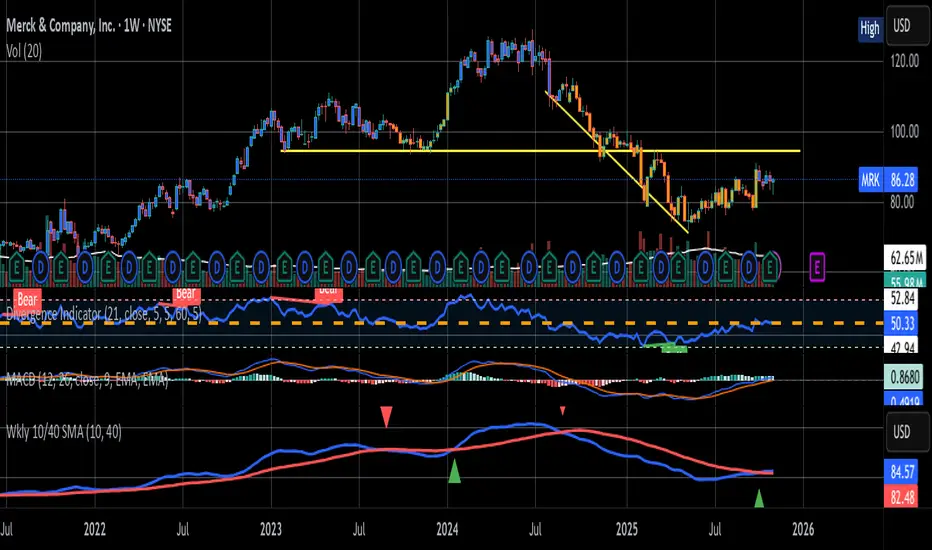
Weekly 10W / 40W SMA CrossoverSMA cross over for the Weekly Chart
The 10 week and 40 Week cross over has been found to be the better judge of buy/sell signals over the last 5 years
EMA Crossover with RSI Signals( Khalid)This script includes:
Key Features:
Strong Buy Signal: Green upward triangle below the bar when:
9 EMA crosses above 21 EMA
RSI is above 55
Strong Sell Signal: Red downward triangle above the bar when:
9 EMA crosses below 21 EMA
RSI is below 45
Visual Elements:
Yellow 9 EMA line
Orange 21 EMA line
Purple RSI line in a separate window
Clear buy/sell signals with labels
Background coloring when RSI is in buy/sell zones
Information table showing current RSI and EMA9 values
Customization:
You can adjust all parameters in the settings:
EMA lengths
RSI length
RSI buy/sell levels
How to use:
Copy this code into TradingView's Pine Editor
Add it to your chart
The signals will appear as triangles with "STRONG BUY" or "STRONG SELL" labels
Alerts will trigger when signals occur
The script also includes background coloring to help visualize when RSI is in favorable conditions for potential trades.

Trend Meter [MMT]The Trend Meter is a dynamic Pine Script indicator designed to provide traders with a clear, multi-dimensional view of market trends and momentum across different timeframes and metrics. By integrating Exponential Moving Averages (EMAs), Volume-Weighted Average Price (VWAP), higher timeframe (HTF) analysis, and Regular Trading Hours (RTH) breakouts, this indicator offers a comprehensive tool for identifying bullish, bearish, or neutral market conditions. Its customizable visual display and label system make it ideal for traders seeking actionable insights for trend-following, breakout, or reversal strategies.
Key Features:
1. Multi-Metric Trend Analysis:
- Trend Meter : Compares a Fast EMA (default: 9) and Slow EMA (default: 21) to determine short-term trend direction.
- Bias Meter : Uses a longer-term Bias EMA (default: 35) to assess the overall market bias based on the close price.
- VWAP Meter : Evaluates price position relative to the VWAP for dynamic support/resistance insights.
- HTF Meter : Analyzes higher timeframe (default: 60-minute) price action, detecting breakouts of previous highs/lows and candle direction.
- RTH Meter : Tracks price breakouts above/below the US Regular Trading Hours (09:30–16:00 EST) 15m opening range (09:30–09:45 EST).
2. Color-Coded Visuals:
- Each metric is displayed as a horizontal line with customizable colors (green for bullish, red for bearish, gray for neutral).
- Visual style options (dotted, dashed, or solid lines) allow for personalized chart clarity.
3. Dynamic Labels:
- Optional labels for each metric (Trend, Bias, VWAP, HTF, RTH) with customizable text, size (tiny to huge), and color.
- Labels update in real-time, providing clear identification of each meter’s role and current state.
4. Flexible Metric Selection:
- Toggle individual metrics (EMA, VWAP, HTF, RTH) on/off to focus on relevant indicators for your trading style.
- Option to use the previous bar’s close price for calculations, reducing noise in volatile markets.
5. RTH and Opening Range Analysis:
- Calculates the high/low of the opening range (09:30–09:45 EST) during RTH sessions.
- Signals bullish or bearish conditions when the price breaks above/below the opening range outside the initial 15-minute window.
6. Higher Timeframe Breakout Detection:
- Monitors HTF price action to identify breakouts of the previous candle’s high or low, combined with the HTF candle’s direction for trend confirmation.
How to Use:
- Trend Confirmation : Use the Trend and Bias Meters to confirm short-term and long-term market direction.
- Breakout Trading : Leverage the RTH Meter for breakout setups above/below the opening range during US trading hours.
- Support/Resistance : Utilize the VWAP Meter to identify dynamic price levels for entries or exits.
- Higher Timeframe Context : Monitor the HTF Meter for broader market trend alignment, ideal for swing or position trading.
- Customization : Adjust EMA lengths, toggle metrics, and customize visual styles and labels to suit your chart preferences.
Settings:
- Bias Settings :
- Fast EMA (default: 9), Slow EMA (default: 21), Bias EMA (default: 35).
- Higher Timeframe (default: 60-minute).
- Option to use previous close price for calculations.
- Enable/disable individual metrics (EMA, VWAP, HTF, RTH).
- Visual Settings :
- Bullish (green), bearish (red), and neutral (gray) colors.
- Line style (dotted, dashed, solid).
- Label Settings :
- Enable/disable labels.
- Customize label size (tiny, small, normal, large, huge) and text color.
- Custom text for each meter’s label (Trend, Bias, VWAP, HTF, RTH).
Notes:
- Optimized for intraday trading (e.g., 1m, 5m, 15m) but adaptable to any timeframe.
- RTH and opening range calculations are tailored for US markets (EST timezone); adjust session times in the code for other markets.
- Higher timeframe analysis enhances context for multi-timeframe strategies.
Ideal For:
- Intraday traders targeting RTH breakout opportunities.
- Swing traders aligning with higher timeframe trends.
- Traders using VWAP and EMA-based strategies for trend and momentum analysis.
- Those seeking a clean, customizable dashboard for multi-metric market analysis.

Heiken Ashi Buy/Sell Signals for EUR/USD European SessionUSING Heiken Ashi DURING SESSIONS EUR & USD Buy/Sell Signals for EUR/USD DURING European Session

Trend Engine [MMT]The Trend Engine is a versatile Pine Script indicator designed to identify trend direction, potential reversals, and key price levels using a combination of Exponential Moving Averages (EMAs), and Anchored Volume-Weighted Average Price (VWAP). This indicator provides traders with a clear visual representation of market bias, momentum, and key support/resistance levels, making it suitable for both trend-following and pullback trading strategies.
Key Features:
1. EMA Cloud System:
- Displays three customizable EMAs (Fast, Pullback, and Slow) with configurable lengths and visibility.
- Creates two cloud fills:
- Fast Cloud : Between the Fast EMA (default: 8) and Pullback EMA (default: 13).
- Slow Cloud : Between the Pullback EMA and Slow EMA (default: 21).
- Clouds are color-coded (green for bullish, red for bearish) based on EMA alignment, with adjustable transparency for clarity.
2. Bias EMA:
- A longer-term EMA (default: 35) indicates the overall market bias.
- Changes color based on whether the regular candle close is above (green) or below (red) the Bias EMA, providing a clear trend direction signal.
3. Heikin Ashi Signals:
- Utilizes Heikin Ashi candles to detect strong bullish or bearish momentum.
- Generates buy/sell signals when a Heikin Ashi candle confirms a trend (bullish HA candle closing above Bias EMA for buy, bearish HA candle closing below for sell).
- Signal arrows are currently disabled but can be enabled via settings for visual confirmation.
4. Anchored VWAP and Standard VWAP:
- Plots both a standard VWAP and an Anchored VWAP (anchored to the US RTH session, 09:30–16:00 EST).
- Customizable line styles (solid, cross, or circles) and colors for both VWAPs, aiding in identifying dynamic support/resistance levels.
5. Background and Candle Coloring:
- Optional background coloring reflects the market bias (green for bullish, red for bearish) based on the regular close relative to the Bias EMA.
- Optional Heikin Ashi candle coloring to visually distinguish bullish and bearish market conditions.
6. Regular Candle Close:
- Option to plot the regular (non-Heikin Ashi) close price with customizable styles (line, circles, or cross) for reference.
7. Alerts:
- Built-in alert conditions for bullish and bearish signals, allowing traders to receive notifications when a Heikin Ashi candle confirms a trend relative to the Bias EMA.
How to Use:
- Trend Identification : Use the Bias EMA and background color to determine the overall market direction.
- Pullback Trading : Monitor the EMA clouds for alignment (bullish or bearish) and use the Pullback EMA for entries during retracements.
- Support/Resistance : Leverage the VWAP and Anchored VWAP as dynamic levels for trade entries or exits.
- Signal Confirmation : Enable signal arrows (when fixed) to spot high-probability trend continuation or reversal setups.
- Customization : Adjust EMA lengths, colors, transparency, and visibility to suit your trading style and timeframe.
Settings:
- EMA Cloud : Customize lengths (default: 8, 13, 21), visibility, and cloud colors/transparency.
- Bias EMA : Adjust length (default: 35) and colors for above/below states.
- VWAP : Toggle standard and Anchored VWAP, with customizable styles and colors.
- Background/Candles : Enable/disable background and candle coloring for visual clarity.
- Regular Close : Show/hide the regular close price with style options.
Notes:
- Designed for use on any timeframe, but most effective on intraday (e.g., 5m, 15m) or daily charts.
- Best used in conjunction with other technical analysis tools for confirmation.
- Anchored VWAP is tailored for US markets (RTH session) but can be adjusted for other sessions by modifying the anchor time in the code.
Ideal For:
- Day traders and swing traders looking for trend direction and pullback opportunities.
- Traders using VWAP-based strategies for intraday support/resistance.
- Those seeking a clean, customizable visual aid for market bias and momentum.
This indicator is a powerful tool for traders aiming to capture trends and manage risk effectively, with extensive customization to adapt to various markets and trading styles.

Multi-Layer Pin Zone AnalyzerAnalyzes LOW (bottom wicks) and HIGH (top wicks) to detect repeated touches within a defined tolerance.
Clusters nearby pin levels and, when the number of touches exceeds a threshold, draws infinite horizontal rectangles (zones) to highlight key areas.
LOW (teal): Support zones
HIGH (red): Resistance zones
COMBINED (orange): Mixed zones using both highs and lows
Each type has independent settings for tolerance (%), minimum touches, and maximum zones.
Automatically visualizes strong support, resistance, and consolidation areas across the chart.


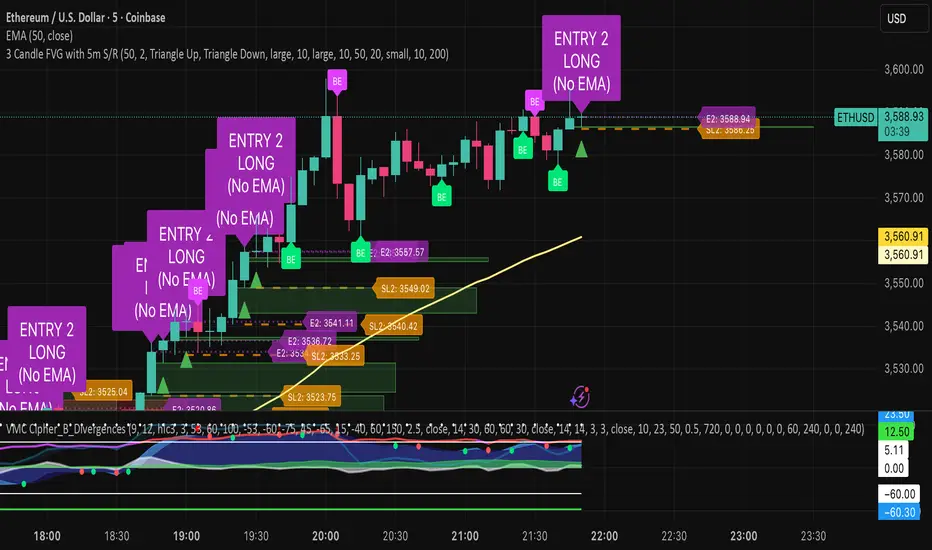
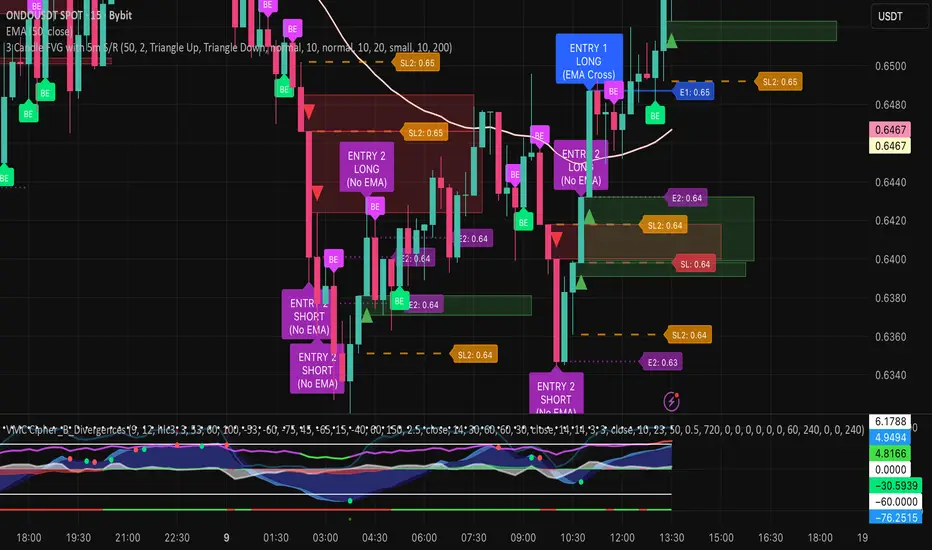
3 Candle FVG with 5m S/R3 candle breakout indicator.
Shows EMA 50.
Shows Support and Resistance from the 5m chart on every timeframe.
Indicates every engulfing candle.
Indicates entry at 3 consecutive candles in the same direction where the middle candle has an FVG and it crosses the EMA.
Indicates entry at 3 consecutive candles in the same direction where the middle candle has an FVG and it does not cross the EMA.
Swing High Low ZigZag v3.0 BajaSwing High/Low Pivot - Designed to help easily spot peaks and bottoms for quicker drawing of trendlines and other drawings as well as alerts without needing to zoom in a whole lot.

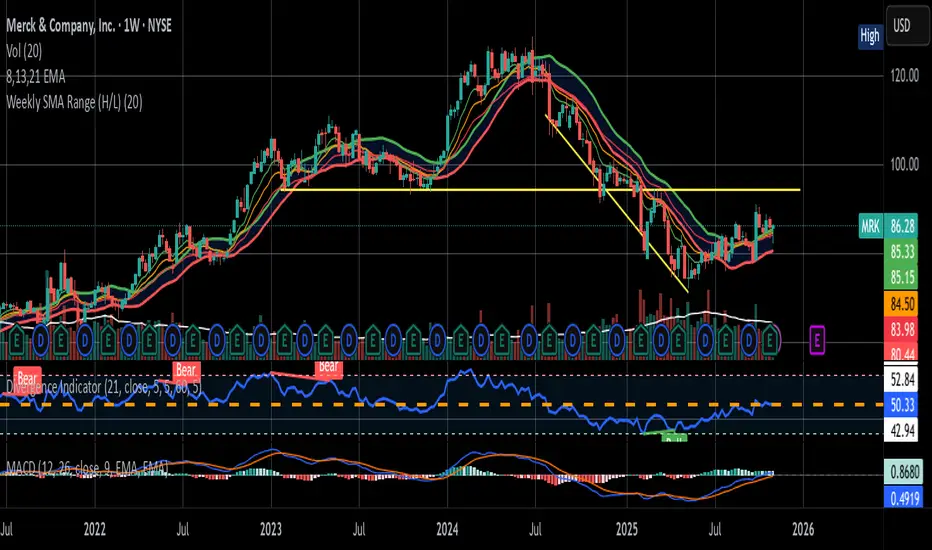
EMA 200 - 50 - 20 | Davide BuncugaThis script displays three key Exponential Moving Averages (EMAs) on the chart: EMA 200, EMA 50, and EMA 20.
These moving averages are commonly used by traders to identify the overall market trend, medium-term structure, and short-term momentum.
EMA 200 – Represents the long-term trend and acts as a dynamic support/resistance.
EMA 50 – Used to identify the medium-term direction of the market.
EMA 20 – Highlights short-term momentum and pullback areas within the trend.
This indicator is designed to help traders quickly analyze market structure and align their trading decisions with the dominant trend.

3HH/3LL → Next Bar Inside = Signal (Neon)Detects 3 consecutive Higher Highs or 3 consecutive Lower Lows.
Signals only when the very next candle is an Inside Bar.
Uses your Neon Lime (HH case) and Neon Pink (LL case) colors.

3HH/3LL → Next Bar Inside = Signal (Neon)Here’s a minimal, compile-ready Pine v5 indicator that does exactly this:
Detects 3 consecutive Higher Highs or 3 consecutive Lower Lows.
Signals only when the very next candle is an Inside Bar.
Uses your Neon Lime (HH case) and Neon Pink (LL case) colors.

MACD + StochasticMACD + Stochastic 14 Scenarios - Complete Signal Analysis
Combines MACD and Stochastic Oscillator to identify 14 different market scenarios based on crossover timing and indicator positioning.
🎯 Signal Strength Classification:
• STRONG (⭐⭐⭐⭐⭐): Both indicators cross together - highest confidence
• MODERATE (⭐⭐⭐⭐): One crosses while other confirms - good confidence
• WEAK (⭐⭐): Conflicting signals - low confidence
📊 Visual Features:
✓ Color-coded shapes on chart (triangles, circles, X marks)
✓ Scenario labels (1-16, excluding 12 & 14)
✓ Real-time info table showing current status
✓ Customizable signal display (show/hide by strength)
✓ Built-in alerts for all signal types
Perfect for swing traders and position traders looking for high-probability entries with dual indicator confirmation. Use on daily
timeframe for best results.
Includes toggleable display options for strong, moderate, and weak signals.

ORB 30 Alerts (ATH)Overview
ATH ORB 30m automates the Opening Range Breakout (ORB) process across multiple global sessions — Tokyo, London, and New York — and delivers clean, consolidated alerts when fresh breakouts occur.
It’s built for traders who track several tickers and want precise, non-repeating signals that reflect genuine momentum shifts, not constant noise.
How it works
The script defines a 30-minute Opening Range (ORB) for each enabled session and plots its high, low, and midpoint levels.
Every 10-minute candle close is evaluated to detect first-time crosses of those range boundaries — upward or downward.
Once a breakout triggers, that side’s alert is disabled until price returns inside the range, where the system automatically re-arms.
Multiple triggers in the same bar are batched into one combined alert, listing all symbols that broke out.
A built-in debug panel and optional chart labels visualize each trigger and re-arm event in real time.
Key features
-Multi-session ORB logic (Tokyo, London, New York)
-10-minute confirmation filter to validate breakouts
-Automatic alert re-arming when price re-enters range
-Combined per-bar alert messages (no duplicates)
-Optional on-chart labels and debug diagnostics
-Optimized for watchlists and multi-symbol scanners
Usage
Designed for day traders and momentum scalpers, this tool highlights early directional strength during market opens.
Add it to your chart, enable your preferred sessions, and set alert conditions for “ORB Breakouts (BUY),” “ORB Breakdowns (SELL),” or "Any alert() function call" You’ll receive one concise message each bar showing exactly which symbols broke out and in which direction.
DISCLAIMER:
This script is for educational and informational purposes only.
It does not constitute financial advice or a recommendation to buy or sell any security.
Always perform your own due diligence and backtesting before using any trading strategy live.
Trading involves risk; past performance does not guarantee future results.

Top Finder & Dip Hunter [BackQuant]Top Finder & Dip Hunter
A practical tool to map where price is statistically most likely to exhaust or mean-revert. It builds objective support for dips and resistance for tops from multiple methodologies, then filters raw touches with volume, momentum, trend, and price-action context to surface higher-quality reversal opportunities.
What this does
Draws a Dip Support line and a Top Resistance line using the method you select, or a blended hybrid.
Evaluates each touch/penetration against Quality Filters and assigns a 0–100 composite score.
Prints clean DIP and TOP signals only when depth/extension and quality pass your thresholds.
Optionally annotates the chart with the computed quality score at signal time.
Why it’s useful
Objectivity: Converts vague “looks extended” into rules, reduces discretion creep.
Signal hygiene: Filters raw touches using trend, volume, momentum, and candle structure to avoid obvious traps.
Adaptable regimes: Switch methods, sensitivity, and lookbacks to match choppy vs trending conditions.
How support and resistance are built
Pick one per side, or use “Hybrid.”
Dynamic: Anchors to the extreme of a lookback window, padded by recent ATR, so buffers expand in volatile periods and contract when calm.
Fibonacci: Uses the 0.618/0.786 retracement pair inside the current swing window to target common reaction zones.
Volatility: Uses a moving-average basis with standard-deviation bands to capture statistically stretched moves.
Volume-Weighted: Centers off VWAP and penalizes deviations using dispersion of price around VWAP, helpful on intraday instruments.
Hybrid: A weighted average of the above to smooth out single-method biases.
When a touch becomes a signal
Depth/extension test:
Dips must penetrate their support by at least Min Dip Depth % .
Tops must extend above resistance by at least Min Top Rise % .
Quality Score gate: The composite must clear Min Quality Score . Components:
Trend alignment: Favor dips in bullish regimes and tops in bearish regimes using EMAs and RSI.
Volume confirmation: Reward expansion or spikes versus a 20-period baseline.
RSI context: Prefer oversold for dips, overbought for tops.
Momentum shift: Look for short-term momentum turning in the expected direction.
Candle structure: Reward hammer/shooting-star style responses at the level.
How to use it
Pick your regime:
Range/chop, small caps, mean-revert intraday → Volatility or Volume Weighted .
Cleaner swings/trends → Dynamic or Fibonacci .
Unsure or mixed conditions → Hybrid .
Set windows: Start with Lookback = 50 for both sides. Increase in higher timeframes or slow assets, decrease for fast scalps.
Tune sensitivity: Raise Dip/Top Sensitivity to widen buffers and reduce noise. Lower to be more aggressive.
Gate with quality: Begin with Min Quality Score = 60 . Push to 70–80 for cleaner swing entries, relax to 50–60 for scalps.
Act on first prints: The script only fires on new qualified events. Use the score label to prioritize A-setups.
Typical workflows
Intraday futures/crypto: Volume-Weighted or Volatility methods for both sides, higher Sensitivity , require Volume Filter and Momentum Filter on. Look for DIP during opening drive exhaustion and TOP near late-session fatigue.
Swing equities/FX: Dynamic or Fibonacci with moderate sensitivity. Keep Trend Filter on to only take dips above the 200-EMA and tops below it.
Countertrend scouts: Lower Min Dip Depth % / Min Top Rise % slightly, but raise Min Quality Score to compensate.
Reading the chart
Lines: “Dip Support” and “Top Resistance” are the current actionable rails, lightly smoothed to reduce flicker.
Signals: “DIP” prints below bars when a qualified dip appears, “TOP” prints above for qualified tops.
Scores: Optional labels show the composite at signal time. Favor higher numbers, especially when aligned with higher-timeframe trend.
Background hints: Light highlights mark raw touches meeting depth/extension, even if they fail quality. Treat these as early warnings.
Tuning tips
If you get too many false DIP signals in downtrends, raise Min Dip Depth % and keep Trend Filter on.
If tops appear late in squeezes, lower Top Sensitivity slightly or switch top side to Fibonacci .
On assets with erratic volume, prefer Volatility or Dynamic methods and down-weight the Volume Filter .
For strict systems, increase Min Quality Score and require both Volume and Momentum filters.
What this is not
It is not a blind reversal signal. It’s a structured context tool. Combine with your risk plan and higher-timeframe map.
It is not a guarantee of mean reversion. In strong trends, expect fewer, higher-score opportunities and respect invalidation quickly.
Suggested presets
Scalp preset: Lookback 30–40, Sensitivity 1.2–1.5, Quality ≥ 55, Volume & Momentum filters ON.
Swing preset: Lookback 75–100, Sensitivity 1.0–1.2, Quality ≥ 70, Trend & Volume filters ON.
Chop preset: Volatility/Volume-Weighted methods, Quality ≥ 60, Momentum filter ON, RSI emphasis.
Input quick reference
Dip/Top Method: Choose the model for each side or “Hybrid” to blend.
Lookback: Swing window the levels are built from.
Sensitivity: Scales volatility padding around levels.
Min Dip Depth % / Min Top Rise %: Minimum breach/extension to qualify.
Quality Filters: Trend, Volume, Momentum toggles, plus Min Quality Score gate.
Visuals: Colors and whether to print score labels.
Best practices
Map higher-timeframe trend first, then act on lower-timeframe DIP/TOP in the trend’s favor.
Use the score as triage. Skip mediocre prints into news or at session open unless score is exceptional.
Pre-define stop placement relative to the level you used. If a DIP fails, exit on loss of structure rather than waiting for the next print.
Bottom line: Top Finder & Dip Hunter codifies where reversals are most defensible and only flags the ones with supportive context. Tune the method and filters to your market, then let the score keep your playbook disciplined.

GC Scalping Plan - No Stop LossLevels for Gold...........................................................................................................................................................

MechArt Moving Average and % Above V1.1MechArt Moving Average and % Above V1.1
Unlock the power of custom analysis with this Adjustable Moving Average Indicator! Whether you're a day trader, swing trader, or long-term investor, this tool helps you track price action with precision and flexibility. Tailor your trading strategy to your needs by adjusting the type of moving average, price triggers, and percentage levels.
🔑 Key Features:
Choose Your Moving Average Type 🌀
Select from four popular moving averages:
SMA (Simple Moving Average)
EMA (Exponential Moving Average)
WMA (Weighted Moving Average)
VWMA (Volume Weighted Moving Average)
Find the one that best fits your trading style!
Adjustable Trigger Price
Choose between four price types to trigger signals:
Open
High
Low
Close
Pick the price type that makes the most sense for your strategy!
Percentage Above the Moving Average 📈🔽
Set a custom percentage above the moving average to generate alerts when the price reaches key levels.
Customizable Alerts 🔔
Get notified when the price is above the target price or below the moving average. Perfect for timely trades!
📉 Visual Alerts:
🔴 Red Background: When the selected price is above the target price (percentage above the moving average).
🟩 Green Background: When the selected price is below the moving average.
🚀 How This Indicator Helps You:
Precision 🎯: Visual signals with clear red and green backgrounds help you make quick decisions based on the price's relationship to your moving average.
Flexibility 🔄: Customize the type of moving average and the price used for triggers to fit your trading style.
📊 Perfect For:
Swing Traders 📈: Use the indicator to identify price trends and reversals based on moving averages.
Day Traders ⏳: Set short-term percentage levels to catch immediate price movements.
Long-Term Investors 💼: Track longer-term trends and set alerts when prices deviate significantly from your moving average.
Take control of your trading strategy with this Adjustable Moving Average Indicator and start making more informed decisions today! 🏅
Change from V1.0: Fixed Timeframe setting to match chart.

Pannello Multi-Account con Spread e Dimensione Regolabile📘 Indicator Description: Multi-Account Execution Panel with Spread-Adjusted Risk
This indicator is designed for traders who manage multiple accounts with different capital sizes and execution models—such as a personal account and a prop firm account. It provides a visual panel that calculates and displays the ideal position size for each account, factoring in stop loss, spread, and risk preferences.
🔧 Key Features:
- Manual risk input in USD for the personal account (e.g., $2, $5, $10)
- Percentage-based risk for the prop firm account (e.g., 1% of €5,000)
- Spread-adjusted stop loss for each account, ensuring accurate risk calculation
- Real-time pip value calculation based on the current symbol
- Position size output:
- In units for the personal account
- In standard lots for the prop firm account
- Adjustable table size (Compact, Standard, Extended) to fit your screen and workflow
🧠 Ideal for:
- Traders who execute sequentially across multiple accounts
- Those who want precise, spread-aware sizing without manual calculations
- Discretionary strategies that require visual clarity and execution discipline
Italian

Panel Multi-Cuenta con Spread y Tamaño Ajustable📘 Indicator Description: Multi-Account Execution Panel with Spread-Adjusted Risk
This indicator is designed for traders who manage multiple accounts with different capital sizes and execution models—such as a personal account and a prop firm account. It provides a visual panel that calculates and displays the ideal position size for each account, factoring in stop loss, spread, and risk preferences.
🔧 Key Features:
- Manual risk input in USD for the personal account (e.g., $2, $5, $10)
- Percentage-based risk for the prop firm account (e.g., 1% of €5,000)
- Spread-adjusted stop loss for each account, ensuring accurate risk calculation
- Real-time pip value calculation based on the current symbol
- Position size output:
- In units for the personal account
- In standard lots for the prop firm account
- Adjustable table size (Compact, Standard, Extended) to fit your screen and workflow
🧠 Ideal for:
- Traders who execute sequentially across multiple accounts
- Those who want precise, spread-aware sizing without manual calculations
- Discretionary strategies that require visual clarity and execution discipline
Spanish

MechArt Moving Average and % Above V1.0MechArt Moving Average and % Above V1.0
Unlock the power of custom analysis with this Adjustable Moving Average Indicator! Whether you're a day trader, swing trader, or long-term investor, this tool helps you track price action with precision and flexibility. Tailor your trading strategy to your needs by adjusting the type of moving average, price triggers, and percentage levels.
🔑 Key Features:
Choose Your Moving Average Type 🌀
Select from four popular moving averages:
SMA (Simple Moving Average)
EMA (Exponential Moving Average)
WMA (Weighted Moving Average)
VWMA (Volume Weighted Moving Average)
Find the one that best fits your trading style!
Adjustable Trigger Price
Choose between four price types to trigger signals:
Open
High
Low
Close
Pick the price type that makes the most sense for your strategy!
Percentage Above the Moving Average 📈🔽
Set a custom percentage above the moving average to generate alerts when the price reaches key levels.
Customizable Alerts 🔔
Get notified when the price is above the target price or below the moving average. Perfect for timely trades!
📉 Visual Alerts:
🔴 Red Background: When the selected price is above the target price (percentage above the moving average).
🟩 Green Background: When the selected price is below the moving average.
📅 Adjustable Timeframe:
Choose the timeframe that suits you! Whether you're trading on a 1-minute chart, 1-hour, 1-day, or 1-week, this indicator works for all timeframes.
🚀 How This Indicator Helps You:
Precision 🎯: Visual signals with clear red and green backgrounds help you make quick decisions based on the price's relationship to your moving average.
Flexibility 🔄: Customize the type of moving average and the price used for triggers to fit your trading style.
📊 Perfect For:
Swing Traders 📈: Use the indicator to identify price trends and reversals based on moving averages.
Day Traders ⏳: Set short-term percentage levels to catch immediate price movements.
Long-Term Investors 💼: Track longer-term trends and set alerts when prices deviate significantly from your moving average.
Take control of your trading strategy with this Adjustable Moving Average Indicator and start making more informed decisions today! 🏅

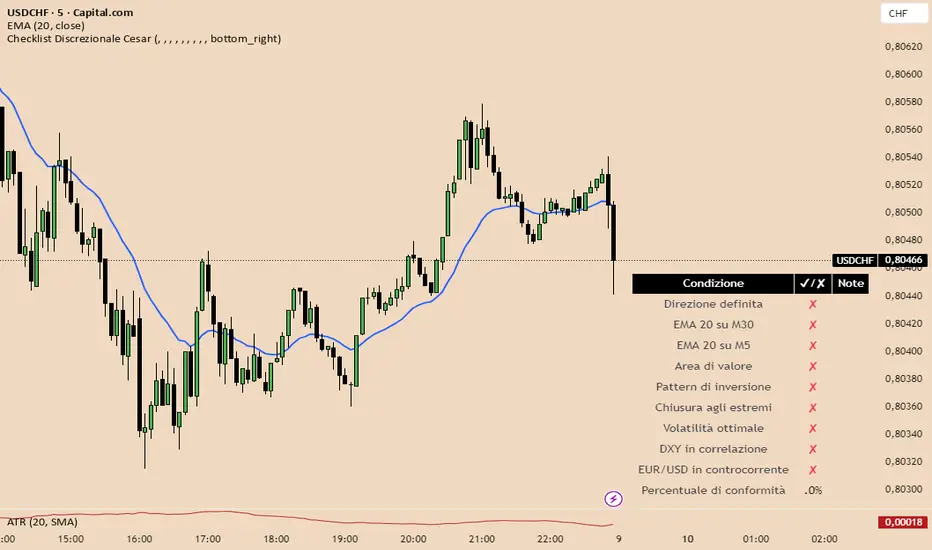
Checklist Discrezionale USdCHf 2025 Cesar Italiano📘 Indicator Description: Discretionary Checklist with Weighted Scoring and Visual Validation
This advanced Pine Script indicator is built for discretionary traders who want to structure their decision-making without sacrificing flexibility. It provides a customizable checklist that evaluates multiple technical, contextual, and macroeconomic criteria—each with its own weight in the overall score.
🔧 Key Features:
- On-screen visual checklist, with items triggered manually or by automated conditions
- Weighted scoring system, allowing you to prioritize high-impact criteria like market structure, confluence, or macro context
- Setup validation logic: displays a confidence bar or traffic light based on total score
- Optional integration with news zones, sentiment indicators, and risk management modules
- Conditional activation: can trigger alerts or unlock other tools only when the setup meets a minimum quality threshold
🧠 Ideal for:
- Traders who blend technical analysis, macro context, and discretionary judgment
- Prop firm evaluations or capital scaling workflows
- Strategies that require visual control, partial automation, and structured decision-making
Italian