Candlestick analysis
Multi Hourly ATP (Average Trade Price)"Multi-timeframe average trade price" analysis combines two concepts: using the Average Trade Price (ATP) as a benchmark and applying a multi-timeframe analysis (MTFA) trading strategy. The benefits stem from using the ATP for position management and MTFA for better-informed trading decisions.
Benefits of Averaging the Trade Price
Averaging the trade price (using methods like "averaging down" or "averaging up," or the Volume-Weighted Average Price - VWAP) helps investors manage their positions and costs.
Better Cost Basis Assessment: The ATP provides a clear benchmark for your overall cost per share, including fees. This helps you understand your true breakeven point and accurately assess whether a position is currently profitable or at a loss.
Risk Mitigation: In a falling market, buying more shares at a lower price (averaging down) reduces the average purchase price, which means the stock does not have to recover to its initial price for you to break even or make a profit.
Profit Accumulation: In a rising market, buying more shares as the price increases (averaging up or pyramiding) allows you to accumulate more profits if the upward trend continues, increasing your overall position size in a winning trade.
Emotional Discipline: By following a predefined averaging strategy, traders can reduce the impact of emotional decisions like panic selling or holding onto losing trades for too long.
Managing Volatility: Averaging helps smooth out the impact of short-term price fluctuations on your overall portfolio performance, which is particularly useful in volatile markets.

First Presented FVGSummary: First Presented FVG Indicator
This is a Pine Script v6 TradingView indicator that identifies and visualizes the first Fair Value Gap (FVG) that forms within configurable time windows during a trading session.
What it Does
1. Detects FVGs : Uses the classic 3-candle FVG definition:
- Bullish FVG: When low > high (gap up)
- Bearish FVG: When high < low (gap down)
2. "First Presented" Logic : For each configured time slot, it captures only the first qualifying FVG that forms—subsequent FVGs in that window are ignored.
3. Visual Display :
- Draws a colored box spanning from detection time to session end
- Optional text label showing detection time (e.g., "9:38 Tue FP FVG")
- Optional grade lines at 25%, 50%, and 75% levels within the FVG
Key Configuration
Setting Description
Timeframe Only works on 5-minute charts or lower
Timezone IANA timezone for session times (default: America/New_York)
Session Futures trading hours (default: 1800-1715)
Min FVG Size Minimum gap size in ticks to qualify
4 Time Slots Each with enable toggle, time window, and color
Default Time Slots
Slot 1 (enabled): 09:30-10:30 — lime green
Slot 2 (enabled): 13:30-14:30 — blue
Slot 3 (disabled): 13:00-13:30 — teal
Slot 4 (disabled): 14:15-14:45 — fuchsia
Technical Features
Handles cross-midnight sessions correctly
Resets all drawings at each new session
Skips the first bar of each window to ensure valid 3-candle lookback
Clamps slot windows to session boundaries

avax by dionfor adding liquidity for view the trend then avax foundation adding liquidity whats the price action


CVD Divergence Background By HKOverview This indicator visualizes Delta Divergences (also known as Absorption) directly on your main chart. It highlights candles where the price direction contradicts the underlying net volume flow (CVD). This is a powerful method to spot "traps," limit order absorption, and potential reversals.
How it Works The script calculates the Intrabar Volume Delta based on price action relative to the candle's range. It then compares this Delta with the candle's color (Open vs. Close).
Bearish Divergence (Absorption Top):
Scenario: The candle is GREEN (Price closed higher), but the Volume Delta is NEGATIVE (Net Selling).
Visual: Red Background.
Meaning: Sellers are aggressively absorbing the buying pressure via limit orders. Price struggled to rise despite the volume.
Bullish Divergence (Absorption Bottom):
Scenario: The candle is RED (Price closed lower), but the Volume Delta is POSITIVE (Net Buying).
Visual: Green Background.
Meaning: Buyers are aggressively absorbing the selling pressure via limit orders. Price struggled to fall despite the volume.
Features
Background Highlighting: Instantly spot divergences without checking a separate oscillator window.
Seamless Integration: Works perfectly behind your price candles and other indicators (like Big Trade detectors).
Customizable: You can adjust the colors and transparency to fit your chart theme.
Use Case Use this to identify exhausted moves. If you see a green candle with a red background at a resistance level, it suggests that buyers are running into a wall of sellers, increasing the probability of a reversal.

Fuerza Relativa vs SPY (Oleos Capital) RS Rating shaded, blue arrow when a crossover with the black line (SPY) occurs and the RS rating according to the period above right to see the evolution of the asset.

Custom ORB (Adjustable Time + Alerts)Opening range Breakout for the current day only. Time frame and be adjusted for first 15 min, 30 min, e.g., 9:30 am to 9:45 am or to 10 am, etc. You can add price alerts for high and low. You can also change the color of solid lines.

Absorption Detector-NuchSource: Prof Michael G.
Credit: GreatestUsername for the coding & implementation.
Zones of Support and Resistance can feel like drawing boxes on the chart. This indicator to help spot areas of possible reversal. It uses Volume Confirmation and Body-to-Wick Ratio to do this and defined as:
1. Volume Confirmation
High Volume: A candle that absorbs sitting limit orders is often accompanied with higher than average volume. The indicator define this type of candle if it has a volume is greater than 250%/350% of the average volume over the last 10 candles.
2. Body-to-Wick Ratio
Body vs. Wick: A candle with a small body and large wicks can indicate higher probability of reversal. You can define an absorption candle if the body of the candle is less than 50% of the total range (high-low).
These settings are also customizable to your own desired settings and should be used as a visual aid.

Bull/Bear vs Base vs Index (% Change Spread)Visualizes the performance gap ("Beta Decay") between 3x Leveraged ETFs (SOXL/SOXS) and their underlying sector (SOXX), relative to the S&P 500 (SPY).
This indicator is designed for traders who trade leveraged products (like SOXL/SOXS, TQQQ/SQQQ) and need to see true relative strength beyond simple price action.
It calculates the percentage change over a user-defined lookback period for four instruments:
Base (1x): The sector benchmark (Default: SOXX).
Bull (3x): The leveraged long ETF (Default: SOXL).
Bear (-3x): The leveraged inverse ETF (Default: SOXS).
Index: The broad market zero-line (Default: SPY).
It then plots the Spread to reveal the health of the trend:
Bull Spread (Green Line): Bull % - Base %
Bear Spread (Red Line): Bear % - Base %
Base vs Index (Filled Area): Base % - SPY %
🧠 The Logic: Why Use Spreads?
In a perfectly efficient trending market, a 3x Bull ETF should move exactly 300% of the underlying asset. However, in choppy or volatile markets, volatility decay (beta slippage) causes leveraged ETFs to underperform mathematically.
Positive Spread: The leveraged ETF is successfully capturing momentum (The "Sweet Spot").
Negative Spread: The leveraged ETF is suffering from drag or the underlying asset is chopping.
📈 Recommended Trading Plan
Note: This indicator works best as a filter for entry conditions, not a standalone signal. Always use proper risk management.
Strategy A: The "Clean Trend" (Momentum)
Goal: Enter a 3x position only when volatility drag is minimal.
1. Bull Signal:
Condition 1: The Base vs Index (Area) is Green (Sector is outperforming SPY).
Condition 2: The Bull Spread (Green Line) is Positive (> 0).
Why: This confirms the sector is strong AND the 3x ETF is amplifying that move efficiently without decay eating the profits.
2. Bear Signal:
Condition 1: The Base vs Index (Area) is Red (Sector is lagging SPY).
Condition 2: The Bear Spread (Red Line) is Positive (> 0).
Why: This confirms the sector is crashing and the Bear ETF is successfully capturing the downside momentum.
Strategy B: The "Decay Avoidance" (Cash is King)
Goal: Avoid leveraged funds during chop.
Condition: If BOTH the Bull Spread and Bear Spread are Negative (< 0) (below the zero line).
Action: Stay in Cash or trade the 1x underlying (SOXX) only.
Why: When both spreads are negative, it mathematically proves that the market is too choppy for leverage. Both the Long and Short leveraged funds are losing value relative to the underlying asset.
Features:
Pine Script® v6: Updated for the latest engine performance and visuals.
Dashboard Table: Real-time percentage spreads displayed directly on the chart (customizable position).
Fully Customizable: Works on any sector (e.g., set inputs to QQQ/TQQQ/SQQQ for Tech).
Disclaimer:
Trading leveraged ETFs involves significant risk. This script is for educational purposes only.

SMT Divergence [Kodexius]SMT Divergence is a correlation-based divergence detector built around the Smart Money Technique concept: when two normally correlated instruments should be making similar swing progress, but one prints a new extreme while the other fails to confirm it. This “disagreement” can be a valuable contextual signal around liquidity runs, distribution phases, and potential reversal or continuation points.
The script compares the chart symbol (primary) with a user-selected comparison symbol (for example BTC vs ETH, ES vs NQ, EUR/USD vs GBP/USD) and automatically scans both instruments for confirmed swing highs and swing lows using pivot logic. Once swings are established, it checks for classic SMT conditions:
Primary makes a new swing extreme while the comparison symbol forms a non-confirming swing .
To support a wider range of markets, the indicator includes an Inverse Correlation option for pairs that typically move opposite to each other (for example DXY vs EUR/USD). With this enabled, the divergence rules are logically flipped so that the script still detects “non-confirmation” in a way that is consistent with the pair’s relationship.
The indicator is designed to be readable and actionable. It can draw divergence labels directly on the main chart, connect the relevant swing points with lines, show a compact information table with the last signal and settings, and optionally render the comparison symbol as a mini candle chart in the indicator pane for quick visual validation.
🔹 Features
🔸 Two-Symbol SMT Analysis (Primary vs Compare)
Select any comparison symbol to evaluate correlation structure and divergence. The script fetches the comparison OHLC data using the current chart timeframe to keep both series aligned for analysis.
🔸 Inverse Correlation Mode
For inversely correlated pairs, enable “Inverse Correlation” so the script interprets confirmation appropriately (for example, a higher low on the comparison instrument might be expected to correspond to a lower low on the primary, depending on the relationship). This helps avoid false conclusions when the pair naturally moves opposite.
🔸 Pivot-Based Swing with Adjustable Sensitivity
Swings are detected using confirmed pivots (left bars and right bars). This provides cleaner structural swing points compared with raw candle-to-candle comparisons, and it lets you control sensitivity for different market conditions and timeframes. The script also limits stored swing history to keep performance stable.
🔸 Flexible Detection Mode: Time Matched or Independent Swings
You can choose how swings are paired across instruments:
Time Matched searches for a comparison swing that occurred at the same pivot time as the primary swing.
Independent Swings compares each symbol’s own last two swings without requiring an exact time match.
🔸 Range Control and Noise Filtering
To reduce weak or irrelevant signals:
“Max Bars Between Swings” ensures the two swings being compared are close enough in structure to be meaningful.
“Min Price Diff (%)” can require a minimum percentage change between the primary’s last two swing prices to confirm the move is significant.
🔸 Clear Visual Output with Tooltips
When a divergence is detected, the script can print a label (“SMT”) with bullish or bearish styling and a tooltip that includes the symbol pair and the primary swing price for quick context.
🔸 Divergence Lines for Context
Optional lines connect the relevant swing points, making it easier to see the exact structure that triggered the signal. One line can be drawn on the main chart and another in the indicator pane for the comparison series.
🔸 Info Table (At a Glance)
A compact table can display the active symbols, correlation mode, total divergences stored, and the most recent signal type.
🔸 Alerts Included
Built-in alert conditions are provided for bullish SMT, bearish SMT, and any SMT event so you can automate notifications without editing the code.
🔸 Optional Comparison Candle Panel
If enabled, the indicator can plot the comparison symbol as candles in the indicator pane. This is useful for confirming whether the divergence is happening around major levels, consolidations, or impulsive legs on the secondary instrument.
🔹 Calculations
This section summarizes the core logic used by the script.
1. Data Synchronization (Comparison Symbol)
The comparison instrument is requested on the chart’s current timeframe so swing calculations are performed consistently:
=
request.security(compareSymbolInput, timeframe.period, )
This ensures pivots and swing times are derived from the same bar cadence as the primary chart.
2. Swing Detection via Confirmed Pivots
Swings are detected using pivot logic with user-defined left and right bars:
primaryPivotHigh = ta.pivothigh(high, pivotLeftBars, pivotRightBars)
primaryPivotLow = ta.pivotlow(low, pivotLeftBars, pivotRightBars)
Because pivots are confirmed only after the “right bars” have closed, the script stores each swing using an offset so the swing’s bar index and time reflect where the pivot actually occurred, not where it was confirmed.
3. Swing Storage and Retrieval
Both symbols maintain arrays of SwingPoint objects. Each new swing is pushed into the array, and older swings are dropped once the array exceeds the configured maximum. This makes the divergence engine predictable and prevents uncontrolled memory growth.
The script then retrieves the last and previous swing highs and lows (per symbol) to evaluate structure.
4. Matching Logic (Time Matched vs Independent)
When “Time Matched” is selected, the script searches the comparison swing array for a pivot that occurred at the exact same timestamp as the primary swing. When “Independent Swings” is selected, it simply uses the comparison symbol’s last two swings of the same type.
5. Bullish SMT Condition (LL vs HL)
A bullish SMT event is defined as:
Primary forms a lower low (last low < previous low)
Comparison forms a higher low (last low > previous low)
If inverse correlation is enabled, the comparison condition flips to maintain logical confirmation rules
The two primary swings must be within the configured bar distance window
Optional minimum percentage difference must be satisfied
A simple anti duplication rule prevents repeated triggers on the same structure
These checks are implemented directly in the bullish detection block.
6. Bearish SMT Condition (HH vs LH)
A bearish SMT event is defined as:
Primary forms a higher high (last high > previous high)
Comparison forms a lower high (last high < previous high)
Inverse correlation flips the comparison rule
Range checks, minimum difference filtering, and duplicate protection apply similarly
These checks are implemented in the bearish detection block.
7. Percentage Difference Filter
The optional “Min Price Diff (%)” filter measures the relative distance between the last two primary swing prices. This prevents very small structural changes from being treated as valid SMT signals.
priceDiffPerc = math.abs(lastSwing.price - prevSwing.price) / prevSwing.price * 100.0
The divergence condition is only allowed to trigger if this value exceeds the user defined threshold.
priceOk = priceDiffPerc >= minPriceDiff
This filter is especially useful on higher timeframes or during low volatility conditions, where micro structure noise can otherwise produce misleading signals.
8. Visualization and Output
When a divergence is confirmed, the script:
Stores the event in a divergence array (limited by “Max Divergences to Display”)
Draws a directional SMT label with a tooltip (optional)
Draws connecting lines using time based coordinates for clean alignment (optional)
It also updates an information table on the last bar only, and exposes alertconditions for automation workflows.

Midnight Opening RangeThis script uses the SMC/ICT midnight opening range to gain insight into the daily highs and lows.
It plots the opening range quadrants and the 0.5 and 1 standard deviations higher and lower.
These levels are often used as support/resistance at certain times of the day.
To be used in concert with other PD arrays.


MGC1! Sniper Levels [NY Midnight + PDH/PDL + VWAP]This script, titled "MGC1! Sniper Levels ," is a specialized institutional-grade technical indicator designed for intraday trading on Micro Gold (MGC1!) futures. It merges Time & Price theory with Statistical Volatility to create a comprehensive roadmap for high-probability "Sniper" entries.
Core Technical Components
NY Midnight Pivot: Automatically identifies and plots the New York Midnight opening price. This level serves as the "True Open" for the daily session, helping traders determine whether the market is in a Premium or Discount zone relative to the daily start.
Previous Day Structure (PDH/PDL): Displays the Previous Day’s High and Low using a background security call. These levels are primary targets for Liquidity Sweeps (trapping retail traders) before a reversal occurs.
Advanced Session VWAP: Calculates the Volume Weighted Average Price starting from the session open. Unlike a standard moving average, VWAP represents the true fair value based on actual capital commitment.
Standard Deviation Extensions (SD 1, 2, 3): Plots three layers of volatility bands based on the variance of price and volume.
SD1 & SD2: Act as dynamic support and resistance within normal market conditions.
SD3 (Extreme Zones): Highlights the "Extreme Long" and "Extreme Short" zones, representing areas where 99.7% of price action is statistically contained, often leading to sharp mean-reversion moves.
Key Features & Interface
Customizable Labels: Includes a specific toggle to show or hide Standard Deviation labels. This allows for a cleaner chart when focusing on ICT/SMC price action while maintaining the colored "Zones" for visual context.
Real-Time Vignettes: High-contrast labels appear at the right edge of the price action, providing the exact numerical value of every key level (VWAP, PDH, NY Midnight) for immediate order execution.
Previous VWAP Close: Plots the final VWAP value from the prior session. This level often acts as a magnetic "fair value" target during the current session's open.
Strategic Trading Application
The script is built for the Gold Sniper MGC1! persona to identify "Smart Money" reversals. A typical setup involves waiting for price to reach an SD3 Extreme Zone that coincides with the PDH or PDL. Once the price "sweeps" these levels and shows a Market Structure Shift (MSS) back toward the VWAP, a high-probability trade is triggered.

AI PRE-MARKET PRO - True/Fake Gap Classification-Version 1.0## **AI PRE-MARKET PRO: QUICK START GUIDE**
This indicator classifies market gaps by comparing the **Current Price** to yesterday’s **High (PDH)**, **Low (PDL)**, and **Close (PDC)**.
### **1. GAP CLASSIFICATIONS**
* **🔥 TRUE GAPS (High Momentum)**
* **True Gap Up:** Price is above PDH. The market is in "Discovery Mode." High probability of trend continuation.
* **True Gap Down:** Price is below PDL. Significant bearish sentiment. High probability of further selling.
* **⚠️ FAKE GAPS (Mean Reversion)**
* **Fake Gap Up:** Above PDC but below PDH. Price is "trapped" in yesterday's value. Often reverts to the Close (PDC).
* **Fake Gap Down:** Below PDC but above PDL. Price is "trapped." Often bounces back toward the Close (PDC).
### **2. TRADING STRATEGY CHEAT SHEET**
| Scenario | Primary Play | Entry Logic |
| --- | --- | --- |
| **True Gap Up** | **Continuation** | Wait for a pullback to **PDH**; buy the hold. |
| **True Gap Down** | **Continuation** | Wait for a rally to **PDL**; short the rejection. |
| **Fake Gap Up** | **Fade/Range** | Short the rejection of **PDH** or **ONH**; target **PDC**. |
| **Fake Gap Down** | **Fade/Range** | Buy the bounce at **PDL** or **ONL**; target **PDC**. |
### **3. CRITICAL LEVELS ON YOUR CHART**
* **PDH / PDL:** The "Line in the Sand." Breaking these turns a Fake Gap into a True Gap.
* **ONH / ONL:** Overnight High/Low. These are your immediate support/resistance targets for the first 30 minutes of trading.
* **PDC:** Previous Day Close. The "Magnet." If the market doesn't trend, it usually returns here.
### **4. HOW TO READ THE AI TABLES**
* **Left Table:** Shows real-time distance (RT Δ) to key levels and whether they have been hit yet (**Mitigated**).
* **Bottom Tables:** Provide a probability-based "Game Plan" and specific execution rules (e.g., "Wait for 15-minute confirmation").
---
**Next Step:** Would you like me to show you how to set up an alert for when the price crosses the **PDH** or **PDL** to catch a True Gap breakout?

Wide Bodied Bar (WBB) IdentifierThis script is inspired by Peter L.Brandt's Wide Bodied Bar/WBB. It uses ATR to detect the wide bodied bars. Peter prefered WBB's for his entries. I believe this bar made him feel that the breakout is real and will continue on the same direction as the breakout. Enjoy

Enhanced Swing Trading Confluence [Hidden Div Bonus + Dashboard]powerful swing trading indicator combining multiple confluence factors for high-probability setups.
This indicator identifies premium long and short opportunities by requiring alignment across:
• Trend direction (price above/below 200 EMA + optional 50/100/200 EMA stacking)
• RSI oversold/overbought conditions (with optional strict crossover requirement)
• MACD line/signal crossover
• Price touching Bollinger Band extremes
• Optional Bollinger Band squeeze (low volatility contraction)
• Optional volume spike confirmation
Features:
• Clean entry arrows for ready signals
• Real-time confluence dashboard showing which conditions are met
• Accurate regular RSI divergence detection (reversal signals)
• Hidden RSI divergence detection (trend continuation signals)
• Optional use of recent hidden divergence as a bonus confirmation filter
• Customizable inputs and alerts
Ideal for swing traders seeking multi-factor confirmation before entries. Works across all markets and timeframes. Alerts fire only when full confluence is achieved for disciplined, high-quality trade setups.

EMA SMA Rhythmic Lite Public V1.1 by SRTEMA SMA Rhythmic Lite Public V1.1 by SRT
A clean, lightweight trend-rhythm engine designed for traders of all levels. Built on a robust combination of EMAs and SMAs, this indicator provides clear directional bias signals while remaining fully non-repainting.
Key Features:
Multi-Timeframe Friendly: Works seamlessly on M1 to Daily (D) charts. MA stacking and signal logic automatically adapt to any timeframe.
Bias Detection: Determines bullish, bearish, or neutral market conditions using a 4-MA stack.
Engulfing Bar (EB) & Long-Tail Body (LTB) Detection: Highlights strong price action setups, filtered by body size and ATR-based thresholds.
Flush Markers: Visual cues showing where price aligns with MA stack for trend confirmation.
Bias Table: Displays current MA bias and presence of LTB on the chart for at-a-glance clarity.
Advanced Alerts:
Flush Alerts: Trigger when MA stack aligns with price, signaling trend continuation.
Combo Alerts: Trigger when EB or LTB appears in alignment with MA bias.
LTB-only Alerts: For monitoring significant price action reversals.
Customizable Visualization: Colors, widths, and visibility of all MAs, labels, and flush dots can be tailored to your preference.
Why Lite?
This is the most lightweight version in the SRT rhythm series, optimized for any timeframe, from scalping to swing trading. Perfect for traders who want a clear bias engine without unnecessary complexity.
If you like this EMA SMA Rhythmic Lite, you may also explore:
▶ H1 Bias Rhythmic Lite Public (Free)
▶ SRT Premium Series
Invite-only advanced indicators with stronger bias enforcement and execution frameworks.

10 DMA vs 20 DMA Professional Chart by hasan15 minutes chart for intraday bull and bear flag . this will gives you trend confirmation as well

Liquidity Sell Signal V2 [StrategyLAB_]Liquidity Sell Signal V2
Liquidity Sell Signal V2 is a TradingView indicator designed to help you spot high-probability Sell setups (reversal / pullback entries) using liquidity concepts around Buy-Side Liquidity (BSL) , combined with a bearish confirmation candle pattern.
OANDA:XAUUSD
This script will:
Automatically detect and plot BSL (Swing High) levels based on your selected Swing Strength.
Visually “fade” levels once price has broken above them.
Print a down triangle when a valid Bearish Liquidity Triangle forms at a qualified BSL area.
How it works
1) Identify Buy-Side Liquidity (BSL)
The indicator detects pivot highs using Swing Strength.
Each pivot high is drawn as a horizontal BSL level, keeping up to Max Buy Side Liquidity (BSL) Levels.
2) Bearish confirmation (Liquidity reaction)
A Sell signal triggers only when a bearish candle structure appears, suggesting strong selling pressure and a potential reversal after a liquidity sweep near/above BSL.
3) Noise filter (Avoid “body-cut” levels)
The script checks whether the BSL level has been repeatedly cut through candle bodies in prior bars.
If the level is considered “dirty” based on olderBodyLookback, it is filtered out to reduce false signals.
How to use
Suggested settings
Swing Strength
Lower (5–8): more levels, faster signals, but more noise.
Higher (12–20): fewer levels, cleaner zones, better for swing.
Max BSL Levels: increase if you want to keep more historical liquidity levels.
Filter lookback older bodies: increase to filter more aggressively (fewer signals, cleaner quality).
Entry idea (example)
Wait for a Sell triangle to appear (signal prints on candle close).
Prefer signals that align with:
a major swing high / key resistance,
clear rejection (wick / bearish reaction),
confluence with HTF supply, trendline, session, etc.
SL/TP idea (example)
SL: above the most recent swing high / above the BSL zone with a safety buffer.
TP: toward imbalance fill, previous lows (SSL), or a fixed RR such as 1:2 / 1:3.
Important notes
This is a probability tool, not a guaranteed signal.
Best results come from combining with market structure (BOS/CHOCH), supply/demand, HTF levels, and session context.
The script uses barstate.isconfirmed, so signals appear only after the candle closes (non-repainting signals).
OANDA:EURUSD

ZERO-LAG Tabrizi Scalping ToolKit This indicator will allow you to scalp on the 1M and 5M chart with zero lag. We will show you trend reversals and also when to buy and sell
ChanLun Structure: K/Fractals/Strokes/Segments/ZhongShuThis script implements the "line and center" concept of CHANLUN.
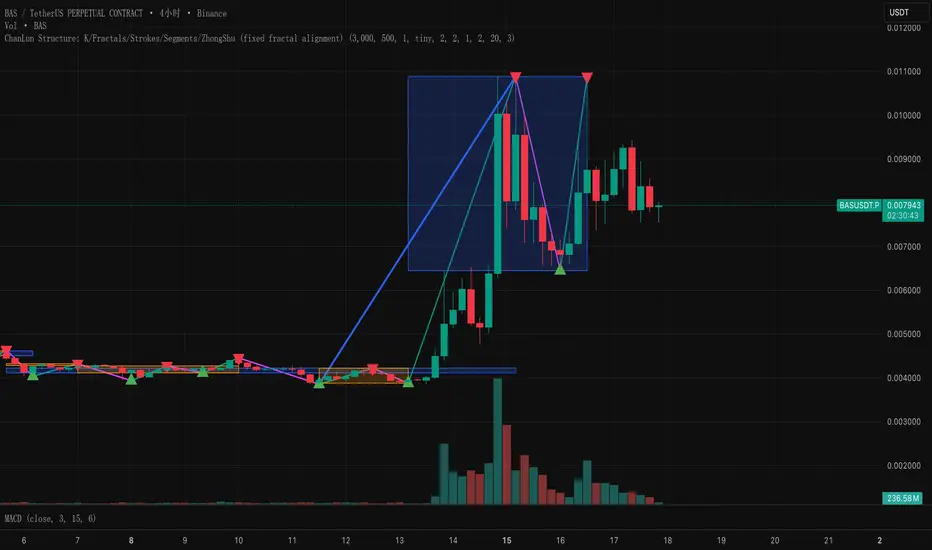
Bar CountCount K bars based on sessions
Support at most 3 sessions
Customize the session's timezone and period
Set steps between each number
Use with the built-in Trading Session indicator is a great convenience
