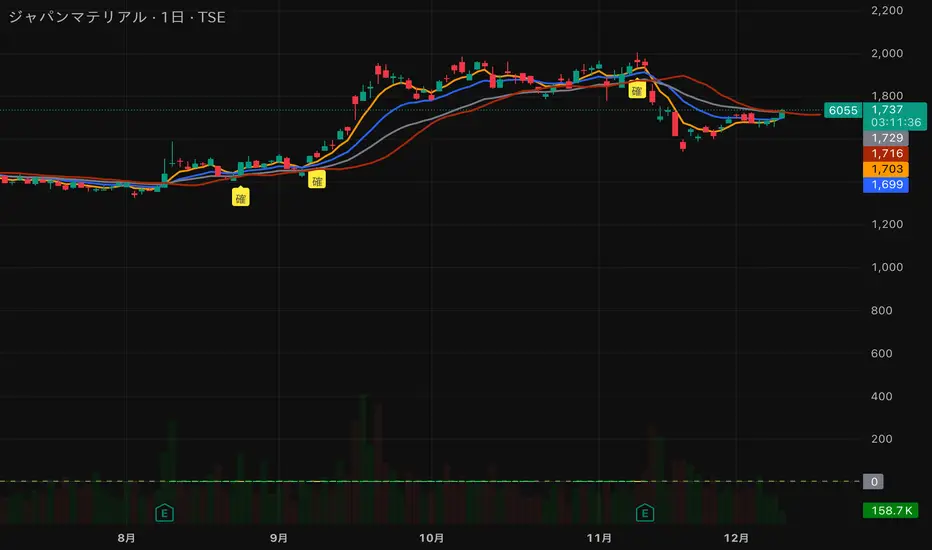
猛の掟・初動スクリーナー v3//@version=5
indicator("猛の掟・初動スクリーナー v3", overlay=true)
// ===============================
// 1. 移動平均線(EMA)設定
// ===============================
ema5 = ta.ema(close, 5)
ema13 = ta.ema(close, 13)
ema26 = ta.ema(close, 26)
plot(ema5, title="EMA5", color=color.orange, linewidth=2)
plot(ema13, title="EMA13", color=color.new(color.blue, 0), linewidth=2)
plot(ema26, title="EMA26", color=color.new(color.gray, 0), linewidth=2)
// ===============================
// 2. MACD(10,26,9)設定
// ===============================
fast = ta.ema(close, 10)
slow = ta.ema(close, 26)
macd = fast - slow
signal = ta.ema(macd, 9)
macdBull = ta.crossover(macd, signal)
// ===============================
// 3. 初動判定ロジック
// ===============================
// ゴールデン並び条件
goldenAligned = ema5 > ema13 and ema13 > ema26
// ローソク足が26EMAより上
priceAbove26 = close > ema26
// 3条件すべて満たすと「確」
bullEntry = goldenAligned and priceAbove26 and macdBull
// ===============================
// 4. スコア(0=なし / 1=猛 / 2=確)
// ===============================
score = bullEntry ? 2 : (goldenAligned ? 1 : 0)
// ===============================
// 5. スコアの色分け
// ===============================
scoreColor = score == 2 ? color.new(color.yellow, 0) : score == 1 ? color.new(color.lime, 0) : color.new(color.gray, 80)
// ===============================
// 6. スコア表示(カラム)
// ===============================
plot(score,
title="猛スコア (0=なし,1=猛,2=確)",
style=plot.style_columns,
color=scoreColor,
linewidth=3)
// 目安ライン
hline(0, "なし", color=color.new(color.gray, 80))
hline(1, "猛", color=color.new(color.lime, 60))
hline(2, "確", color=color.new(color.yellow, 60))
// ===============================
// 7. チャート上に「確」ラベル
// ===============================
plotshape(score == 2,
title="初動確定",
style=shape.labelup,
text="確",
color=color.yellow,
textcolor=color.black,
size=size.tiny,
location=location.belowbar)
Candlestick analysis
Pious 3EMA-8EMA with 89ema when the stock price is above 89 ema and 3emah is above 8emah and 3emal is above 8emal buy prefers and vice versa, other conditions are additive to it

30-Minute High and Low30-Minute High and Low Levels
This indicator plots the previous 30-minute candle’s high and low on any intraday chart.
These levels are widely used by intraday traders to identify key breakout zones, liquidity pools, micro-range boundaries, and early trend direction.
Features:
• Automatically pulls the previous 30-minute candle using higher-timeframe HTF requests
• Displays the HTF High (blue) and HTF Low (red) on lower-timeframe charts
• Works on all intraday timeframes (1m, 3m, 5m, 10m, etc.)
• Levels stay fixed until the next 30-minute bar completes
• Ideal for ORB strategies, scalping, liquidity sweeps, and reversal traps
Use Cases:
• Watch for breakouts above the 30-minute high
• Monitor for liquidity sweeps and fakeouts around the high/low
• Treat the mid-range as a magnet during consolidation
• Combine with VWAP or EMA trend structure for high-precision intraday setups
This indicator is simple, fast, and designed for traders who rely on HTF micro-structure to guide intraday execution.

Scary Flush Indicator R0Work in progress.
Calculates the gradient based on candle lows (previous low to current low). Works on all time frames.
Looks for a selling gradient of >0.75pts per minute then highlights. Anything less than this indicates a lazy grind down and indicates a potential invalidation for the FBD.

Cold Brew Ranges🧭 Core Logic and Calculation
The fundamental logic for each range (OR and CR) is identical:
Time Definition: Each range is defined by a specific Start Time and a fixed 30-second duration. The timestamp function, using the "America/New_York" time zone, is used to calculate the exact start time in Unix milliseconds for the current day.
Example: t0200 = timestamp(TZ, yC, mC, dC, 2, 0, 0) sets the start time for the 02:00 OR to 2:00:00 AM NY time.
Range Data Collection: The indicator uses the request.security_lower_tf() function to collect the High (hArr) and Low (lArr) prices of all bars that fall within the defined 30-second window, using a user-specified, sub-chart-timeframe (openrangetime, defaulted to "1" second, "30S", or "5" minutes). This ensures high precision in capturing the exact high and low during the 30-second window.
High/Low Determination: It iteratively finds the absolute highest price (OR_high) and the absolute lowest price (OR_low) recorded by the bars during that 30-second window.
Range Locking: Once the current chart bar's time (lastTs) passes the 30-second End Time (tEnd), the High and Low are locked (OR_locked = true), meaning the range calculation is complete for the day.
Drawing: Upon locking, the range is drawn on the chart using line.new for the High, Low, and Equilibrium, and box.new for the shaded fill. The lines are extended to a subsequent time anchor point (e.g., the 02:00 OR is extended to 08:20, the 09:30 OR is extended to 16:00).
Equilibrium (EQ): This is calculated as the simple average (midpoint) of the High and Low of the range.
EQ=
2
OR_High+OR_Low
⏰ Defined Trading Ranges
The indicator defines and tracks the following specific 30-second ranges:
Range Name Type Start Time (NY) Line Extension End Time (NY) Common Market Context
02:00 OR Opening 02:00:00 08:20:00 Asian/European Market Overlap
08:20 OR Opening 08:20:00 16:00:00 Pre-New York Open
09:30 OR Opening 09:30:00 16:00:00 New York Stock Exchange Open (Most significant OR)
18:00 OR Opening 18:00:00 20:00:00 Futures Market Open (Sunday/Monday)
20:00 OR Opening 20:00:00 Next Day's session start Asian Session Start
15:50 CR Closing 15:50:00 20:00:00 New York Close Range
⚙️ Key User Inputs and Customization
The script offers extensive control over which ranges are displayed and how they are visualized:
Range Time & History
openrangetime: Sets the sub-timeframe (e.g., "1" for 1 second) used to calculate the precise High/Low of the 30-second range. Crucial for accuracy.
showHistory: A toggle to show the ranges from previous days (up to a histCap of 50 days).
Range Toggles and Styling
On/Off Toggles: Independent input.bool (e.g., OR_0200_on) to enable or disable the display of each individual range.
Colors & Width: Separate color and width inputs for the High/Low lines (hlC), the Equilibrium line (eqC), and the background fill (fillC) for each range.
Line Styles: Global inputs for the line styles of High/Low (lineStyleInput) and Equilibrium (eqLineStyleInput) lines (Solid, Dotted, or Dashed).
showFill: Global toggle to enable the shaded background box that highlights the area between the High and Low.
Extensions
The script calculates and plots extensions (multiples of the initial range) above the High and below the Low.
showExt: Toggles the visibility of the extension lines.
useRangeMultiples: If true, the step size for each extension level is equal to the initial range size:
Step=Range=OR_High−OR_Low
If false, the step size is a fixed value defined by stepPts (e.g., 60.0 points, which is a common value for NQ futures).
stepCnt: Determines how many extension levels (multiples) are drawn above and below the range (default is 10).
📈 Trading Strategy Implications
The Cold Brew Ranges indicator is a tool for session-based support and resistance and range breakout/reversal strategies.
Key Support/Resistance: The High and Low of these defined opening ranges often act as strong, predefined price levels. Traders look for price rejection off these boundaries or a breakout with conviction.
Equilibrium (Midpoint): The EQ often represents a fair value for that specific session's opening. Movements away from it are seen as opportunities, and a return to it is common.
Extensions: The range extensions serve as potential profit targets or stronger, layered support/resistance levels if the market trends aggressively after the opening range is set.
The core idea is that the activity in the first 30 seconds of a significant trading session (like the NYSE or a market session open) sets a bias and initial boundary for the trading period that follows.

仓位计算器# 仓位计算器
通过开仓、止损、止盈计算固定盈亏比适合的开仓数量,根据开仓和止损判断开仓方向。
首次使用需要手动设置开仓、止盈、止损,之后可以手动拖拽价格线设置值然后自动计算仓位信息。
---
# Position Calculator
Calculates the optimal position size with a fixed profit/loss ratio based on opening, stop-loss, and take-profit levels. Determines the direction of the position based on the opening and stop-loss settings.
Initial use requires manual setting of opening, take-profit, and stop-loss. Afterward, you can manually drag the price line to set values and the system will automatically calculate position information.

FOR CRT SMT – 4 CANDLEFOR CRT SMT – 4 CANDLE Indicator
This indicator detects SMT (Smart Money Technique) divergence by comparing the last 4 candle highs and lows of two different assets.
Originally designed for BTC–ETH comparison, but it works on any market, including Forex pairs.
You can open EURUSD on the chart and select GBPUSD from the settings, and the indicator will detect SMT divergence between EUR and GBP the same way it does between BTC and ETH. This makes it useful for analyzing correlated markets across crypto, forex, and more.
🔴 Upper SMT (Bearish Divergence – Red)
Occurs when:
The main chart asset makes a higher high,
The comparison asset makes a lower high.
This may signal a liquidity grab and potential reversal.
🟢 Lower SMT (Bullish Divergence – Green)
Occurs when:
The main chart asset makes a lower low,
The comparison asset makes a higher low.
This may indicate the market is sweeping liquidity before reversing upward.
📌 Features
Uses the last 4 candles of both assets.
Automatically draws divergence lines.
Shows clear “SMT ↑” or “SMT ↓” labels.
Works on Crypto, Forex, and all correlated assets.

LiquidityPulse Higher Timeframe Consecutive Candle Run LevelsLiquidityPulse Higher Timeframe Consecutive Candle Run Levels
Research suggests that financial markets can alternate between trend-persistence and mean-reversion regimes, particularly at short (intraday) or very long timeframes. Extended directional moves, whether prolonged intraday rallies or sell-offs, also carry a statistically higher chance of retracing or reversing (Safari & Schmidhuber, 2025). In addition, studies examining support and resistance behaviour show that swing highs or lows formed after strong directional moves may act as structurally and psychologically important price levels, where subsequent price interactions have an increased likelihood of stalling or bouncing rather than passing through directly (Chung & Bellotti, 2021). By highlighting higher-timeframe candle runs and marking their extremal levels, this indicator aims to display areas where directional momentum previously stopped, providing contextual "watch levels" that traders may incorporate into their broader analysis.
How this information is used in the indicator:
When a sequence of consecutive higher-timeframe candles prints in the same direction, the indicator highlights the lower-timeframe chart with a green or red background, depending on whether the higher-timeframe run was bullish or bearish. The highest high (for a bull run) or lowest low (for a bear run) of that sequence forms a recent extremum, and this value is plotted as a swing-high or swing-low level. These levels appear only after the required number of consecutive higher-timeframe candles (set by the user) have closed, and they continue updating as long as the higher-timeframe streak remains intact. A level "freezes" and stops updating only when an opposite-colour higher-timeframe candle closes (e.g., a red candle ending a bull run, or a green candle ending a bear run). Once frozen, the level remains fixed to preserve that structural information for future analysis or retests. The number of past bull/bear levels displayed on the chart is also adjustable in the settings.
Why capture a level after a long directional run:
When price moves in one direction for several consecutive candles (e.g. 4, 5, or more), it reflects strong directional bias, often associated with momentum, liquidity imbalance, or liquidity grabs. Once that sequence breaks, the final level reached marks a point of exhaustion or structural resistance/support, where that bias failed to continue. These inflection points are often used by traders and trading algorithms to assess potential reversals, retests, or breakout setups. By freezing these levels once the run ends, the indicator creates a map of historically significant price zones, allowing traders to observe how price behaves around them over time.
Additional information displayed by the indicator:
Each detected run includes a label showing the run length (the number of consecutive higher-timeframe candles in the streak) along with the source timeframe used for detection. The indicator also displays an overstretch marker: this numerical value appears when the total size of the candle bodies within the run exceeds a user-defined multiple of the average higher-timeframe body size (default: 1.5x). This helps highlight runs that were unusually strong or extended relative to typical volatility. You can also enable alerts that trigger when this overstretch ratio exceeds a higher threshold.
Key Settings
Timeframe: Choose which HTF to analyse (e.g., 15m, 1h, 4h)
Minimum Candle Run Length: Define how many consecutive candles are needed to trigger a level (e.g., 4)
Overstretch Settings: Customize detection threshold and alert trigger (in multiples of average body size)
Background Tints: Enable/disable visual highlights for bull and bear runs
Display Capacity: Choose how many past bull/bear levels to show
How Traders Can Use This Indicator
Traders can:
-Watch levels for retests, reversals, breakouts, or consolidation
-Identify areas where price showed strong directional conviction
-Spot extended or aggressive moves based on overstretch detection
-Monitor how price reacts when retesting prior run levels
-Build confluence with your existing levels, zones, or indicators
Disclaimer
This tool does not reflect true order flow, liquidity, or institutional positioning. It is a visual aid that highlights specific candle behaviour patterns and does not produce predictive signals. All analysis is subject to interpretation, and past price behaviour does not imply future outcomes.
References:
Trends and Reversion in Financial Markets on Time Scales from Minutes to Decades (Sara A. Safari & Christof Schmidhuber, 2025)
Evidence and Behaviour of Support and Resistance Levels in Financial Time Series (Chung & Bellotti, 2021)

Reversal (Heikin Ashi-ready)This indicator detects bullish and bearish reversal patterns based purely on price action relative to prior candles. It is designed to be Heikin Ashi–compatible, meaning it can optionally use HA OHLC values rather than standard candles.
The script identifies:
Bullish reversals (V Up triangles)
Bearish reversals (V Down triangles)
It uses a two-stage system:
Context detection (a potential reversal setup forms).
Confirmation detection (price breaks a key level within a specified number of bars).

Indicator ***TuYa*** V8.2 – HH/HL MTF + Peak Mid ZoneIndicator TuYa V8.0 – HH/HL MTF + Peak Mid Zone
TuYa V8.0 combines multi-timeframe market structure with a Peak Reaction midline to create clean, rule-based reversal and trend entries – designed primarily for 1-minute execution with 1-hour bias.
🧠 Core Concept
This indicator fuses three ideas:
HTF Peak Reaction Midline (1H)
Uses a Peak Reaction style logic on the higher timeframe (HTF, default: 1H).
Identifies a reaction high and reaction low, then calculates their midpoint → the Peak Mid Zone.
This midline acts as a dynamic sentiment divider (above = premium / below = discount).
Multi-Timeframe HH/HL/LH/LL Structure
HTF structure (1H): detects HH, HL, LH, LL using pivot highs/lows.
LTF structure (1m): detects HH, HL, LH, LL on the execution timeframe (chart TF, intended for 1m).
HTF → LTF Confirmation Window
After a 1H structure event (HH, HL, LL, LH), the indicator opens a confirmation window of up to N LTF candles (default: 10 x 1m bars).
Within that window, the required 1m structure event must occur to confirm an entry.
🎯 Signal Logic
All entries are generated on the LTF (e.g. 1m chart), using HTF (e.g. 1H) bias + Peak Mid Zone:
1️⃣ Price ABOVE Peak Mid (Bullish premium zone)
Reversal SELL
HTF: HH (Higher High)
Within N 1m bars: LTF HH
→ SELL signal (fading HTF strength near premium)
Trend/Bullish BUY
HTF: HL (Higher Low)
Within N 1m bars: LTF LL
→ BUY signal (buying dips in an uptrend above midline)
2️⃣ Price BELOW Peak Mid (Bearish discount zone)
Reversal BUY
HTF: LL (Lower Low)
Within N 1m bars: LTF LL
→ BUY signal (catching potential reversal from discount)
Trend/Bearish SELL
HTF: LH (Lower High)
Within N 1m bars: LTF HH
→ SELL signal (shorting strength in a downtrend below midline)
Signals are plotted as small BUY/SELL triangles on the chart and exposed via alert conditions.
🧾 Filters & Options
⏳ HTF → LTF Delay Window
Input: “Max 1m bars after HTF trigger” (default: 10)
After a 1H HH/HL/LL/LH event, the indicator waits up to N LTF candles for the matching 1m structure pattern.
If no match occurs within the window, no signal is generated.
📉 RSI No-Trade Zone (HTF)
Toggle: Use RSI no-trade zone
Inputs:
RSI Length (HTF)
No-trade lower bound (default 45)
No-trade upper bound (default 65)
If HTF RSI is inside the defined band (e.g. 45–65), signals are blocked (no-trade regime), helping to avoid noisy mid-range conditions.
You can turn this filter ON/OFF and adjust the band dynamically.
🧱 5m OB / Direction Filter (Optional)
Toggle: Use 5m OB direction filter
Timeframe: Configurable (default: 5m).
Uses a simple directional proxy on the OB timeframe:
For BUY signals → require a bullish candle on OB timeframe.
For SELL signals → require a bearish candle on OB timeframe.
When enabled, this adds an extra layer of confluence by aligning entries with the short-term directional context.
⚙️ Key Inputs (Summary)
Timeframes
HTF (Peak Reaction & Structure): default 60 (1H)
Peak Reaction
Lookback bars (HTF)
ATR multiplier for zones
Show/Hide Peak Mid line
Structure
Pivot left/right bars (for HH/HL/LH/LL swings)
Toggle structure labels (HTF & LTF)
Confirmation
Max LTF bars after HTF trigger (default 10, fully configurable)
RSI Filter
Use filter (on/off)
RSI length
No-trade range (low/high)
5m OB Filter
Use filter (on/off)
OB timeframe (default 5m)
📡 Alerts & Automation
The script includes alertconditions for both BUY and SELL signals, with JSON-formatted alert messages suitable for routing to external bridges (e.g. bots, MT5/MT4, n8n, etc.).
Each alert includes:
Symbol
Side (BUY / SELL)
Price / Entry
SL & TP placeholders (from hidden plots, ready to be wired to your own logic)
Time
Performance tag
CommentCode (for strategy/type tagging on the receiver side)
You can attach these alerts to a webhook and let your execution engine handle SL/TP and order management.
📌 How to Use
Attach the indicator to a 1-minute chart.
Set HTF timeframe to 60 (or your preferred higher timeframe).
Optionally enable:
RSI regime filter
5m OB direction filter
Watch for:
Price relative to the Peak Mid line
BUY/SELL triangles that respect HTF structure + LTF confirmation + filters.
For automation, create alerts using the built-in conditions and your preferred JSON alert template.
⚠️ Disclaimer
This tool is for educational and informational purposes only.
It is not financial advice and does not guarantee profits. Always test thoroughly in replay / paper trading before using with live funds, and trade at your own risk.

5-Bar BreakoutThis indicator shows if the price is breaking out above the high or the low of the previous 5 bars

Liquidations (TV Source / Manual / Proxy) Cruz Pro Stack + Liquidations (TV Source / Manual / Proxy) is a high-confluence crypto trading indicator built to merge reversal detection, volatility timing, structure confirmation, and liquidation pressure into one clean decision engine.
This script combines five pro-grade components:
1) RSI Divergence (Regular + Hidden)
Detects early momentum shifts at tops and bottoms to anticipate reversals before price fully reacts.
2) BBWP (Bollinger Band Width Percentile)
Identifies volatility compression and expansion cycles to time breakout conditions and avoid low-quality chop.
3) Market Structure (BOS / CHOCH proxy)
Confirms trend continuation or change-of-character using swing breaks for more reliable directional bias.
4) Liquidations Layer (3 Modes)
Adds liquidation-driven context for where price is likely to squeeze or flush next:
TV Source: Use TradingView’s built-in Liquidations plot when available.
Manual Totals: Paste 12h/24h/48h long/short totals for higher-level regime bias.
Proxy (Volume Shock): A fallback approximation for spot charts using volume + candle direction.
The script automatically converts your chart timeframe into rolling 12/24/48-hour windows, then computes a weighted liquidation bias and a spike detector to flag potential exhaustion moves.
5) Confluence Score + Signals
A simple scoring engine highlights high-probability setups when multiple factors align.
Signals are printed only when divergence + structure + volatility context agree with liquidation pressure.
How to use
Best on BTC/ETH perps across 15m–4H.
For maximum accuracy:
Add TradingView’s Liquidations indicator (if your exchange/symbol supports it).
Set Liquidations Mode = TV Source.
Select the Liquidations plot as the source.
If that plot can’t be selected, switch to Proxy or Manual Totals.
What this indicator is designed to improve
Earlier reversal recognition
Cleaner breakout timing
Structure-confirmed entries
Better risk management around liquidation-driven moves
Fewer low-quality trades during dead volatility


猛の掟・初動スクリーナー_完成版//@version=5
indicator("猛の掟・初動スクリーナー_完成版", overlay=true)
// =============================
// 入力パラメータ
// =============================
emaLenShort = input.int(5, "短期EMA", minval=1)
emaLenMid = input.int(13, "中期EMA", minval=1)
emaLenLong = input.int(26, "長期EMA", minval=1)
macdFastLen = input.int(12, "MACD Fast", minval=1)
macdSlowLen = input.int(26, "MACD Slow", minval=1)
macdSignalLen = input.int(9, "MACD Signal", minval=1)
macdZeroTh = input.float(0.2, "MACDゼロライン近辺とみなす許容値", step=0.05)
volMaLen = input.int(5, "出来高平均日数", minval=1)
volMinRatio = input.float(1.3, "出来高倍率(初動判定しきい値)", step=0.1)
volStrongRatio = input.float(1.5, "出来高倍率(本物/三点シグナル用)", step=0.1)
highLookback = input.int(60, "直近高値の参照本数", minval=10)
pullbackMin = input.float(5.0, "押し目最小 ", step=0.5)
pullbackMax = input.float(15.0, "押し目最大 ", step=0.5)
breakLookback = input.int(15, "レジブレ後とみなす本数", minval=1)
wickBodyMult = input.float(2.0, "ピンバー:下ヒゲが実体の何倍以上か", step=0.5)
// ★ シグナル表示 ON/OFF
showMou = input.bool(true, "猛シグナルを表示")
showKaku = input.bool(true, "確シグナルを表示")
// =============================
// 基本指標計算
// =============================
emaShort = ta.ema(close, emaLenShort)
emaMid = ta.ema(close, emaLenMid)
emaLong = ta.ema(close, emaLenLong)
= ta.macd(close, macdFastLen, macdSlowLen, macdSignalLen)
volMa = ta.sma(volume, volMaLen)
volRatio = volMa > 0 ? volume / volMa : 0.0
recentHigh = ta.highest(high, highLookback)
prevHigh = ta.highest(high , highLookback)
pullbackPct = recentHigh > 0 ? (recentHigh - close) / recentHigh * 100.0 : 0.0
// ローソク足
body = math.abs(close - open)
upperWick = high - math.max(open, close)
lowerWick = math.min(open, close) - low
// =============================
// A:トレンド条件
// =============================
emaUp = emaShort > emaShort and emaMid > emaMid and emaLong > emaLong
goldenOrder = emaShort > emaMid and emaMid > emaLong
aboveEma2 = close > emaLong and close > emaLong
trendOK = emaUp and goldenOrder and aboveEma2
// =============================
// B:MACD条件
// =============================
macdGC = ta.crossover(macdLine, macdSignal)
macdNearZero = math.abs(macdLine) <= macdZeroTh
macdUp = macdLine > macdLine
macdOK = macdGC and macdNearZero and macdUp
// =============================
// C:出来高条件
// =============================
volInitOK = volRatio >= volMinRatio // 8条件用
volStrongOK = volRatio >= volStrongRatio // 三点シグナル用
volumeOK = volInitOK
// =============================
// D:ローソク足パターン
// =============================
isBullPinbar = lowerWick > wickBodyMult * body and lowerWick > upperWick and close >= open
isBullEngulf = close > open and open < close and close > open
isBigBullCross = close > emaShort and close > emaMid and open < emaShort and open < emaMid and close > open
candleOK = isBullPinbar or isBullEngulf or isBigBullCross
// =============================
// E:価格帯(押し目&レジブレ)
// =============================
pullbackOK = pullbackPct >= pullbackMin and pullbackPct <= pullbackMax
isBreakout = close > prevHigh and close <= prevHigh
barsSinceBreak = ta.barssince(isBreakout)
afterBreakZone = barsSinceBreak >= 0 and barsSinceBreak <= breakLookback
afterBreakPullbackOK = afterBreakZone and pullbackOK and close > emaShort
priceOK = pullbackOK and afterBreakPullbackOK
// =============================
// 8条件の統合
// =============================
allRulesOK = trendOK and macdOK and volumeOK and candleOK and priceOK
// =============================
// 最終三点シグナル
// =============================
longLowerWick = lowerWick > wickBodyMult * body and lowerWick > upperWick
macdGCAboveZero = ta.crossover(macdLine, macdSignal) and macdLine > 0
volumeSpike = volStrongOK
finalThreeSignal = longLowerWick and macdGCAboveZero and volumeSpike
buyConfirmed = allRulesOK and finalThreeSignal
// =============================
// 描画
// =============================
plot(emaShort, color=color.new(color.yellow, 0), title="EMA 短期(5)")
plot(emaMid, color=color.new(color.orange, 0), title="EMA 中期(13)")
plot(emaLong, color=color.new(color.blue, 0), title="EMA 長期(26)")
// シグナル表示(ON/OFF付き)
plotshape(showMou and allRulesOK, title="猛の掟 8条件クリア候補", location=location.belowbar, color=color.new(color.lime, 0), text="猛")
plotshape(showKaku and buyConfirmed, title="猛の掟 最終三点シグナル確定", location=location.belowbar, color=color.new(color.yellow, 0), text="確")
// =============================
// アラート条件
// =============================
alertcondition(allRulesOK, title="猛の掟 8条件クリア候補", message="猛の掟 8条件クリア候補シグナル発生")
alertcondition(buyConfirmed, title="猛の掟 最終三点シグナル確定", message="猛の掟 最終三点シグナル=買い確定")

EMA 20/50/200 - Warning Note Before Cross EMA 20/50/200 - Smart Cross Detection with Customizable Alerts
A clean and minimalistic indicator that tracks three key Exponential Moving Averages (20, 50, and 200) with intelligent near-cross detection and customizable warning system.
═══════════════════════════════════════════════════════════════════
📊 KEY FEATURES
✓ Triple EMA System
• EMA 20 (Red) - Fast/Short-term trend
• EMA 50 (Yellow) - Medium/Intermediate trend
• EMA 200 (Green) - Slow/Long-term trend & major support/resistance
✓ Smart Near-Cross Detection
• Get warned BEFORE crosses happen (not after)
• Adjustable threshold percentage (how close is "close")
• Automatic hiding after cross to prevent false signals
• Configurable lookback period
✓ Dual Warning System
• Price Label: Appears directly on chart near EMAs
• Info Table: Positioned anywhere on your chart
• Both show distance percentage and direction
• Dynamic positioning to avoid blocking candles
✓ Color-Coded Alerts
• GREEN warning = Bullish cross approaching (EMA 20 crossing UP through EMA 50)
• RED warning = Bearish cross approaching (EMA 20 crossing DOWN through EMA 50)
✓ Cross Signal Detection
• Golden Cross (EMA 50 crosses above EMA 200)
• Death Cross (EMA 50 crosses below EMA 200)
• Fast crosses (EMA 20 and EMA 50)
═══════════════════════════════════════════════════════════════════
⚙️ CUSTOMIZATION OPTIONS
Warning Settings:
• Custom warning text for bull/bear signals
• Adjustable opacity for better visibility
• Toggle distance and direction display
• Flexible table positioning (9 positions available)
• 5 text size options
Alert Settings:
• Golden/Death Cross alerts
• Fast cross alerts (20/50)
• Near-cross warnings (before it happens)
• All alerts are non-repainting
Display Options:
• Show/hide each EMA individually
• Toggle all signals on/off
• Adjustable threshold sensitivity
• Dynamic label positioning
═══════════════════════════════════════════════════════════════════
🎯 HOW TO USE
1. ADD TO CHART
Simply add the indicator to any chart and timeframe
2. ADJUST THRESHOLD
Default is 0.5% - increase for less frequent warnings, decrease for earlier warnings
3. SET UP ALERTS
Create alerts for:
• Near-cross warnings (get notified before the cross)
• Actual crosses (when EMA 20 crosses EMA 50)
• Golden/Death crosses (major trend changes)
4. CUSTOMIZE APPEARANCE
• Change warning text to your language
• Adjust opacity for your chart theme
• Position table where it's most convenient
• Choose label size for visibility
═══════════════════════════════════════════════════════════════════
💡 TRADING TIPS
- Use the near-cross warning to prepare entries/exits BEFORE the cross happens
- Green warning = Prepare for potential long position
- Red warning = Prepare for potential short position
- Combine with other indicators for confirmation
- Higher timeframes = more reliable signals
- Warning disappears after cross to avoid confusion
═══════════════════════════════════════════════════════════════════
🔧 TECHNICAL DETAILS
- Pine Script v6
- Non-repainting (all signals confirm on bar close)
- Works on all timeframes
- Works on all instruments (stocks, crypto, forex, futures)
- Lightweight and efficient
- No external data sources required
═══════════════════════════════════════════════════════════════════
📝 SETTINGS GUIDE
Near Cross Settings:
• Threshold %: How close EMAs must be to trigger warning (default 0.5%)
• Lookback Bars: Hide warning for X bars after a cross (default 3)
Warning Note Style:
• Text Size: Tiny to Huge
• Colors: Customize bull/bear warning colors
• Position: Place table anywhere on chart
• Opacity: 0 (solid) to 90 (very transparent)
Price Label:
• Size: Tiny to Large
• Opacity: Control transparency
• Auto-positioning: Moves to avoid blocking candles
Custom Text:
• Bull/Bear warning messages
• Toggle distance display
• Toggle direction display
═══════════════════════════════════════════════════════════════════
⚠️ IMPORTANT NOTES
- Warnings only appear BEFORE crosses, not after
- After a cross happens, warning is hidden for the lookback period
- Adjust threshold if you're getting too many/too few warnings
- This is a trend-following indicator - best used with confirmation
- Always use proper risk management
═══════════════════════════════════════════════════════════════════
Happy Trading! 📈📉
If you find this indicator useful, please give it a boost and leave a comment!
For questions or suggestions, feel free to reach out.

Support & Resistance Auto-Detector by Rakesh Sharma📊 SUPPORT & RESISTANCE AUTO-DETECTOR
Automatically identifies and displays key price levels where traders make decisions. No more manual drawing - let the algorithm do the work!
✨ KEY FEATURES:
- Auto-detects Swing High/Low levels with strength rating
- Previous Day High/Low (PDH/PDL) - Most important intraday levels
- Previous Week High/Low (PWH/PWL) - Strong swing levels
- Previous Month High/Low (PMH/PML) - Major turning points
- Round Number levels (Psychological barriers)
- S/R Zones (Better than exact lines)
- Breakout/Breakdown alerts
- Live Dashboard with trade bias
🎯 PERFECT FOR:
Nifty, Bank Nifty, Stocks, Forex, Crypto - All markets, all timeframes
⚡ SMART FEATURES:
- Strength Rating: Very Strong/Strong/Medium/Weak
- Distance Calculator: Shows points to next S/R
- Trade Bias: "Buy Dips" / "Sell Rallies" / "Breakout"
- Break Alerts: Get notified on PDH/PDL breaks
- Clean Chart: Shows only most important levels
💡 TRADING EDGE:
Trade bounces at support, rejections at resistance, or breakouts through key levels. Combines perfectly with price action and other indicators.
Created by: Rakesh Sharma

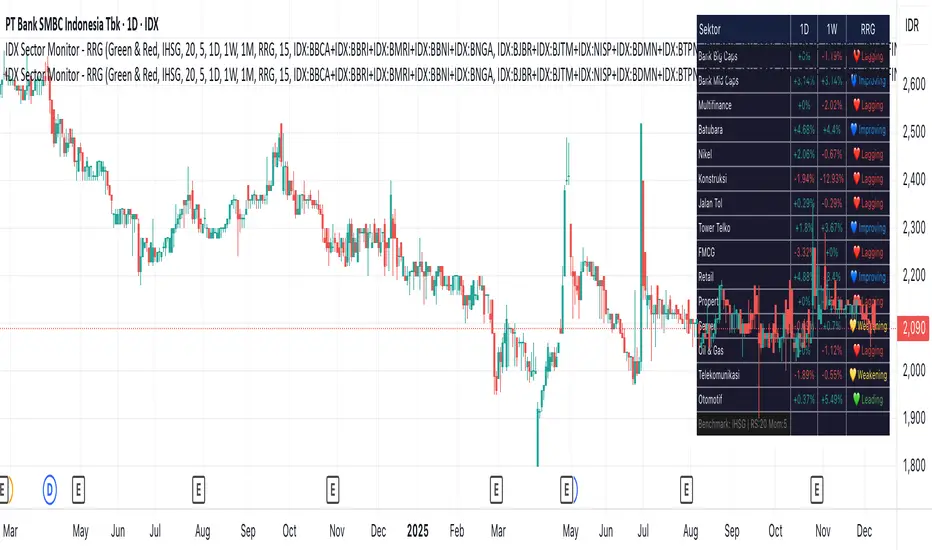
IDX Sector Monitor - RRG
// ═══════════════════════════════════════════════════════════════════════════════
// IDX SECTOR MONITOR - RRG EDITION
// ═══════════════════════════════════════════════════════════════════════════════
// Track Indonesian stock sectors with Relative Rotation Graph (RRG) analysis.
//
// Features:
// • Custom sector indices (equal-weighted)
// • Multi-timeframe performance (1D, 1W, 1M, etc.)
// • RRG status vs IHSG/LQ45 benchmark
//
// RRG Quadrants:
// 💚 Leading - Outperforming, strong momentum (BUY zone)
// 💛 Weakening - Still strong but slowing down (TAKE PROFIT)
// 💙 Improving - Weak but gaining momentum (WATCHLIST)
// ❤️ Lagging - Underperforming, avoid (SELL zone)
//
// ═══════════════════════════════════════════════════════════════════════════════
CloudScore by ExitAnt📘 CloudScore by ExitAnt
CloudScore by ExitAnt 는 일목균형표(Ichimoku Cloud)의 구름대 돌파 신호를 기반으로,
다양한 추세 보조지표를 결합하여 매수 추세 강도를 점수화(0~5점) 해주는 트렌드 분석 지표입니다.
기존 일목구름 단독 신호는 변동성이 크거나 신뢰도가 낮을 수 있기 때문에,
이 지표는 여러 기술적 요소를 종합적으로 평가하여
“지금이 얼마나 강력한 추세 전환 구간인가?” 를 직관적으로 보여줍니다.
🎯 지표 목적
일목균형표 구름 돌파의 신뢰도 강화
보조지표 신호를 자동으로 점수화하여 한눈에 판단 가능
캔들 위에 이모지를 배치해 시각적으로 즉시 해석 가능
초보자부터 숙련자까지 모두 활용 가능한 추세 진입 필터링 도구
🧠 점수 계산 방식 (0~5점)
구름 상향 돌파가 발생하면 아래 조건들을 체크하여 점수를 부여합니다.
▶ +1점 조건 항목
1. 골든 크로스 발생
* 최근 설정한 n봉 이내에서 Fast MA가 Slow MA를 상향 돌파한 경우
2. RSI 과매도 구간
* RSI가 설정 값 이하일 때 추세 전환 가능성이 증가
3. MACD 강세 전환
* MACD가 0 아래에 있으면서 시그널선 상향 돌파 발생
4. RSI 상승 다이버전스
* 가격은 낮아지지만 RSI는 상승 → 바닥 신호
5. 200MA 위에 위치
* 장기 추세와 일치하는 시점만 점수 강화
▶ 점수별 이모지
1점 🟡 : 약한 진입 신호
2점 🟢 : 관찰이 필요한 강화 신호
3점 📈 : 추세 전환 가능성 증가
4점 🚀 : 강한 추세 신호
5점 👑 : 매우 강력한 진입 시그널
🖥 차트 표시 요소
구름대(Span A / Span B)만 표시하여 더 깔끔한 시각화
이모지는 캔들 위에 자동 배치
필요 시 최근 n개의 캔들만 표시하도록 설정 가능
오른쪽 상단에 조건 요약 안내창 표시
🔧 사용자 설정
Tenkan / Kijun / SenkouB 기간 조정
MA, RSI, MACD, 다이버전스 사용 여부 선택
최근 몇 개의 캔들까지 점수를 표시할지 설정 가능
이모지는 사용자 취향에 따라 변경 가능
⚠️ 유의사항
본 지표는 **가격 움직임의 확률적 해석을 돕는 보조지표**이며, 단독으로 매수·매도 결정을 내려서는 안 됩니다.
시장 상황(변동성, 거래량, 프레임)에 따라 신호의 신뢰도는 달라질 수 있습니다.
실제 매매 전략에 적용하기 전 반드시 백테스트와 검증이 필요합니다.
# **📘 CloudScore by ExitAnt — English Description**
📘 CloudScore by ExitAnt
CloudScore by ExitAnt is a trend analysis indicator that evaluates bullish trend strength by scoring (0–5 points) signals based on Ichimoku Cloud breakouts combined with multiple momentum and trend indicators.
Since the default Ichimoku Cloud breakout alone can be unreliable or highly volatile, this indicator integrates several technical conditions to visually and intuitively show
“How strong is the current trend reversal opportunity?”
🎯 Purpose of the Indicator
Enhance the reliability of Ichimoku Cloud breakout signals
Automatically score multiple signals for quick visual judgment
Place emojis directly above candles for instant interpretation
Works for both beginners and experienced traders as a trend-entry filtering tool
🧠 Scoring Logic (0–5 points)
When a bullish breakout above the cloud occurs, the indicator checks the following conditions and assigns points.
▶ +1 Point Conditions
1. Golden Cross
* Fast MA crosses above Slow MA within the user-defined lookback window
2. RSI Oversold
* RSI below threshold increases the probability of trend reversal
3. MACD Bullish Shift
* MACD is below zero while crossing above the signal line
4. RSI Bullish Divergence
* Price makes a lower low while RSI makes a higher low → potential bottom signal
5. Above the 200MA
* Only scores when price aligns with long-term trend direction
▶ Emoji by Score
1 Point 🟡 : Weak early signal
2 Points 🟢 : Improved setup; watch closely
3 Points 📈 : Decent trend reversal possibility
4 Points 🚀 : Strong trend entry signal
5 Points 👑 : Very strong bullish signal
🖥 Chart Elements
Displays only Span A / Span B to keep the cloud visually clean
Emojis automatically appear above candles
Optionally limit the number of candles displaying signals
Summary box appears in the upper-right corner
🔧 User Settings
Adjustable Tenkan / Kijun / Senkou B periods
Enable/disable MA, RSI, MACD, divergence filters
Set how many recent candles should show the score
Emojis can be customized by the user
⚠️ Disclaimer
This is a technical assistant tool that helps interpret price movement probabilities; it should not be used as a standalone buy/sell signal.
Signal reliability may vary depending on volatility, volume, and timeframe.
Always conduct backtesting and validation before using it in real trading strategies.

Trading Session IL7 Session-Based Intraday Momentum IndicatorOverview
This indicator is designed to support discretionary traders by highlighting intraday momentum phases based on price behavior and trading session context.
It is intended as a confirmation tool and not as a standalone trading system or automated strategy.
Core Concept
The script combines multiple market observations, including:
- Directional price behavior within the current timeframe
- Structural consistency in recent price movement
- Session-based filtering to focus on periods with higher activity and liquidity
Signals are only displayed when internal conditions align, helping traders avoid low-quality setups during sideways or low-momentum market phases.
How to Use
This indicator should be used to confirm existing trade ideas rather than generate trades on its own.
It can help traders:
- Identify periods where momentum is more likely to continue
- Filter out trades during unfavorable market conditions
- Align intraday execution with higher-timeframe bias
Best results are achieved when used alongside key price levels, higher-timeframe structure and proper risk management.
Limitations
This indicator does not predict future price movements.
Signals may change during active candles.
Market conditions may reduce effectiveness during extremely low volatility periods.
Language Notice
The indicator’s user interface labels are displayed in German.
This English description is provided first to comply with TradingView community script publishing rules.

Greater Moving AverageThe purpose for this indicator is to function as a comprehensive market-state detector, with the primary goal of avoiding a market crash.
Mendoza Lines (V-pattern detection) identify early crash conditions and warn when market structure becomes unstable.
RSI/volume-shaded candles + Supertrend confirm momentum and trend, creating a unified system to avoid major drawdowns.
Enhanced Wyckoff ranges with ATR.
Mendoza lines identify abrupt V-shaped reversals which often precede high-risk crash structures. By tracking both the formation and resolution of these patterns across multiple timeframes, the indicator provides early warning signals when the market is entering unstable territory, allowing traders to step aside before liquidity collapses or structural breakdowns begin.
Ideal configurations use Heikin Ashi to smooth out candle structure. Observe SPX on a Weekly Chart, which correctly identifies exits and entries during the 2001 and 2009 crashes. On a 6 hour chart, the Tariff low is correctly identified. The improved VWAP uses a cumulative metric rather than the built in ta.vwap calculation, and functions as a macro low beacon when crossed with the 200 EMA. Historically, these crosses have aligned closely with macro cycle lows.
To round out the system, the indicator overlays RSI-based and volume-weighted candle shading to reflect internal momentum and real buying/selling pressure directly on the chart, making shifts in strength immediately visible. A Supertrend confirmation layer acts as the final filter, smoothing noise and verifying trend direction before decisions are made.

FVG Maxing - Fair Value Gaps, Equilibrium, and Candle Patterns
What this script does
This open-source indicator highlights 3-candle fair value gaps (FVGs) on the active chart timeframe, draws their midpoint ("equilibrium") line, tracks when each gap is mitigated, and optionally marks simple candle patterns (engulfing and doji) for confluence. It is intended as an educational tool to study how price interacts with imbalances.
3-candle bullish and bearish FVG zones drawn as forward-extending boxes.
Equilibrium line at 50% of each gap.
Different styling for mitigated vs unmitigated gaps.
Compact statistics panel showing how many gaps are currently active and filled.
Optional overlays for bullish/bearish engulfing patterns and doji candles.
1. FVG logic (3-candle gaps)
The script focuses on a strict 3-candle definition of a fair value gap:
Three consecutive candles with the same body direction.
The wick of candle 3 is separated from the wick of candle 1 (no overlap).
A bullish gap is created when price moves up fast enough to leave a gap between candle 1 and 3. A bearish gap is the mirror case to the downside.
In Pine, the core detection looks like this:
// Three candles with the same body direction
bull_seq = close > open and close > open and close > open
bear_seq = close < open and close < open and close < open
// Wick gap between candle 1 and candle 3
bull_gap = bull_seq and low > high
bear_gap = bear_seq and high < low
// Final FVG flags
is_bull_fvg = bull_gap
is_bear_fvg = bear_gap
For each detected FVG:
Bullish FVG range: from high up to low (gap below current price).
Bearish FVG range: from low down to high (gap above current price).
Each zone is stored in a custom FVGData structure so it can be updated when price later trades back inside it.
2. Equilibrium line (0.5 of the gap)
Every FVG box gets an optional equilibrium line plotted at the midpoint between its top and bottom:
eq_level = (top + bottom) / 2.0
right_index = extend_boxes ? bar_index + extend_length_bars : bar_index
bx = box.new(bar_index - 2, top, right_index, bottom)
eq_ln = line.new(bar_index - 2, eq_level, right_index, eq_level)
line.set_style(eq_ln, line.style_dashed)
line.set_color(eq_ln, eq_color)
You can use this line as a neutral “fair value” reference inside the zone, or as a simple way to think in terms of premium/discount within each gap.
3. Mitigation rules and styling
Each FVG stays active until price trades back into the gap:
Bullish FVG is considered mitigated when the low touches or moves below the top of the gap.
Bearish FVG is considered mitigated when the high touches or moves above the bottom of the gap.
When that happens, the script:
Marks the internal FVGData entry as mitigated.
Softens the box fill and border colors.
Optionally updates the label text from "BULL EQ / BEAR EQ" to "BULL FILLED / BEAR FILLED".
Can hide mitigated zones almost completely if you only want to see unfilled imbalances.
This allows you to distinguish between current areas of interest and zones that have already been traded through.
4. Candle pattern overlays (engulfing and doji)
For additional confluence, the script can mark simple candle patterns on top of the FVG view:
Bullish engulfing — current candle body fully wraps the previous bearish body and is larger in size.
Bearish engulfing — current candle body fully wraps the previous bullish body and is larger in size.
Doji — candles where the real body is small relative to the full range (high–low).
The detection is based on basic body and range geometry:
curr_body = math.abs(close - open)
prev_body = math.abs(close - open )
curr_range = high - low
body_ratio = curr_range > 0 ? curr_body / curr_range : 1.0
bull_engulfing = close > open and close < open and open <= close and close >= open and curr_body > prev_body
bear_engulfing = close < open and close > open and open >= close and close <= open and curr_body > prev_body
is_doji = curr_range > 0 and body_ratio <= doji_body_ratio
On the chart, they appear as:
Small triangle markers below bullish engulfing candles.
Small triangle markers above bearish engulfing candles.
Small circles above doji candles.
All three overlays are optional and can be turned on or off and recolored in the CANDLE PATTERNS group of inputs.
5. Inputs overview
The script organizes settings into clear groups:
DISPLAY SETTINGS : Show bullish/bearish FVGs, show/hide mitigated zones, box extension length, box border width, and maximum number of boxes.
EQUILIBRIUM : Toggle equilibrium lines, color, and line width.
LABELS : Enable labels, choose whether to label unmitigated and/or mitigated zones, and select label size.
BULLISH COLORS / BEARISH COLORS : Separate fill and border colors for bullish and bearish gaps.
MITIGATED STYLE : Opacity used when a gap is marked as mitigated.
STATISTICS : Toggle the on-chart FVG statistics panel.
CANDLE PATTERNS : Show engulfing patterns, show dojis, colors, and the body-to-range threshold that defines a doji.
6. Statistics panel
An optional table in the corner of the chart summarizes the current state of all tracked gaps:
Total number of FVGs still being tracked.
Number of bullish vs bearish FVGs.
Number of unfilled vs mitigated FVGs.
Simple fill rate: percentage of tracked FVGs that have been marked as mitigated.
This can help you study how a particular market tends to treat gaps over time.
7. How you might use it (examples)
These are usage ideas only, not recommendations:
Study how often your symbol mitigates gaps and where inside the zone price tends to react.
Use higher-timeframe context and then refine entries near the equilibrium line on your trading timeframe.
Combine FVG zones with basic candle patterns (engulfing/doji) as an extra visual anchor, if that fits your process.
Hope you enjoy, give your feedback in the comments!
- officialjackofalltrades

VIX/VXV Ratio (TitsNany)This script plots the VXV/VIX ratio, which compares medium-term volatility (90-day fear) to short-term volatility (30-day fear). When the ratio rises above key levels like 1.16 or 1.24, it signals that traders expect future stress, often preceding market pullbacks. When the ratio falls toward or below 1.0, short-term fear is spiking, which typically occurs during active selloffs or volatility events. In short, elevated readings warn of potential market drops ahead, while sharp declines in the ratio reflect panic already hitting the market.
