EMA100 Breakout by shubhThis indicator is a clean, price-action-based breakout system designed for disciplined trend trading on any timeframe — especially for Nifty and Bank Nifty spot, futures, and options charts.
It uses a single 100-period EMA to define trend direction and waits for decisive candle closes across the EMA to trigger potential entries.
The logic ensures only one active trade at a time, enforcing patience and clarity in decision-making.
⚙️ Core Logic
Buy Setup
A bullish candle closes above the 100 EMA while its open was below the EMA.
Entry occurs at candle close.
Stop-Loss (SL): Low of the signal candle.
Target (TP): 4 × the SL distance (Risk : Reward = 1 : 4).
Sell Setup
A bearish candle closes below the 100 EMA while its open was above the EMA.
Entry occurs at candle close.
Stop-Loss (SL): High of the signal candle.
Target (TP): 4 × the SL distance.
Trade Management
Only one trade may run at a time (either long or short).
New signals are ignored until the current position hits SL or TP.
Transparent labels show Entry, SL, and TP levels on chart.
Dotted lines visualize active Stop-Loss (red) and Target (green).
Exit markers:
✅ Target Hit
❌ Stop Loss Hit
🧠 Key Advantages
Simple and transparent trend-following logic.
Enforces disciplined “one-trade-at-a-time” behavior.
High risk-to-reward (1 : 4).
Works across timeframes — 5 min to Daily.
Ideal for intraday and positional setups.
📊 Suggested Use
Apply on Nifty / Bank Nifty spot or futures charts.
Works on any instrument with clear momentum swings.
Best confirmation when EMA 100 acts as dynamic support/resistance.
⚠️ Disclaimer
This script is for educational and research purposes only.
It is not financial advice or an invitation to trade.
Always backtest thoroughly and manage risk responsibly before applying in live markets.
Candlestick analysis

Mean Reversion Scalping by XtramaskAvoid using this indicator in aggressively trending markets . Best in Non Treanding Markets

Simple Market Structure Highs & Lows🟩 Simple Market Structure Highs & Lows
This indicator identifies basic swing highs and lows based on simple two-candle patterns, giving traders a clean visual view of short-term market structure shifts.
🔹 Logic
A Swing High (H) is marked when an up candle is followed by a down candle.
→ The high of the up candle (the first one) is plotted as a green triangle above the bar.
A Swing Low (L) is marked when a down candle is followed by an up candle.
→ The low of the down candle (the first one) is plotted as a red triangle below the bar.
🔹 Purpose
This tool helps visualize basic market turning points — useful for:
Spotting local tops and bottoms
Analyzing market structure changes
Identifying potential entry/exit zones
Building the foundation for BOS/CHoCH strategies
🔹 Notes
Works on any timeframe or asset.
No repainting — signals appear after the confirming candle closes.
Simple and lightweight — ideal for traders who prefer clean structure visualization.

Volatility Trend Indicator+Overview:
This indicator measures short-term volatility relative to its smoothed average. It helps visualize whether volatility is increasing or decreasing over time. The indicator is displayed in a separate pane below the main price chart for clarity
Visualization:
Line plot of V
Zero line for reference
Background color highlights trend:
Green → rising volatility
Red → falling volatility
Yellow → neutral

Price Movement Alert with Previous Close as ReferenceFunctionality of the Indicator
The "Price Movement Alarm with Previous Day Close as Reference" indicator is a tool that helps you monitor significant price levels based on the previous day's closing price. The indicator calculates both decline and rise thresholds in specified percentages to generate potential trade alerts. The lines on the chart represent these thresholds, and the corresponding labels show the exact percentage.
Usage Instructions:
Previous Day's Close: The indicator uses the previous trading day's close as the reference point.
Setting Decline and Rise Percentages: You can adjust the alarm levels for declines (e.g., 0.5%, 1.0%, 1.5%, 2.0%, 2.5%, 3.0%) and rises (e.g., 0.5%, 1.0%, 1.5%, 2.0%, 2.5%, 3.0%).
Lines and Labels: The indicator draws lines on the chart and displays labels that indicate the percentage of price movement.
Market Analysis: Analyze the price movements to make potential trading decisions.
Market in Equilibrium:
A market is in equilibrium when price movements remain within a narrow range (e.g., 0.5% to 1%). During this phase, volatility is low, and there are no significant price changes.
Market not in Equilibrium:
A market is not in equilibrium when price movements fall outside the narrow range (e.g., above 1%). During this phase, larger price movements can occur, often triggered by news or economic events.

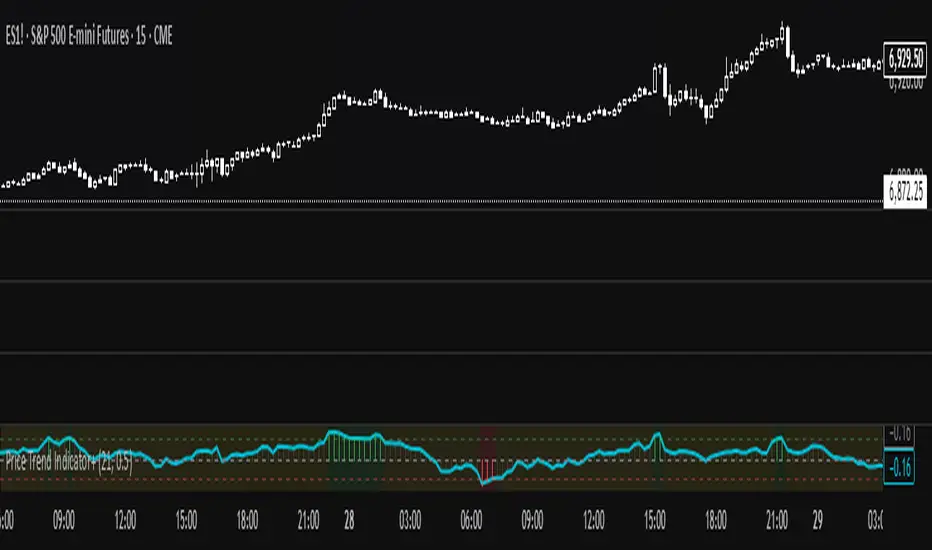
Price Trend Indicator+🧠 What it does
It measures the ratio between average price change and average volatility, showing how strong and directional the trend is.
Higher positive values = steady uptrend, negative = downtrend
📊 How to interpret
P value Signal Meaning
P > +0.5 🟢 Strong Uptrend Steady upward movement
0 < P < +0.5 🟡 Mild Uptrend Weak upward bias
P ≈ 0 ⚪ Sideways No clear direction
-0.5 < P < 0 🟠 Mild Downtrend Slight downward bias
P < -0.5 🔴 Strong Downtrend Consistent decline
Price Above PDH - Complete Multi-Confirmation Alert
Cashapp $jmoskyhigh
Initial Breakout: Must have ALL confirmations to even start counting
During Hold Period: If ANY confirmation fails at ANY bar, the counter RESETS to zero
Must Re-qualify: If confirmations fail, must cross PDH again with all confirmations to restart
Alert Only Fires: When ALL confirmations are continuously met for the ENTIRE hold period
3. Visual Feedback:
Green background: Above PDH + ALL confirmations present
Red background: Above PDH but MISSING one or more confirmations
Red X above bar: Shows when a confirmation is lost during breakout (counter resets)
Green triangle with "✓ ALL": Alert triggered after full confirmation period
4. Example Scenario:
Scenario 1 - SUCCESS:
Bar 1: Price crosses PDH, Volume spike, MA bullish, Above VWAP → Counter = 1
Bar 2: Still above PDH, ALL confirmations still met → Counter = 2
Bar 3: Still above PDH, ALL confirmations still met → Counter = 3
Bar 4: Still above PDH, ALL confirmations still met → Counter = 4
Bar 5: Still above PDH, ALL confirmations still met → Counter = 5 → ALERT!
Scenario 2 - FAILURE (resets):
Bar 1: Price crosses PDH, Volume spike, MA bullish, Above VWAP → Counter = 1
Bar 2: Still above PDH, ALL confirmations still met → Counter = 2
Bar 3: Still above PDH, but volume drops below threshold → RESET Counter = 0
Bar 4: Still above PDH, ALL confirmations back → Counter = 1 (starts over)
5. Info Panel:
Shows which specific confirmations are failing
"OFF" displayed for disabled confirmations
Big "ALL CONFIRMED" row shows overall status
Warning message if confirmations are lost during breakout
This ensures you only get alerts when the setup is truly strong with ALL confirmations maintained throughout the entire hold period! 🎯

Eagles CompassFree script
Helps detect specific body/wick ratios on chart for 1HR,2HR,4HR timeframes
Designed to help you detect large squeezes, bounces, and other moves
Ideally use in conjunction with an RSI to filter for false positives

Volatility Resonance CandlesVolatility Resonance Candles visualize the dynamic interaction between price acceleration, volatility, and volume energy.
They’re designed to reveal moments when volatility expansion and directional momentum resonate — often preceding strong directional moves or reversals.
🔬 Concept
Traditional candles display direction and range, but they miss the energetic structure of volatility itself.
This indicator introduces a resonance model, where ATR ratio, price acceleration, and volume intensity combine to form a composite signal.
* ATR Resonance: compares short-term vs. long-term volatility
* Acceleration: captures the rate of price change
* Volume Energy: reinforces the move’s significance
When these components align, the candle color “resonates” — brighter, more intense candles signal stronger volatility–momentum coupling.
⚙️ Features
* Adaptive Scaling
Normalizes energy intensity dynamically across a user-defined lookback period, ensuring consistency in changing market conditions.
* Power-Law Transformation
Optional non-linear scaling (gamma) emphasizes higher-energy events while keeping low-intensity noise visually subdued.
* Divergence Mode
When enabled, colors can invert to highlight energy divergence from candle direction (e.g., bearish pressure during bullish closes).
* Customizable Styling
Full control over bullish/bearish base colors, transparency scaling, and threshold sensitivity.
🧠 Interpretation
* Bright / High-Intensity Candles → Strong alignment of volatility and directional energy.
Often signals the resonant phase of a move — acceleration backed by volatility expansion and volume participation.
* Dim / Low-Intensity Candles → Energy dispersion or consolidation.
These typically mark quiet zones, pauses, or inefficient volatility.
* Opposite-Colored Candles (if divergence mode on) → Potential inflection zones or hidden stress in the trend structure.
⚠️ Disclaimer
This script is for educational purposes only.
It does not constitute financial advice, and past performance is not indicative of future results. Always do your own research and test strategies before making trading decisions.

Combined Advanced Trading BlueprintStacked EMAs, some SMA, VWAP, Smart Money Concept stuff all wrapped into one


Continuation Probability (0–100)This indicator helps measure how likely the current candle trend will continue or reverse, giving a probability score between 0–100.
It combines multiple market factors trend, candle strength, volume, and volatility to create a single, intuitive signal.


Funded Gang IndiciCustomized indicator to detect the opening bias of Indexes.
Timeframe 14:30 - 15:30

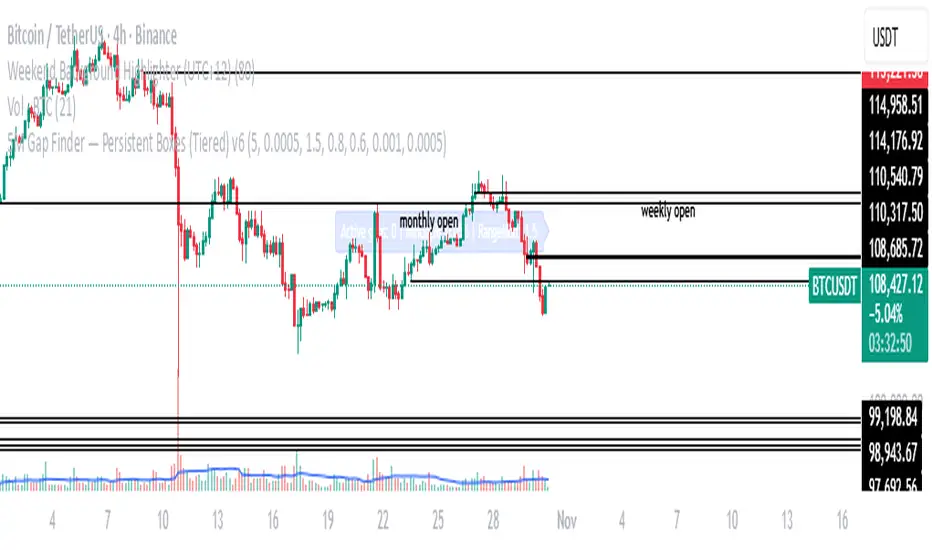
Aperturas Semanales Precisas (corregido)Identifica aperturas semanales del precio y resalta aperturas mensuales

PARTH Gold Profit IndicatorWhat's Inside:
✅ What is gold trading (XAU/USD explained)
✅ Why trade gold (5 major reasons)
✅ How to make money (buy/sell mechanics)
✅ Complete trading setup using your indicator
✅ Entry rules (when to buy/sell with examples)
✅ Risk management (THE MOST IMPORTANT)
✅ Best trading times (London-NY overlap)
✅ 3 trading styles (scalping, swing, position)
✅ 6 common mistakes to avoid
✅ Realistic profit expectations
✅ Pre-trade checklist
✅ Step-by-step getting started guide
✅ Everything a beginner need


5M Gap Finder — Persistent Boxes (Tiered) v65 M gap finder, using 3 different types of gaps: Tier Definition Tightness Frequency Use Case
Tier A (Strict) Gap ≥ 0.10%, body ≥ 70% of range Rare Institutional-strength displacement
Tier B (Standard) Gap ≥ 0.05%, body ≥ 60% of range Medium Baseline trading setup
Tier C (Loose) Gap ≥ 0.03%, no body condition Common Data collection and observation
London Breakout Structure by Ale 2This indicator identifies market structure breakouts (CHOCH/BOS) within a specific London session window, highlighting potential breakout trades with automatic entry, stop loss (SL), and take profit (TP) levels.
It helps traders focus on high-probability breakouts when volatility increases after the Asian session, using price structure, ATR-based volatility filters, and a custom risk/reward setup.
🔹 Example of Strategy Application
Define your session (e.g. 04:00 to 05:00).
Wait for a CHOCH (Change of Character) inside this session.
If a bullish CHOCH occurs → go LONG at candle close.
If a bearish CHOCH occurs → go SHORT at candle close.
SL is set below/above the previous swing using ATR × multiplier.
TP is calculated automatically based on your R:R ratio.
📊 Example:
When price breaks above the last swing high within the session, a “BUY” label appears and the indicator draws Entry, SL, and TP levels automatically.
If the breakout fails and price closes below the opposite structure, a “SELL” signal will replace the bullish setup.
🔹 Details
The logic is based on structural shifts (CHOCH/BOS):
A CHOCH occurs when price breaks and closes beyond the most recent high/low.
The indicator dynamically detects these shifts in structure, validating them only inside your chosen time window (e.g. the London Open).
The ATR filter ensures setups are valid only when the range has enough volatility, avoiding false signals in low-volume hours.
You can also visualize:
The session area (purple background)
Entry, Stop Loss, and Take Profit levels
Direction labels (BUY/SELL)
ATR line for volatility context
🔹 Configuration
Start / End Hour: define your preferred trading window.
ATR Length & Multiplier: adjust for volatility.
Risk/Reward Ratio: set your desired R:R (default 1:2).
Minimum Range Filter: avoids signals with tight SLs.
Alerts: receive notifications when breakout conditions occur.
🔹 Recommendations
Works best on 15m or 5m charts during London session.
Designed for breakout and structure-based traders.
Works on Forex, Crypto, and Indices.
Ideal as a visual and educational tool for understanding BOS/CHOCH behavior.

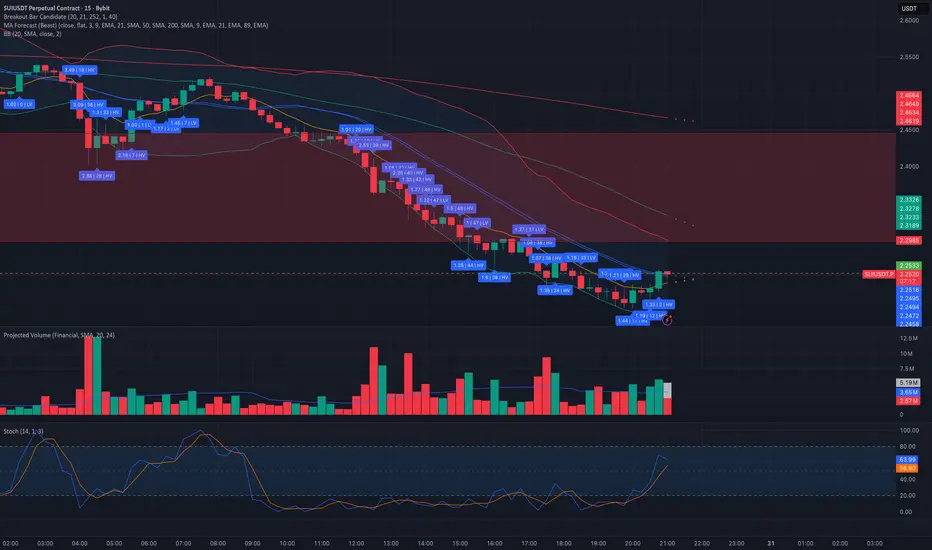
Breakout Bar CandidateShows the values of True Range, LS volatility and whether the volume is above or below average
Trend on TimeFrames indicatorThis indicator shows you If you are bullish or bearish on every important timeframe

