IDX Sector Monitor - RRG
// ═══════════════════════════════════════════════════════════════════════════════
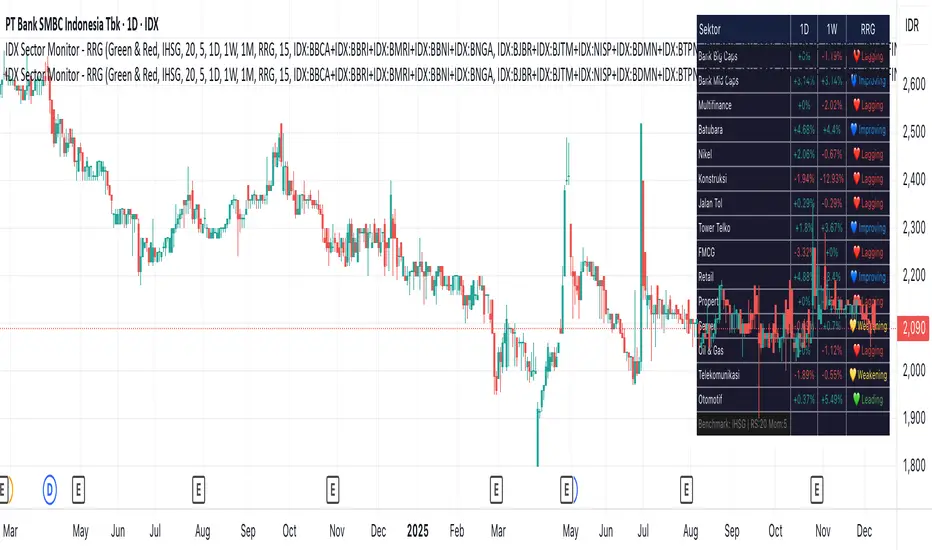
// IDX SECTOR MONITOR - RRG EDITION
// ═══════════════════════════════════════════════════════════════════════════════
// Track Indonesian stock sectors with Relative Rotation Graph (RRG) analysis.
//
// Features:
// • Custom sector indices (equal-weighted)
// • Multi-timeframe performance (1D, 1W, 1M, etc.)
// • RRG status vs IHSG/LQ45 benchmark
//
// RRG Quadrants:
// 💚 Leading - Outperforming, strong momentum (BUY zone)
// 💛 Weakening - Still strong but slowing down (TAKE PROFIT)
// 💙 Improving - Weak but gaining momentum (WATCHLIST)
// ❤️ Lagging - Underperforming, avoid (SELL zone)
//
// ═══════════════════════════════════════════════════════════════════════════════
Candlestick analysis
CloudScore by ExitAnt📘 CloudScore by ExitAnt
CloudScore by ExitAnt 는 일목균형표(Ichimoku Cloud)의 구름대 돌파 신호를 기반으로,
다양한 추세 보조지표를 결합하여 매수 추세 강도를 점수화(0~5점) 해주는 트렌드 분석 지표입니다.
기존 일목구름 단독 신호는 변동성이 크거나 신뢰도가 낮을 수 있기 때문에,
이 지표는 여러 기술적 요소를 종합적으로 평가하여
“지금이 얼마나 강력한 추세 전환 구간인가?” 를 직관적으로 보여줍니다.
🎯 지표 목적
일목균형표 구름 돌파의 신뢰도 강화
보조지표 신호를 자동으로 점수화하여 한눈에 판단 가능
캔들 위에 이모지를 배치해 시각적으로 즉시 해석 가능
초보자부터 숙련자까지 모두 활용 가능한 추세 진입 필터링 도구
🧠 점수 계산 방식 (0~5점)
구름 상향 돌파가 발생하면 아래 조건들을 체크하여 점수를 부여합니다.
▶ +1점 조건 항목
1. 골든 크로스 발생
* 최근 설정한 n봉 이내에서 Fast MA가 Slow MA를 상향 돌파한 경우
2. RSI 과매도 구간
* RSI가 설정 값 이하일 때 추세 전환 가능성이 증가
3. MACD 강세 전환
* MACD가 0 아래에 있으면서 시그널선 상향 돌파 발생
4. RSI 상승 다이버전스
* 가격은 낮아지지만 RSI는 상승 → 바닥 신호
5. 200MA 위에 위치
* 장기 추세와 일치하는 시점만 점수 강화
▶ 점수별 이모지
1점 🟡 : 약한 진입 신호
2점 🟢 : 관찰이 필요한 강화 신호
3점 📈 : 추세 전환 가능성 증가
4점 🚀 : 강한 추세 신호
5점 👑 : 매우 강력한 진입 시그널
🖥 차트 표시 요소
구름대(Span A / Span B)만 표시하여 더 깔끔한 시각화
이모지는 캔들 위에 자동 배치
필요 시 최근 n개의 캔들만 표시하도록 설정 가능
오른쪽 상단에 조건 요약 안내창 표시
🔧 사용자 설정
Tenkan / Kijun / SenkouB 기간 조정
MA, RSI, MACD, 다이버전스 사용 여부 선택
최근 몇 개의 캔들까지 점수를 표시할지 설정 가능
이모지는 사용자 취향에 따라 변경 가능
⚠️ 유의사항
본 지표는 **가격 움직임의 확률적 해석을 돕는 보조지표**이며, 단독으로 매수·매도 결정을 내려서는 안 됩니다.
시장 상황(변동성, 거래량, 프레임)에 따라 신호의 신뢰도는 달라질 수 있습니다.
실제 매매 전략에 적용하기 전 반드시 백테스트와 검증이 필요합니다.
# **📘 CloudScore by ExitAnt — English Description**
📘 CloudScore by ExitAnt
CloudScore by ExitAnt is a trend analysis indicator that evaluates bullish trend strength by scoring (0–5 points) signals based on Ichimoku Cloud breakouts combined with multiple momentum and trend indicators.
Since the default Ichimoku Cloud breakout alone can be unreliable or highly volatile, this indicator integrates several technical conditions to visually and intuitively show
“How strong is the current trend reversal opportunity?”
🎯 Purpose of the Indicator
Enhance the reliability of Ichimoku Cloud breakout signals
Automatically score multiple signals for quick visual judgment
Place emojis directly above candles for instant interpretation
Works for both beginners and experienced traders as a trend-entry filtering tool
🧠 Scoring Logic (0–5 points)
When a bullish breakout above the cloud occurs, the indicator checks the following conditions and assigns points.
▶ +1 Point Conditions
1. Golden Cross
* Fast MA crosses above Slow MA within the user-defined lookback window
2. RSI Oversold
* RSI below threshold increases the probability of trend reversal
3. MACD Bullish Shift
* MACD is below zero while crossing above the signal line
4. RSI Bullish Divergence
* Price makes a lower low while RSI makes a higher low → potential bottom signal
5. Above the 200MA
* Only scores when price aligns with long-term trend direction
▶ Emoji by Score
1 Point 🟡 : Weak early signal
2 Points 🟢 : Improved setup; watch closely
3 Points 📈 : Decent trend reversal possibility
4 Points 🚀 : Strong trend entry signal
5 Points 👑 : Very strong bullish signal
🖥 Chart Elements
Displays only Span A / Span B to keep the cloud visually clean
Emojis automatically appear above candles
Optionally limit the number of candles displaying signals
Summary box appears in the upper-right corner
🔧 User Settings
Adjustable Tenkan / Kijun / Senkou B periods
Enable/disable MA, RSI, MACD, divergence filters
Set how many recent candles should show the score
Emojis can be customized by the user
⚠️ Disclaimer
This is a technical assistant tool that helps interpret price movement probabilities; it should not be used as a standalone buy/sell signal.
Signal reliability may vary depending on volatility, volume, and timeframe.
Always conduct backtesting and validation before using it in real trading strategies.

Trading Session IL7 Session-Based Intraday Momentum IndicatorOverview
This indicator is designed to support discretionary traders by highlighting intraday momentum phases based on price behavior and trading session context.
It is intended as a confirmation tool and not as a standalone trading system or automated strategy.
Core Concept
The script combines multiple market observations, including:
- Directional price behavior within the current timeframe
- Structural consistency in recent price movement
- Session-based filtering to focus on periods with higher activity and liquidity
Signals are only displayed when internal conditions align, helping traders avoid low-quality setups during sideways or low-momentum market phases.
How to Use
This indicator should be used to confirm existing trade ideas rather than generate trades on its own.
It can help traders:
- Identify periods where momentum is more likely to continue
- Filter out trades during unfavorable market conditions
- Align intraday execution with higher-timeframe bias
Best results are achieved when used alongside key price levels, higher-timeframe structure and proper risk management.
Limitations
This indicator does not predict future price movements.
Signals may change during active candles.
Market conditions may reduce effectiveness during extremely low volatility periods.
Language Notice
The indicator’s user interface labels are displayed in German.
This English description is provided first to comply with TradingView community script publishing rules.

Greater Moving AverageThe purpose for this indicator is to function as a comprehensive market-state detector, with the primary goal of avoiding a market crash.
Mendoza Lines (V-pattern detection) identify early crash conditions and warn when market structure becomes unstable.
RSI/volume-shaded candles + Supertrend confirm momentum and trend, creating a unified system to avoid major drawdowns.
Enhanced Wyckoff ranges with ATR.
Mendoza lines identify abrupt V-shaped reversals which often precede high-risk crash structures. By tracking both the formation and resolution of these patterns across multiple timeframes, the indicator provides early warning signals when the market is entering unstable territory, allowing traders to step aside before liquidity collapses or structural breakdowns begin.
Ideal configurations use Heikin Ashi to smooth out candle structure. Observe SPX on a Weekly Chart, which correctly identifies exits and entries during the 2001 and 2009 crashes. On a 6 hour chart, the Tariff low is correctly identified. The improved VWAP uses a cumulative metric rather than the built in ta.vwap calculation, and functions as a macro low beacon when crossed with the 200 EMA. Historically, these crosses have aligned closely with macro cycle lows.
To round out the system, the indicator overlays RSI-based and volume-weighted candle shading to reflect internal momentum and real buying/selling pressure directly on the chart, making shifts in strength immediately visible. A Supertrend confirmation layer acts as the final filter, smoothing noise and verifying trend direction before decisions are made.

FVG Maxing - Fair Value Gaps, Equilibrium, and Candle Patterns
What this script does
This open-source indicator highlights 3-candle fair value gaps (FVGs) on the active chart timeframe, draws their midpoint ("equilibrium") line, tracks when each gap is mitigated, and optionally marks simple candle patterns (engulfing and doji) for confluence. It is intended as an educational tool to study how price interacts with imbalances.
3-candle bullish and bearish FVG zones drawn as forward-extending boxes.
Equilibrium line at 50% of each gap.
Different styling for mitigated vs unmitigated gaps.
Compact statistics panel showing how many gaps are currently active and filled.
Optional overlays for bullish/bearish engulfing patterns and doji candles.
1. FVG logic (3-candle gaps)
The script focuses on a strict 3-candle definition of a fair value gap:
Three consecutive candles with the same body direction.
The wick of candle 3 is separated from the wick of candle 1 (no overlap).
A bullish gap is created when price moves up fast enough to leave a gap between candle 1 and 3. A bearish gap is the mirror case to the downside.
In Pine, the core detection looks like this:
// Three candles with the same body direction
bull_seq = close > open and close > open and close > open
bear_seq = close < open and close < open and close < open
// Wick gap between candle 1 and candle 3
bull_gap = bull_seq and low > high
bear_gap = bear_seq and high < low
// Final FVG flags
is_bull_fvg = bull_gap
is_bear_fvg = bear_gap
For each detected FVG:
Bullish FVG range: from high up to low (gap below current price).
Bearish FVG range: from low down to high (gap above current price).
Each zone is stored in a custom FVGData structure so it can be updated when price later trades back inside it.
2. Equilibrium line (0.5 of the gap)
Every FVG box gets an optional equilibrium line plotted at the midpoint between its top and bottom:
eq_level = (top + bottom) / 2.0
right_index = extend_boxes ? bar_index + extend_length_bars : bar_index
bx = box.new(bar_index - 2, top, right_index, bottom)
eq_ln = line.new(bar_index - 2, eq_level, right_index, eq_level)
line.set_style(eq_ln, line.style_dashed)
line.set_color(eq_ln, eq_color)
You can use this line as a neutral “fair value” reference inside the zone, or as a simple way to think in terms of premium/discount within each gap.
3. Mitigation rules and styling
Each FVG stays active until price trades back into the gap:
Bullish FVG is considered mitigated when the low touches or moves below the top of the gap.
Bearish FVG is considered mitigated when the high touches or moves above the bottom of the gap.
When that happens, the script:
Marks the internal FVGData entry as mitigated.
Softens the box fill and border colors.
Optionally updates the label text from "BULL EQ / BEAR EQ" to "BULL FILLED / BEAR FILLED".
Can hide mitigated zones almost completely if you only want to see unfilled imbalances.
This allows you to distinguish between current areas of interest and zones that have already been traded through.
4. Candle pattern overlays (engulfing and doji)
For additional confluence, the script can mark simple candle patterns on top of the FVG view:
Bullish engulfing — current candle body fully wraps the previous bearish body and is larger in size.
Bearish engulfing — current candle body fully wraps the previous bullish body and is larger in size.
Doji — candles where the real body is small relative to the full range (high–low).
The detection is based on basic body and range geometry:
curr_body = math.abs(close - open)
prev_body = math.abs(close - open )
curr_range = high - low
body_ratio = curr_range > 0 ? curr_body / curr_range : 1.0
bull_engulfing = close > open and close < open and open <= close and close >= open and curr_body > prev_body
bear_engulfing = close < open and close > open and open >= close and close <= open and curr_body > prev_body
is_doji = curr_range > 0 and body_ratio <= doji_body_ratio
On the chart, they appear as:
Small triangle markers below bullish engulfing candles.
Small triangle markers above bearish engulfing candles.
Small circles above doji candles.
All three overlays are optional and can be turned on or off and recolored in the CANDLE PATTERNS group of inputs.
5. Inputs overview
The script organizes settings into clear groups:
DISPLAY SETTINGS : Show bullish/bearish FVGs, show/hide mitigated zones, box extension length, box border width, and maximum number of boxes.
EQUILIBRIUM : Toggle equilibrium lines, color, and line width.
LABELS : Enable labels, choose whether to label unmitigated and/or mitigated zones, and select label size.
BULLISH COLORS / BEARISH COLORS : Separate fill and border colors for bullish and bearish gaps.
MITIGATED STYLE : Opacity used when a gap is marked as mitigated.
STATISTICS : Toggle the on-chart FVG statistics panel.
CANDLE PATTERNS : Show engulfing patterns, show dojis, colors, and the body-to-range threshold that defines a doji.
6. Statistics panel
An optional table in the corner of the chart summarizes the current state of all tracked gaps:
Total number of FVGs still being tracked.
Number of bullish vs bearish FVGs.
Number of unfilled vs mitigated FVGs.
Simple fill rate: percentage of tracked FVGs that have been marked as mitigated.
This can help you study how a particular market tends to treat gaps over time.
7. How you might use it (examples)
These are usage ideas only, not recommendations:
Study how often your symbol mitigates gaps and where inside the zone price tends to react.
Use higher-timeframe context and then refine entries near the equilibrium line on your trading timeframe.
Combine FVG zones with basic candle patterns (engulfing/doji) as an extra visual anchor, if that fits your process.
Hope you enjoy, give your feedback in the comments!
- officialjackofalltrades

VIX/VXV Ratio (TitsNany)This script plots the VXV/VIX ratio, which compares medium-term volatility (90-day fear) to short-term volatility (30-day fear). When the ratio rises above key levels like 1.16 or 1.24, it signals that traders expect future stress, often preceding market pullbacks. When the ratio falls toward or below 1.0, short-term fear is spiking, which typically occurs during active selloffs or volatility events. In short, elevated readings warn of potential market drops ahead, while sharp declines in the ratio reflect panic already hitting the market.

NoProcess PivotsNoProcess Pivots
Visualize the structural framework of price action with NoProcess Pivots, a precision tool for multi-timeframe confluence trading.
Pivots are mathematically derived levels where price statistically finds support, resistance, or equilibrium. Institutional order flow respects these levels as key decision points where liquidity pools form and inefficiencies seek rebalancing.
NoProcess Pivots displays historical pivot ranges as period-bounded zones across Daily, Weekly, and Quarterly timeframes—allowing you to observe how price has respected or violated these levels over time. By projecting ±33% extensions beyond R1/S1, traders can identify targets, retracement levels, and key reversal points.
Cross-reference pivots across multiple timeframes to find confluence zones where Daily, Weekly, and Quarterly levels stack. These high-conviction areas offer the clearest setups for entries and exits.
Features:
Multi-timeframe pivots: Daily, Weekly, Quarterly
Historical levels with adjustable depth
Period-bounded zones
±33% extensions
Adaptive light/dark mode table
Real-time Δ PP percentage
Pivot cross alerts
Built for traders who respect the math behind the markets.

HTF Candles & Levels Visualizer - SRHTF Candles & Levels Visualizer is a clean higher‑timeframe visualization tool designed to complement any trading strategy by giving clear context of larger‑TF structure directly on your current chart. It plots the previous high and low for up to three user‑selectable timeframes, and draws them as extended levels with optional labels, making it easy to see where current price sits relative to key higher‑timeframe zones.
The script also renders compact proxy candles for each selected timeframe to the right of current price, so you can visually track HTF candle development without switching charts. Each HTF slot has independent settings: timeframe, color, number of displayed candles, and visibility toggles, along with global controls for line style, label size, candle spacing, and colors.
This tool does not generate trading signals; it focuses purely on multi‑timeframe context and market structure visualization to support your own entries, exits, and risk management.

The Rumer's Box Theory“The Rumer's Box Theory” is a visual trading indicator that allows traders to quickly identify the previous daily candle’s high and low across any timeframe. It displays a purple box spanning the previous day’s high to low, with a blue horizontal line marking the 50% midpoint for quick reference. The settings also provide options to extend the box and midpoint line to the left, giving traders flexibility in how the indicator appears on the chart.

BLACK SWAN SWEEP (DANIELPEREZ)Crt de velas especificas después del sweep buscar la confirmación del order block para tomar una operacio .
Check specific candlesticks after the sweep to find order block confirmation before taking a trade.

The Rumer's Box Theory“The Rumer's Box Theory” is a visual trading indicator designed to help traders quickly identify the previous daily candle’s high and low ranges across all timeframes. The indicator draws a purple box spanning the previous day’s high to low, with a blue horizontal line at the 50% midpoint for easy reference.

🟡 GOLD 4H HUD v8.9 — Loose ICT OB + Strong/Weak + FVG/HVN/LVNGOLD 4H HUD v8.9 is a clean, structured Smart Money Concepts (SMC)–based analysis tool designed exclusively for XAUUSD on the 4-hour timeframe.
It focuses on the three most important elements for institutional orderflow analysis:
✔ Loose ICT Order Blocks (Demand/Supply)
✔ Fair Value Gaps (FVG)
✔ Volume Profile Zones (HVN/LVN/POC)
The script builds a professional-style HUD that displays the key institutional regions and structural levels that matter most for gold traders.
📌 Key Features
1 — Market Structure Engine (HH/HL & BOS)
The indicator detects:
Minor swing Highs and Lows
Last confirmed HH / HL levels
Break of Structure (BOS) for directional bias
EMA-200 trend filter (UP / DOWN / NEUTRAL)
This gives traders a clean structural read without clutter or noise.
2 — Loose FVG Engine (Tolerance-Based ICT Gaps)
A soft-threshold FVG engine detects “loose” Fair Value Gaps using a 0.1% price tolerance.
This method ensures:
Fewer missed imbalances
Cleaner OB/FVG alignment
Higher accuracy on 4H gold displacement legs
FVGs automatically shift to the right side of the chart for clean visualization.
3 — Order Block Engine (Demand/Supply + Strong/Weak Classification)
A simplified ICT-style OB engine scans the past few candles whenever BOS is detected.
It identifies:
Demand OB during bullish BOS
Supply OB during bearish BOS
Strong OB if fully nested inside an active FVG
Weak OB otherwise
OB boxes include:
Clear color coding (strong vs. weak)
Price range labels inside each box
Automatic right-shift for visual clarity
4 — Volume Profile Engine (POC / HVN / LVN / VAH / VAL)
Based on a rolling window (default 120 bars), the script builds a lightweight volume distribution.
It displays:
POC (Point of Control)
HVN (High Volume Node)
LVN (Low Volume Node)
Value Area High / Low
HVN/LVN zones are shown as right-shifted colored boxes with price labels.
These zones help identify:
Institutional accumulation
Low-liquidity rejection points
Areas where price tends to react strongly
5 — Support / Resistance Mapping
The script automatically generates:
OB-based support/resistance
Swing-high/swing-low levels
HVN/LVN structural levels
These are displayed in the HUD for fast reference.
6 — Professional HUD Panel
A compact, easy-to-read HUD summarizes:
Trend direction
Latest HH/HL
OB ranges (Strong/Weak)
HVN/LVN price zones
POC
Multi-layer support & resistance
This turns the script into a fully functional analysis dashboard.
📌 What This Indicator Is NOT
To avoid misunderstanding:
It does not take entries or generate buy/sell signals
It does not auto-detect CHOCH, MSS, SMT, or sweeps
It is not a trading bot
This tool is designed as an institutional-style map and analysis HUD, not a strategy.
📌 Best Use Case
This indicator is ideal for traders who want to:
Read institutional structure on XAUUSD
Identify clean Demand/Supply zones
Visualize FVG/OB/HVN interactions
Track high-value liquidity levels
Build directional bias on 4H before dropping to execution timeframes
⚠ Important Note
This tool is designed exclusively for the 4H timeframe.
Using it on lower timeframes will display a warning.

3-Bar Inversion Pattern (Entry & Invalidation Levels)Very simple 3-bar inversion pattern looking for a bar that extends in the previous bar's direction, bar 2 having a body no bigger than 50% of bar 1's. and Bar 3 having a body close beyond the open of bar 1. Invalidation is set to the highest point of the 3 par pattern.

HL/2 Fast & Slow - Cloud Signals + Backtest + Exit AlarmsDescription:
This indicator plots two HL/2 moving averages—a fast and a slow line—on the chart, along with dynamic upper and lower bands based on the slow line and ATR. It features a colored cloud between the two averages to visualize trend direction, and it provides buy/sell signals based on the alignment of the two lines.
Key Features:
Fast & Slow HL/2 Averages
Fast and slow HL/2 lines calculated as simple moving averages.
Lines change color based on direction (up/down), configurable via style settings.
Dynamic Upper and Lower Bands
Bands calculated from the slow line using ATR to capture volatility.
Trend Cloud
Fills the area between fast and slow lines.
Green if both lines are rising, red if both are falling, gray if lines disagree.
Transparency adjustable for better visual clarity.
Buy/Sell Signals
Signals appear only when both lines align in the same direction.
Two modes available:
Series Signals: generates a signal whenever the cloud color changes.
Single Signal: generates a signal only when the slow line changes direction.
Signals are plotted as small triangles above/below bars.
Alerts can be set for both buy/sell signals.
Exit Modes and Alerts
Exit positions either on a reverse signal or when the cloud enters a neutral gray zone.
Exit alerts are available for both conditions.
Integrated Backtest Panel
Shows total trades, win rate, and cumulative profit in USD.
Considers position size and commission (configurable).
Panel color indicates profit (green) or loss (red).
Fixed position on chart for easy reference.
Inputs:
Fast and slow periods, ATR length, ATR multiplier.
Position size, commission percentage.
Signal mode (Series or Single).
Exit mode (Reverse Signal or Gray Area).
Style options for line colors and cloud colors.
Time window for backtesting (daily, weekly, monthly, or custom date range).
Usage:
Ideal for identifying trend direction and potential entry points.
Can be used for manual trading or as part of an automated strategy with alerts.
Provides a visual and statistical overview of trading performance via the backtest panel.

Developing Midpoint TrackerDeveloping Midpoint Tracker (DMT)
Original Concept: This indicator tracks key midpoint levels from either session opens or custom timeframe periods, providing precise reference levels for intraday trading decisions.
Dual Tracking Modes:
Session Mode: Tracks midpoints from a specific session start time (e.g., 1800 ET electronic trading open) with full timezone support
Timeframe Mode: Tracks midpoints from any custom timeframe (15m, 1H, 4H, etc.) using higher timeframe OHLC data via request.security()
Core Calculations:
The indicator calculates three distinct midpoint levels:
Open-to-High Midpoint: (Session/Timeframe Open + Highest High) / 2
Open-to-Low Midpoint: (Session/Timeframe Open + Lowest Low) / 2
High-to-Low Midpoint: (Highest High + Lowest Low) / 2
Visual Features:
Horizontal lines extending from the reference period start with customizable colors, styles, and extension length
Smart collision detection prevents duplicate lines at identical price levels
Price labels with transparent backgrounds showing exact values
Optional reference open price line
Real-time info table displaying current mode and all calculated levels
Technical Implementation:
Uses Pine Script's native time() function for accurate session detection across multiple timezones
Employs request.security() for reliable higher timeframe data access
Implements proper line and label management to prevent memory issues
Supports 13 major global timezones including US markets, Europe, and Asia
Use Cases:
Identifying potential support/resistance levels from key price relationships
Setting profit targets and stop levels based on mathematical price midpoints
Analyzing price behavior around session or timeframe-specific reference levels
Multi-timeframe analysis when using custom timeframe mode on lower timeframe charts
This indicator is particularly useful for traders who utilize midpoint reversion strategies or need precise reference levels derived from session or timeframe opens.

Volume Threshold Levels - Crypto LidyaVolume Threshold Levels – Crypto Lidya
Understanding volume behavior is one of the most effective ways to detect trend changes, manipulation candles, aggressive entries, and institutional activity.
Volume Threshold Levels (VTL) not only displays raw volume but also calculates dynamic volume thresholds (2x – 3x – 4x) based on the moving average, allowing you to identify statistically meaningful volume anomalies with precision.
📌 1. Volume Columns
The indicator plots each bar’s volume using traditional column-style visualization.
Green: Bullish candle
Red: Bearish candle
Gray: Neutral candle
This helps traders clearly understand the relationship between price and volume.
📌 2. Average Volume Area
VTL offers two types of moving averages for volume:
SMA (Simple Moving Average)
EMA (Exponential Moving Average)
The average volume is drawn as a soft yellow area across the chart.
This area acts as the baseline for normal volume levels.
📌 3. Dynamic Threshold Lines (2x / 3x / 4x)
The script calculates and displays multipliers of the average volume:
2x Average
3x Average
4x Average
These levels appear as bright yellow lines.
They are extremely useful for identifying breakouts, traps, and aggressive institutional entries.
📌 4. Volume Spike Detection (Alerts)
VTL identifies upward crossovers where volume breaks above key levels:
1x Volume Signal
2x Volume Signal
3x Volume Signal
4x Volume Signal
These can be used directly as TradingView alerts.
This allows you to automate detection of high-impact volume spikes.
📌 5. Use Cases
The indicator performs exceptionally well in:
Breakout confirmation
Liquidity sweep analysis
Detecting manipulation candles
Combining with OB, FVG, or other SMC structures
Scalping and low-timeframe aggressive volume interpretation
Algorithmic filters for volume-based strategies
📌 6. Summary
VTL delivers:
✔ Dynamic average volume baseline
✔ Clear 2x–3x–4x volume thresholds
✔ Accurate detection of upside volume explosions
✔ A strong tool for traders who rely on volume confirmation
Completely open-source and ready to be extended.

CODY BOT – Breakout SignalsCODY BOT is a minimalist, high-probability breakout indicator designed to keep your chart clean while highlighting actionable trading opportunities.
Unlike traditional indicators that generate too many signals, CODY BOT only alerts you to strong directional moves following consolidation, helping you focus on high-quality entries.
Key Features:
Detects breakouts above recent highs and below recent lows.
Filters weak moves using minimum candle body size.
Includes a cooldown period to prevent signal spam.
Clean and intuitive visual signals with large arrows for easy interpretation.
Optional customization for consolidation lookback bars, minimum candle size, and arrow visibility.
Alerts built-in for server-side and mobile notifications.
How to Use:
Look for BUY arrows when price breaks above consolidation highs.
Look for SELL arrows when price breaks below consolidation lows.
Combine with your preferred risk management and trend confirmation strategies.

5% Move Counter (Up vs Down)5% Move Counter (Up vs Down)
This indicator tracks how many times a stock has made a 5% or larger move in a single session, and shows the count separately for up days and down days. It’s meant for traders who want quick context on whether a stock has a history of making large moves, instead of manually scrolling through years of price action.
Most tools only tell you what’s happening right now. This one helps you understand what the stock is capable of.
What it shows
Number of 5%+ up days
Number of 5%+ down days
Optional display modes:
All
Up Only
Down Only
Why it’s useful
Different stocks behave differently. Some give clean, powerful bursts when they break out, while others rarely move big even when the setup looks perfect. This tool helps you gauge a stock’s historical “explosiveness” so you can decide whether your strategy fits its behavior.
If your setups depend on volatility or momentum, it helps to know whether the stock has produced big moves before. This gives you that information instantly.
Customization
You can place the stats box anywhere on the chart using a simple 1–9 selector.
You can hide the rows you don’t need through a dropdown.
When a row is hidden, its background becomes fully transparent so the chart stays clean.
Who it’s for
Short-term traders, breakout traders, swing traders, and anyone who wants a quick read on whether a stock moves enough to justify certain types of trades.

Narayan Candle Up/Down Indicator //@version=5
indicator("Candle Up/Down Indicator", overlay=true)
// Candle colors
candleColor = close > open ? color.green : close < open ? color.red : color.gray
// Plot candles as background
bgcolor(candleColor, transp=80)
// Optional: plot arrow on up/down
plotshape(close > open, title="Up Candle", location=location.belowbar, color=color.green, style=shape.triangleup, size=size.tiny)
plotshape(close < open, title="Down Candle", location=location.abovebar, color=color.red, style=shape.triangledown, size=size.tiny)

Gap Zones with Unfilled AreasA very efficient scalping strategy for BTC. Both for the sell and buy. Take the trade when the price retraces back into 50% of the zone and and aim for a an easy 1:2


Sree Daily RangeVery simple indicator to draw support and resistance levels given the price. It creates a given lebel at the level

SYXX - HTF Candle Overlay
This script, titled "HTF Candle Overlay by SYXX," is designed to visualize the full range and structure of a higher-timeframe (HTF) candle directly onto a lower-timeframe chart. It helps traders maintain context by showing where the current price action sits relative to a much larger candle's boundaries. Combined with LuxAlgo Volume Node Profile.
1. 🔍 Primary Feature: Higher Timeframe Candle Projection
Configurable Timeframe: The user sets the desired HTF using the Interval input, which defaults to 'D' (Daily). The indicator then tracks the High, Low, Open, and Close of that HTF bar.
Live and Historical Drawing: The script uses box.new to draw boxes representing the candle's full range (High to Low).
Historical Boxes (if changeHTF): When a new HTF candle closes, the completed box for the previous period is drawn.
Live Box (if barstate.islast): The indicator draws a live, dynamic box for the current, incomplete HTF candle, which expands with every new High or Low on the lower chart.
2. 🎨 Visualization & Customization
Color-Coded Bias: The boxes are colored based on the HTF candle's direction:
Bullish/Long (BgLong): Green color is used if the HTF candle closed higher than it opened (close > htfOpen).
Bearish/Short (BgShort): Red color is used if the HTF candle closed lower than it opened.
Box Styling: Users can customize the box's appearance, including border color and style, border thickness, and background opacity (BoxOpacity).
Midline: An optional MidLine is calculated as the average of the HTF High and Low, acting as a potential support/resistance reference point.
Range Display: The indicator can display the range of the box in pips (BoxRangePips) or the percentage of movement relative to the full range (BoxRangePercentage).
Time Labels: It plots time labels that show the start and end time of the completed HTF period (e.g., "07:00 - 11:00").
3. 🚨 Alert System (Placeholders)
The script includes placeholder inputs for standard trading alerts, though the internal logic for checking these conditions is currently commented out or set to false:
Alert: Break Above/Below Box: To signal a breakout of the HTF High or Low.
Alert: Price Re-Enters Box: To signal a pullback back into the range.
