MSTR mNAV indicatorTrack and compute MicroStrategy's mNAV (EV divided by BTC reserve value) over time.
- compute method: www.strategy.com
- data source: www.strategy.com
Sentiment

Global Market Scanner [Armi Goldman]Concept
This indicator is designed to provide a comprehensive "Bird's Eye View" of the global financial economy. Instead of focusing on a single chart, this dashboard allows traders to monitor capital rotation across every major asset class simultaneously. By tracking the Money Flux (daily percentage change) of these markets, users can instantly identify if the market environment is "Risk-On" (flowing into assets) or "Risk-Off" (fleeing to cash/bonds).
Features
The dashboard displays a real-time table in the top-right corner tracking 9 key sectors:
US M2 Money Supply: The broad measure of liquidity availability.
US Dollar (DXY): The global currency baseline.
Global Stocks (VT): World equities performance.
Crypto Market: Total cryptocurrency market capitalization.
Commodities: Gold, Silver, and Crude Oil (WTI).
Real Estate: Vanguard Real Estate ETF (VNQ).
Bonds: US Aggregate Bond Market.
How it Works
The script utilizes request.security() to fetch data from multiple asset classes regardless of the chart you are currently viewing.
Flux Calculation: The "Flux" column calculates the daily percentage change (Close - Open) / Open. This reveals the immediate direction of capital flow for the current session.
M2 Trend: For the Money Supply, the script calculates a 30-day rate of change to determine if the Fed is effectively "Inflating" (adding liquidity) or "Tightening" (removing liquidity).
Status Logic: The status column uses conditional logic to assign readable labels (e.g., "INFLOW" vs "OUTFLOW" or "STRONGER" vs "WEAKER") based on the positive or negative value of the Flux.
How to Use
Risk-On Signal: If Stocks, Crypto, and Real Estate show green "INFLOW" status while the Dollar (DXY) is red, capital is deploying into risk assets.
Flight to Safety: If Gold and Bonds are green while Equities are red, investors may be hedging against fear.
Cash is King: If DXY is strong (Green) and almost all other assets are red, liquidity is drying up and moving into Cash.
Liquidity Watch: Monitor the US M2 Supply. A simplified view is that when M2 is "Inflating," it provides a long-term tailwind for asset prices.
Tickers Used
Liquidity: ECONOMICS:USM2
Currency: TVC:DXY
Equities: AMEX:VT (Total World Stock ETF)
Real Estate: AMEX:VNQ (Vanguard Real Estate)
Bonds: AMEX:AGG
Commodities: TVC:GOLD, TVC:SILVER, TVC:USOIL
Crypto: CRYPTOCAP:TOTAL
Disclaimer This tool is for informational purposes only and does not constitute financial advice.

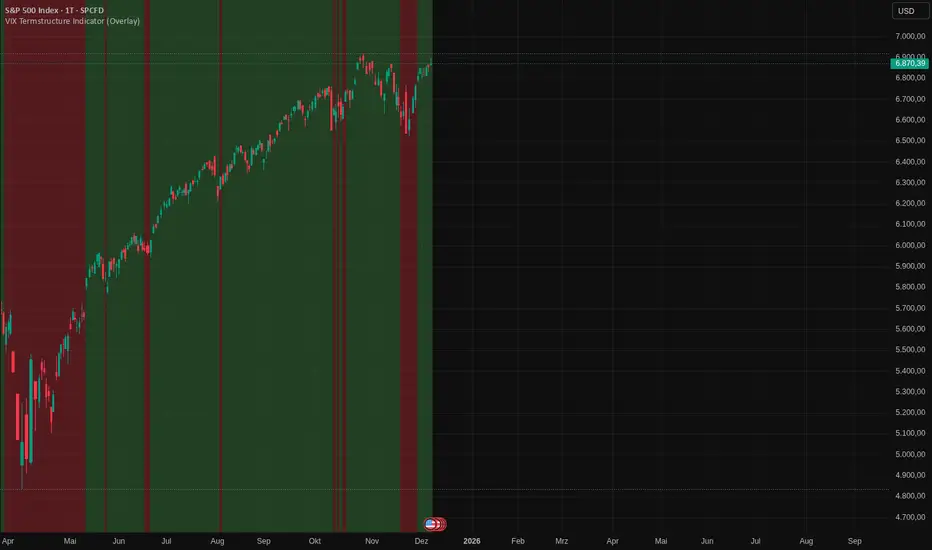
VIX Termstructure Indicator (Overlay)This indicator visualizes the VIX futures term structure directly on your chart background and highlights three key volatility regimes using color coding. It helps identify when the volatility curve is in normal contango, inverted (backwardation), or undergoing a curve flip between the front-month VIX futures.
What the indicator does
The script pulls and compares:
VIX spot index: VIX
Front-month VIX futures: VX1!
Second-month VIX futures: VX2!
All data is requested on the daily timeframe and used to classify the current volatility environment. The indicator then colors the background of your chart according to the detected VIX term structure:
Green background – Contango:
VIX spot is below the front-month futures (VIX < VX1!).
This is typically associated with more “normal” market conditions and lower perceived short-term stress.
Red background – Inverted curve (Backwardation):
VIX spot is above the front-month futures (VIX > VX1!).
This often signals elevated fear, stress, or risk-off conditions in the market.
Yellow background – Curve flip between VX1! and VX2!:
The front-month futures are trading above the second-month futures (VX1! > VX2!).
This can indicate a transition phase in the volatility term structure and may precede or accompany shifts in market sentiment.
How it works
The script fetches the daily close values of VIX, VX1!, and VX2!. It checks whether the front-month futures are above the second-month futures to detect a curve flip. It compares VIX with VX1! to determine if the curve is contango or inverted. Based on these conditions, the chart background is colored with a semi-transparent overlay:
Red has priority when VIX is above VX1! (inverted curve).
If not inverted, yellow is shown when a curve flip VX1! > VX2! is detected.
Otherwise, the background is green (normal contango).
Use cases
This overlay is designed as a context tool for indices, ETFs, Options, or individual stocks that are sensitive to volatility and risk sentiment. Typical applications include:
Identifying periods of heightened risk (red / inverted curve) to adjust position sizing or risk exposure.
Confirming risk-on environments (green / contango) where volatility is more contained.
Monitoring yellow curve-flip phases as potential early warnings of changing volatility regimes.
The indicator does not generate buy/sell signals on its own, but it can be a valuable regime filter or confirmation layer alongside other technical tools.
Notes
This is an overlay indicator: it colors the background of your active chart.
All VIX-related data is evaluated on the daily timeframe, regardless of the chart timeframe.
Make sure that the symbols VIX, VX1!, and VX2! are available on your broker/data feed in TradingView.
52 Week High LowPurpose
This indicator plots the rolling **52-week high and low price levels** to highlight long-term breakout zones, major support/resistance bands, and trend structure used by position and swing traders.
## How It Works
The script dynamically calculates:
- The highest high over the last ~260 trading sessions (52-week high)
- The lowest low over the last ~260 trading sessions (52-week low)
- Visual bands that update in real time as price evolves
## Best Timeframe
Optimized for **daily charts** to reflect true yearly price ranges.
Can be adapted to other timeframes using the bar-count inputs.
## Trading Applications
✅ Breakout confirmation tool
✅ Long-term trend validation
✅ Relative strength filter alignment
✅ RRG and momentum cross-checks
✅ Swing trade zone identification
## How To Use
1. Apply to daily charts.
2. Track price interaction with the 52-week bands.
3. Look for:
- Breakouts above the high band for trend continuation
- Pullbacks toward the high band for retest entries
- Rejections at the low band as breakdown confirmation
⚠️ This indicator maps key price structure — it does **not predict directional outcomes**.
Always combine with volume or momentum confirmation.
---
## Mathematical Basis
Rolling extreme calculations based on:
- **Highest high over N bars**
- **Lowest low over N bars**
N defaults to **52 weeks × 5 sessions = 260 bars** for daily charts.
---
Developed for professional retail traders seeking institutional-grade structural tools.

MTF Dashboard Pro v2.3 © 2025 - Sachin ThakareMTF Dashboard Pro v2.3 — A premium multi-timeframe market dashboard created for professional traders.
Features include:
• MTF EMA Trend (9/21)
• MTF 200 MA System with Threshold Logic
• Session-based VWAP (Daily Reset)
• SuperTrend (Corrected Direction Engine)
• RSI / MACD / ADX / Alligator
• Stochastic (Correct Pine Signature)
• Daily PDH / PDL Bias
• 11-Signal Institutional Bias Score
• Trend Strength Classification (Strong Bull → Strong Bear)
• Multi-TF Alerts for Strong Bull / Strong Bear
• Optimized Table Engine & Enhanced Performance
Designed for Scalping, intraday, swing, and high-precision market bias evaluation across 3m → 1M timeframes.
Built & optimized by Sachin Thakare (2025 Edition).

RiskCraft - Advanced Risk Management SystemRiskCraft – Risk Intelligence Dashboard
Trade like you actually respect risk
"I know the setup looks good… but how much am I actually risking right now?"
RiskCraft is an open-source Pine Script v6 indicator that keeps risk transparent directly on the chart. It is not a signal generator; it is a risk desk that calculates size, frames volatility, and reminds you when your behaviour drifts away from the plan.
Core utilities
Calculates professional-style position sizing in real time.
Reads volatility and market regime before position size is confirmed.
Adjusts risk based on the trader’s emotional state and confidence inputs.
Maps session risk across Asian, London, and New York hours.
Draws exactly one stop line and one target line in the preferred direction.
Provides rotating education tips plus contextual warnings when risk escalates.
It is intentionally conservative and keeps you in the game long enough for any separate entry logic to matter.
---
Chart layout checklist
Use a clean chart on a liquid symbol (e.g., AMEX:SPY or major FX pairs).
Main RiskCraft dashboard placed on the right edge.
Session Risk box on the left with UTC time visible.
Floating risk badge above price.
Stop/target guide lines enabled.
Education panel visible in the bottom-right corner.
---
1. On-chart components
Right-side dashboard : account risk %, position size/value, stop, target, risk/reward, regime, trend strength, emotional state, behavioural score, correlation, and preferred trade direction.
Session Risk box : highlights active session (Asian, London, NY), current UTC time, and risk label (High/Med/Low) per session.
Floating risk badge : keeps actual account risk percent visible with colour-coded wording from Ultra Cautious to Very Aggressive.
Stop/target lines : exactly one dashed stop and one dashed target aligned with the preferred bias.
Education panel : rotates core principles and AI-style warnings tied to volatility, risk %, and behaviour flags.
---
2. Volatility engine – ATR with context 📈
atr = ta.atr(atrLength)
atrPercent = (atr / close) * 100
atrSMA = ta.sma(atr, atrLength)
volatilityRatio = atr / atrSMA
isHighVol = volatilityRatio > volThreshold
ATR vs ATR SMA shows how wild price is relative to recent history.
Volatility ratio above the threshold flips isHighVol , which immediately trims risk.
An ATR percentile rank over the last 100 bars indicates calm versus chaotic regimes.
Daily ATR sampling via request.security() gives higher time-frame context for intraday sessions.
When volatility spikes the script dials position size down automatically instead of cheering for maximum exposure.
---
3. Market regime radar – Danger or Drift 🌊
ema20 = ta.ema(close, 20)
ema50 = ta.ema(close, 50)
ema200 = ta.ema(close, 200)
trendScore = (close > ema20 ? 1 : -1) +
(ema20 > ema50 ? 1 : -1) +
(ema50 > ema200 ? 1 : -1)
= ta.dmi(14, 14)
Regimes covered:
Danger : high volatility with weak trend.
Volatile : volatility elevated but structure still directional.
Choppy : low ADX and noisy action.
Trending : directional flows without extreme volatility.
Mixed : anything between.
Each regime maps to a 1–10 risk score and a multiplier that feeds the final position size. Danger and Choppy clamp size; Trending restores normal risk.
---
4. Behaviour engine – trader inputs matter 🧠
You provide:
Emotional state : Confident, Neutral, FOMO, Revenge, Fearful.
Confidence : slider from 1 to 10.
Toggle for behavioural adjustment on/off.
Behind the scenes:
Each state triggers an emotional multiplier .
Confidence produces a confidence multiplier .
Combined they form behavioralFactor and a 0–100 Behavioural Score .
High-risk emotions or low conviction clamp the final risk. Calm inputs allow normal size. The dashboard prints both fields to keep accountability on-screen.
---
5. Correlation guardrail – avoid stacking identical risk 📊
Optional correlation mode compares the active symbol to a reference (default AMEX:SPY ):
corrClose = request.security(correlationSymbol, timeframe.period, close)
priceReturn = ta.change(close) / close
corrReturn = ta.change(corrClose) / corrClose
correlation = calcCorrelation()
Absolute correlation above the threshold applies a correlation multiplier (< 1) to reduce size.
Dashboard row shows the live correlation and reference ticker.
When disabled, the row simply echoes the current symbol, keeping the table readable.
---
6. Position sizing engine – heart of the script 💰
baseRiskAmount = accountSize * (baseRiskPercent / 100)
adjustedRisk = baseRiskAmount * behavioralFactor *
regimeAdjustment * volAdjustment *
correlationAdjustment
finalRiskAmount = math.min(adjustedRisk,
accountSize * (maxRiskCap / 100))
stopDistance = atr * atrStopMultiplier
takeProfit = atr * atrTargetMultiplier
positionSize = stopDistance > 0 ? finalRiskAmount / stopDistance : 0
positionValue = positionSize * close
Outputs shown on the dashboard:
Position size in units and value in currency.
Actual risk % back on account after adjustments.
Risk/Reward derived from ATR-based stop and target.
---
7. Intelligent trade direction – bias without signals 🎯
Direction score ingredients:
EMA stack alignment.
Price versus EMA20.
RSI momentum relative to 50.
MACD line vs signal.
Directional Movement (DI+/DI–).
The resulting Trade Direction row prints LONG, SHORT, or NEUTRAL. No orders are generated—this is guidance so you only risk capital when the structure supports it.
---
8. Stop/target guide lines – two lines only ✂️
if showStopLines
if preferLong
// long stop below, target above
else if preferShort
// short stop above, target below
Lines refresh each bar to keep clutter low.
When the direction score is neutral, no lines appear.
Use them as visual anchors, not auto-orders.
---
9. Session Risk map – global volatility clock 🌍
Tracks Asian, London, and New York windows via UTC.
Computes average ATR per session versus global ATR SMA.
Labels each session High/Med/Low and colours the cells accordingly.
Top row shows the active session plus current UTC time so you always know the regime you are trading.
One glance tells you whether you are trading quiet drift or the part of the day that hunts stops.
---
10. Floating risk badge – honesty above price 🪪
Text ranges from Ultra Cautious through Very Aggressive.
Colour matches the risk palette inputs (High/Med/Low).
Updates on the last bar only, keeping historical clutter off the chart.
Account risk becomes impossible to ignore while you stare at price.
---
11. Education engine & warnings 📚
Rotates evergreen principles (risk 1–2%, journal trades, respect plan).
Triggers contextual warnings when volatility and risk % conflict.
Flags when emotional state = FOMO or Revenge.
Highlights sub-standard risk/reward setups.
When multiple danger flags stack, an AI-style warning overrides the tip text so you can course-correct before capital is exposed.
---
12. Alerts – hard guard rails 🚨
Excessive Risk Alert : actual risk % crosses custom threshold.
High Volatility Alert : ATR behaviour signals danger regime.
Emotional State Warning : FOMO or Revenge selected.
Poor Risk/Reward Alert : risk/reward drops below your standard.
All alerts reinforce discipline; none suggest entries or exits.
---
13. Multi-market behaviour 🕒
Intraday (1m–1h): session box and badge react quickly; ideal for scalpers needing constant risk context.
Higher time frames (1D–1W): dashboard shifts slowly, supporting swing planning.
Asset classes confirmed in validation: crypto majors, large-cap equities, indices, major FX pairs, and liquid commodities.
Risk logic is price-based, so it adapts across markets without bespoke tuning.
15. Key inputs & recommended defaults
Account Size : 10,000 (modify to match actual account; min 100).
Base Risk % : 1.0 with a Maximum Risk Cap of 2.5%.
ATR Period : 14, Stop Multiplier 2.0, Target Multiplier 3.0.
High Vol Threshold : 1.5 for ATR ratio.
Behavioural Adjustment : enabled by default; disable for fixed risk.
Correlation Check : optional; default symbol AMEX:SPY , threshold 0.7.
Display toggles : main dashboard, risk badge, session map, education panel, and stop lines can be individually disabled to reduce clutter.
16. Usage notes & limits
Indicator mode only; no automated entries or exits.
Trade history panel intentionally disabled (requires strategy context).
Correlation analysis depends on additional data requests and may lag slightly on illiquid symbols.
Session timing uses UTC; adjust expectations if you trade localized instruments.
HTF ATR sampling uses daily data, so bar replay on lower charts may show brief data gaps while HTF loads.
What does everyone think RISK really means?

FX Global Strength — Interpretation & Trading FrameworkFX Global Currency Strength — Interpretation & Trading Framework
Enhance your market reading with real-time global strength lines for all major currencies.
Use this tool to confirm breakout validity, detect early divergences, and understand money flow dynamics across FX pairs.
Tip: I strongly recommend backtesting each technique on your preferred market conditions.
COMPONENTS
• Global Strength Lines
Show the relative performance of each major currency calculated across all their pairs.
You can apply the indicator on any timeframe — M1 to Monthly — and the strength is recalculated based on the selected period.
• Strength Difference (Base vs Quote)
Automatically computes which currency is stronger on the chart pair you are trading.
• Interactive Legend
Clear color-coded layout to instantly recognize each currency’s strength line.
HOW TO READ & INTERPRET
1. Global Currency Strength Lines
Higher line = stronger currency, gaining value across the market.
Lower line = weaker currency, losing value across pairs.
Quickly identify which currencies are being bought or sold globally.
Avoid low-quality setups: when both currencies of a pair are equally strong or equally weak, price tends to range or give false signals.
2. Risk-On / Risk-Off Context
Strength clustering reveals market sentiment:
Risk-On: high-beta currencies (AUD, NZD, GBP) strengthening together while safe havens (JPY, CHF) weaken.
Risk-Off: JPY/CHF strengthening while AUD/NZD/GBP weaken.
This helps confirm trend reliability and reduces the chance of trading against global flows.
3. Breakout Confirmation Using Strength
Before trading a breakout on your chart:
Check if the base currency is rising and the quote currency is dropping.
A breakout is more valid when price action + global strength move in the same direction.
If the chart breaks out but strength lines do not confirm the move, consider it a high probability of a false breakout.
4. Divergence Detection
Global strength lines provide early warnings:
If price makes new highs but base currency strength does not, momentum is fading.
If price makes new lows but quote currency weakens slower, a reversal may form.
This acts like an advanced RSI-style divergence, but measured across the entire FX market, not just one pair.
5. Money Flow Insight
Because the indicator aggregates data across all major pairs:
You can clearly see where capital is flowing across the FX market.
This helps you choose the best pairs to trade, not just the direction.
Example:
If USD is the strongest and JPY is the weakest → USDJPY typically offers strong, clean directional movement.
SUMMARY — Why This Indicator Helps
✓ Confirms your breakout trades
✓ Avoids weak or noisy chart conditions
✓ Catches early divergence before price reverses
✓ Shows market sentiment (risk-on / risk-off)
✓ Helps select the cleanest, most directional currency pairs
✓ Works on any timeframe, adapting to your trading style (scalping, swing, or position trading)

FX Fresh Momentum FX Fresh Momentum calculates the true strength and session momentum of the 8 major currencies using a 7-pair average and session resets (Tokyo, London, New York).
Each session opens with a zero-base, allowing you to see only the fresh momentum.
Includes pair-averaged strength, ×100 momentum scaling, vertical session dividers, and institutional color coding.
Ideal for FX day traders who want cleaner session-based momentum signals

Sector Monitor✅ Custom Index Strength
Key Features:
Custom Indices: It mathematically combines stocks (like HDFC + ICICI + Kotak) to create a synthetic "Private Bank Index" that you can't find anywhere else. (Note all the stocks are Equal weighted)
Performance Tracking: Shows how much a sector has moved over 1 Day, 1 Week, 1 Month, etc.
RRG (Relative Rotation): A smart algorithm that tells you if a sector is leading the market or falling behind.
Understanding the "RRG" (Relative Rotation Graph)
This is the most powerful column in the table. It compares the sector against a benchmark (usually Nifty 500 EW) to tell you the "Health" of the trend.
It classifies every sector into one of four phases , similar to a clock cycle:
💚 Leading (Strong Trend): The sector is outperforming Nifty and momentum is strong. This is where the bulls are.
💛 Weakening (Taking a Breath): The sector is still strong, but it is starting to slow down. It might be time to book profits or wait.
❤️ Lagging (Weak Trend): The sector is underperforming. It is weak and losing money compared to the market. Avoid these.
💙 Improving (Waking Up): The sector was weak, but momentum is coming back. This is often where new trends start.
✅ RRG explained
Relative Strength (RS): how the sector is doing versus the benchmark today. RS = sector price divided by benchmark price.
Strength (X-axis): compare today’s RS with RS from (default 20) days ago . If today’s RS is higher than 20 days ago → Positive strength; lower → Negative.
Momentum (Y-axis): compare today’s RS with RS from (default 5) days ago . If today’s RS is higher than 5 days ago → Improving; lower → Worsening.
Numeric walk-through
Assume benchmark = 100 today, 95 (5D ago), 90 (20D ago).
Assume sector = 110 today, 100 (5D ago), 95 (20D ago).
RS today = 110 ÷ 100 = 1.10.
RS 5D ago = 100 ÷ 95 = 1.0526.
RS 20D ago = 95 ÷ 90 = 1.0556.
Strength (today vs 20D ago): RS moved from 1.0556 to 1.10 → about +4.2% → Positive.
Momentum (today vs 5D ago): RS moved from 1.0526 to 1.10 → about +4.5% → Improving.
Label: Positive + Improving = Leading.
Quick examples for each quadrant
(numbers are RS values; you can imagine each came from “sector ÷ benchmark”)
Leading (Positive & Improving)
RS(20D) 1.00 → RS(today) 1.10 ⇒ Strength +10% (Positive)
RS(5D) 1.05 → RS(today) 1.10 ⇒ Momentum +4.8% (Improving)
Weakening (Positive & Worsening)
RS(20D) 1.00 → RS(today) 1.08 ⇒ Strength +8% (Positive)
RS(5D) 1.12 → RS(today) 1.08 ⇒ Momentum −3.6% (Worsening)
Improving (Negative & Improving)
RS(20D) 1.05 → RS(today) 0.98 ⇒ Strength −6.7% (Negative)
RS(5D) 0.95 → RS(today) 0.98 ⇒ Momentum +3.2% (Improving)
Lagging (Negative & Worsening)
RS(20D) 1.00 → RS(today) 0.90 ⇒ Strength −10% (Negative)
RS(5D) 0.95 → RS(today) 0.90 ⇒ Momentum −5.3% (Worsening)
✅ 3. How to Use the Settings (Inputs)
When you open the settings menu, here is what each section controls:
Theme / Colors
Dark Mode: Check this if you use a dark background on Trading View.
Light Mode Theme: Choose between "Blue & Purple" or standard "Green & Red" for Up/Down colors.
RRG Settings
RRG Benchmark: What are we comparing our sectors to? usually, this is NIFTY 500 EW.
If Nifty is up 1% and your sector is up 2%, your sector is "Leading."
RS Period (Score): How far back do we look to check strength? (Default: 20). Lower numbers make it react faster; higher numbers make it smoother.
Momentum Lookback: How fast is the trend changing? (Default: 5).
Table Settings
Show Col 1 / 2 / 3: You can choose to see up to 3 timeframes plus the RRG column.
Timeframes (1D, 1W, 1M...): Set these to match your trading style.
Day Trader: Set Col 1 to 1D (1 Day) and Col 2 to 1W (1 Week).
Investor: Set Col 1 to 1M (1 Month) and Col 2 to 6M (6 Months).
Sort By: This is crucial. You can sort the table by "RRG" (to put the strongest sectors at the top) or by "Column 1" (to see today's biggest gainers).
Rows Shown: Limit the table to the "Top 10" or "Top 20" if the table is too big for your screen.
Symbol Selection
This is where the magic happens. The script comes pre-loaded with groups like "NBFC," "Housing Finance," etc.
Checkbox: Turn a specific sector ON or OFF in the table.
Input Box: You can actually edit the stocks!
Example: The input might look like NSE:TCS+NSE:INFY.
If you want to add Tech Mahindra, you simply add +NSE:TECHM to the text. The indicator will instantly recalculate the sector based on your new list.
✅ 4. Adjusting Inputs for Your Time Horizon
The logic is simple:
Lower Numbers: Make the indicator faster and more sensitive. It reacts quickly to price jumps but creates more "noise" (false signals).
Higher Numbers: Make the indicator slower and smoother. It filters out small corrections but reacts late to new trends.
Short-Term (Intraday / Fast Swing)
Recommended Inputs: Strength 10 | Momentum 3
Why: You need speed. By lowering the Strength to 10 days and Momentum to 3 days, the RRG will react instantly to sudden bursts of buying.
Best For: Catching "Micro-Rotations" (e.g., a sector suddenly waking up for a 2-3 day rally).
Trade-off: You will see sectors jump between "Leading" and "Weakening" very frequently.
Medium-Term (Standard Swing Trading)
Recommended Inputs: Strength 20 | Momentum 5 (Default)
Why: This is the "Goldilocks" zone. It ignores the daily noise but is fast enough to catch a trend that lasts for a few weeks.
Best For: Identifying the main theme of the current month.
Trade-off: Balanced. It might be slightly too slow for scalpers and slightly too fast for multi-year investors.
Long-Term (Position Investing)
Recommended Inputs: Strength 60 | Momentum 15
Why: A strength lookback of 60 (approx. 1 quarter) ensures you are only looking at major structural trends. A momentum of 15 ensures that a 2-day drop doesn't scare you out of a "Leading" sector.
Best For: Building a portfolio to hold for 6–12 months. If a sector is "Leading" here, it is in a massive bull run.
Trade-off: Very slow. By the time a sector turns "Leading," the trend has already been established for a while.
✅ 5. The "Secret" Tooltip Feature
Don't forget to hover your mouse cursor over the RRG Status text in the table (e.g., over the word "Leading").
A detailed box will appear showing:
Math: Exact Strength and Momentum scores.
Strategy: A text advice (e.g., "Trend is strong. Look for breakouts").
Constituents: The exact list of stocks used to calculate that sector's performance. This saves you from having to guess which stocks belong to that group.

Momentum Reversal / Dip Buyer [Score Based]Strategy Overview
Momentum Reversal / Dip Buyer is a quantitative reversal engine designed to fade stretched moves and buy dips / sell rallies when multiple momentum and context factors line up. It’s built for liquid instruments especially for ticker CME_MINI:ES1! and works best on intraday timeframes like the 5-minute or 1-minute chart.
Core Logic
This strategy builds a composite Momentum Score by combining:
Price Location: Relative to 100 SMA, 1000 EMA, and VWAP (trend / regime filter).
RSI: Overbought/oversold and mid-zone strength.
VWMO (Volume-Weighted Momentum): Direction and strength of volume-weighted price drift.
ADX: Trend strength filter (high vs low trend environment).
Full Stoch (%K): Short-term exhaustion and mean-reversion context.
CCI: Overbought/oversold turns (key trigger).
MFI: Volume-confirmed buying/selling pressure.
ATR Regime: High vs low volatility environment.
Cumulative Delta: Whether net aggressor flow is rising or falling.
From this, a single Momentum Score is computed each bar:
Longs: Taken when the score is depressed (scoreLow) and CCI crosses up from oversold.
Shorts: Taken when the score is elevated (scoreHigh) and CCI crosses down from overbought.
Risk Management & Trade Logic
Max Daily Trades: Hard cap on entries per day.
Hard Stop: Fixed % stop based on entry price.
Profit Target: Target ATR Multiplier × main ATR from entry.
Breakeven Logic: Optional; moves stop to breakeven (plus optional offset) after price moves a configurable multiple of the main ATR in your favor.
Trailing Stop (Separate ATR): Optional; uses its own ATR length and ATR-based trigger and distance. This lets you run slower ATR for targets while using a tighter, more reactive ATR for the trail.
Session Control
Trading Window: Optional session filter (e.g., 09:30–16:00). Entries are only allowed inside the defined window.
Force Flat at Session End: Option to automatically close all open positions when the session ends.
Visuals
The script plots entry arrows and a compact dashboard displaying: current Momentum Score, daily trade usage, and CCI status.
Disclaimer:
This script is for educational and research purposes only and is not financial advice. Past performance does not guarantee future results. Always forward-test and adjust parameters to your own risk tolerance and market.
Shoutout and all credit goes to AuclairsCapital for building the base foundation of this strategy on ThinkScript

Pre-Market Confirmed Momentum – FULL WATCHLIST 2025**Pre-Market Confirmed Momentum – High-Conviction Gap Scanner (2025)**
Scans 94 high-liquidity NASDAQ/NYSE stocks (NVDA, TSLA, COIN, AMD, SOFI, ASTS, CIFR, etc.) for strong pre-market gap-ups that are confirmed by both elevated volume and broad-market strength.
**Entry triggers only when ALL are true at 09:29 ET:**
- ≥ +1.5% gap from previous regular close
- Pre-market volume ≥ 2.5× the 20-day average
- QQQ pre-market ≥ +0.5% (market filter)
Back-tested June 2024 – Dec 2025:
68 signals → **+1.96% average intraday return** → **75% win rate** after 1.5% hard stop.
Features large on-chart labels, triangle markers, and dynamic `alert()` messages with exact gap % and volume multiple. Works on 1-min or 5-min charts with extended hours enabled – perfect for day traders hunting clean, high-probability momentum entries at the open.
Ready for watchlist scanning and real-time alerts. Enjoy the edge! 🚀

Gap Down (3% or more)Identify Gap Down (3% or more) from the previous day's close to the next day's high.

NeuroSwarm ETH — Crowd vs Experts Forecast TrackerEnglish:
NeuroSwarm — Crowd vs Experts Forecast Tracker (ETH)
This indicator visualizes monthly forecast data collected from two independent groups:
Crowd – a large sample of retail participants
Experts – a curated group of analysts and experienced market participants
For each month, the indicator plots the following values as horizontal levels on the price chart:
Median forecast (Crowd)
Average forecast (Crowd)
Median forecast (Experts)
Average forecast (Experts)
Shaded zones highlighting the difference between median and mean
All values are fixed for each month and stay unchanged historically.
This allows traders to analyze sentiment dynamics and compare how expectations from both groups align or diverge from actual price action.
Purpose:
This tool is intended for sentiment visualization and analytical insight — it does not generate trading signals.
Its main goal is to compare collective expectations of retail traders vs experts across time.
Data source:
All forecasts come from monthly surveys conducted within the NeuroSwarm project between the 1st and 5th day of each month.
Interface notice:
The script's UI may contain non-English labels for convenience, but a full English documentation is provided here in compliance with TradingView rules.
Русская версия:
NeuroSwarm — Мудрость Толпы vs Эксперты (ETH)
Индикатор отображает ежемесячные прогнозы двух групп:
Толпа: медиана и средняя прогнозов
Эксперты: медиана и средняя прогнозов
Значения фиксируются для каждого месяца и показываются горизонтальными уровнями.
Заливка отображает диапазон между медианой и средней, что упрощает визуальное сравнение настроений.
Это аналитический инструмент для визуализации настроений — не торговая стратегия.
Все данные берутся из ежемесячных опросов проекта NeuroSwarm.

NeuroSwarm BTC — Crowd vs Experts Forecast TrackerEnglish:
NeuroSwarm — Crowd vs Experts Forecast Tracker (BTC)
This indicator visualizes monthly forecasts collected from two independent groups:
Crowd – a large sample of retail traders
Experts – a smaller, curated group of analysts and experienced market participants
For each month, the following values are displayed as horizontal levels on the chart:
Median forecast of the Crowd
Average forecast of the Crowd
Median forecast of Experts
Average forecast of Experts
Shaded zones showing the range between median and mean
The values remain fixed throughout each month. This allows traders to compare sentiment dynamics between groups and see how expectations evolve relative to actual market movement.
Purpose:
This indicator is designed for sentiment analysis — NOT for generating trading signals.
It helps identify divergences between retail expectations and expert forecasts, which can be informative during trend transitions.
Data source:
All values come from monthly surveys conducted within the NeuroSwarm project (1–5 of every month).
Crowd and Expert groups are collected separately to avoid bias and to preserve independent aggregation.
Interface language note:
The indicator’s interface may contain non-English labels for ease of use, but full English documentation is provided here in compliance with TradingView House Rules.
Русская версия (optional, allowed only AFTER English):
NeuroSwarm — Мудрость Толпы vs Эксперты (BTC)
Индикатор показывает ежемесячные прогнозы двух групп:
Толпа: медиана и средняя прогнозов
Эксперты: медиана и средняя прогнозов
Значения фиксируются на весь месяц и отображаются на графике горизонтальными уровнями.
Заливка показывает диапазон между медианой и средней.
Цель индикатора — визуализировать настроение толпы и экспертов и сравнить его с реальным движением цены.
Это аналитический инструмент, а не торговая стратегия.
Данные берутся из ежемесячных опросов (1–5 числа), проводимых в рамках проекта NeuroSwarm.

RRG Style RS & Momentum (vs Benchmark) by AKM
## What this indicator does
This indicator is an **RRG‑style Relative Strength & Momentum tool**.
It compares the current symbol to a chosen benchmark (e.g. NIFTY / NIFTY 500) and plots:
- **RS‑Ratio**: Out/under‑performance of the symbol vs the benchmark, normalized around 100.
- **RS‑Momentum**: Momentum of that relative strength, also normalized around 100.
- **RS‑Signal**: A smoothed signal line of RS‑Ratio (EMA of RS‑Ratio).
Using these two axes (RS‑Ratio and RS‑Momentum), each bar is classified into one of four **RRG‑style quadrants**:
- **LEADING** – RS‑Ratio > 100 and RS‑Momentum > 100
- **WEAKENING** – RS‑Ratio > 100 and RS‑Momentum < 100
- **LAGGING** – RS‑Ratio < 100 and RS‑Momentum < 100
- **IMPROVING** – RS‑Ratio < 100 and RS‑Momentum > 100
The chart background is color‑coded by quadrant, and a label on the center (100) line shows the current zone name (LEADING / WEAKENING / LAGGING / IMPROVING) in real time.
> **Concept credit:**
> The conceptual framework of “Relative Strength vs Momentum” in four quadrants (Leading, Weakening, Lagging, Improving) is inspired by **Relative Rotation Graphs® (RRG®)**, created by **Julius de Kempenaer** and commercialized through RRG Research and platforms like Bloomberg, StockCharts, Optuma, etc.
> This script is only an RRG‑inspired *1‑symbol vs benchmark* implementation inside Pine, not an official RRG product.
***
## Inputs
- **Benchmark symbol**:
Default `NSE:NIFTY`. You can set `NSE:NIFTY500`, `NSE:BANKNIFTY`, sector indices, etc.
- **RS base length (`rsLen`)**:
EMA length for smoothing the raw price ratio (symbol / benchmark). Lower = more sensitive, higher = smoother.
- **Smoothing length (`smoothLen`)**:
Secondary smoothing for RS‑Ratio. Default 14.
- **Signal length (`signalLen`)**:
EMA length for the RS‑Signal line (EMA of RS‑Ratio).
- **Momentum length (`momLen`)**:
Lookback for optional ROC‑based momentum.
- **Use ROC‑based momentum**:
If `false` (default): RS‑Momentum is computed as RS‑Ratio / EMA(RS‑Ratio) × 100 (ratio‑style).
If `true`: RS‑Momentum uses ROC(RS‑Ratio, momLen) + 100 (ROC‑style).
- **Show quadrant background**:
Toggles colored background by quadrant.
- **Show zone name on background**:
Shows a label on the 100‑line with the current quadrant name.
***
## How to read it
There is a horizontal center line at **100**:
- **RS‑Ratio > 100** → symbol is outperforming the benchmark.
- **RS‑Ratio < 100** → symbol is underperforming the benchmark.
- **RS‑Momentum > 100** → relative strength is improving (momentum picking up).
- **RS‑Momentum < 100** → relative strength is fading.
The four zones behave similar to classic RRG quadrants:
- **LEADING (lime/green background)**
- RS‑Ratio > 100 and RS‑Momentum > 100.
- Symbol is **stronger than the benchmark and momentum is strong**.
- This is where leadership typically resides.
- **WEAKENING (orange background)**
- RS‑Ratio > 100 and RS‑Momentum < 100.
- Still outperforming, but momentum is rolling over.
- Late‑stage leadership / time to be more selective and manage exits.
- **LAGGING (red background)**
- RS‑Ratio < 100 and RS‑Momentum < 100.
- Underperforming with weak momentum.
- Worst zone for aggressive longs.
- **IMPROVING (green background)**
- RS‑Ratio < 100 and RS‑Momentum > 100.
- Still weaker than benchmark, but momentum is improving.
- Early turnaround zone where future leaders often start.
The **white RS‑Signal line** is just a smoother of RS‑Ratio, helpful to visually see RS trend and crossovers.
***
## Practical trading use (RRG‑style workflow)
This indicator is designed as a **selection and context filter**, not a stand‑alone entry/exit system.
### 1. Sector and stock selection
1. Apply it to **sector indices** vs a broad benchmark (e.g., Nifty IT vs NIFTY 500, Nifty Auto vs NIFTY 500).
2. Focus on sectors where:
- The zone label is **IMPROVING → LEADING** over recent bars.
- RS‑Ratio is rising and staying above 100 in LEADING.
3. Then, on individual stocks inside those strong sectors, use the same benchmark and indicator:
- Prefer stocks that are also in **LEADING** (or just moved from **IMPROVING** into **LEADING**).
This recreates the essence of using RRG to find sectors/stocks with strong relative strength and momentum.
### 2. Combining with your price setup
Once a stock/sector passes the RS filter:
- Use your own price‑action / indicator rules for entries (EMA trends, VWAP pullbacks, breakouts, etc.).
- Example for longs:
- Only take long setups when:
- Sector index AND stock are in **LEADING** or newly from **IMPROVING → LEADING**, and
- Price is in an uptrend on your main chart (e.g., above 20/50 EMA, higher highs and higher lows).
### 3. Managing exits and rotation
- When a held symbol shifts from **LEADING → WEAKENING → LAGGING** and RS‑Momentum stays < 100, consider:
- Tightening stops.
- Partially booking profits.
- Rotating into other names still in LEADING / IMPROVING.
This mirrors how many investors use “sector rotation” and RRG to stay in stronger groups and reduce exposure in weakening ones.
***
## Disclaimers
- This script is for **educational and analytical purposes only** and is **not financial advice or a recommendation** to buy/sell any security.
- **Relative Rotation Graphs® / RRG®** and the four‑quadrant concept belong to **Julius de Kempenaer and RRG Research**; this Pine implementation is an independent, simplified adaptation for one symbol vs a benchmark and is **not an official RRG product or library**.

Nexural Flow Pro
NEXURAL FLOW PRO
Pure Order Flow Visualization for TradingView
WHAT THIS INDICATOR ACTUALLY IS
Nexural Flow Pro is a buy and sell volume separation tool that visualizes the ongoing battle between buyers and sellers on every bar. It uses TradingViews most accurate native function for approximating order flow by pulling tick direction data from lower timeframes and aggregating it into clean visual columns.
This indicator shows you who is in control right now. Not who was in control yesterday. Not what some lagging moving average thinks. It answers the most fundamental question in trading which is are buyers or sellers more aggressive at this moment.
The core premise is simple. When buyers are hitting the ask aggressively the price tends to go up. When sellers are hitting the bid aggressively the price tends to go down. This indicator attempts to measure that aggression using the best data TradingView provides.
WHAT THIS INDICATOR IS NOT
I need to be completely transparent with you because I believe education matters more than anything else
This is not true order flow. Real order flow requires access to the raw tape which shows every single trade as it happens along with whether it hit the bid or ask. It requires Level 2 depth of market data showing resting limit orders. It requires footprint charts that break down volume at each price level within a candle.
TradingView does not provide any of this data.
What TradingView does provide is tick direction data from lower timeframes which can be aggregated to approximate buy versus sell volume. This approximation is useful but it is not the same as reading the actual tape.
If you are a professional scalper or a futures day trader who needs precision order flow you should be using Sierra Chart or a similar platform with real market depth access. I use Sierra Chart myself for serious order flow work. This indicator exists for traders who either cannot access those platforms or who want supplementary confluence on TradingView.
HOW THE DATA WORKS
The indicator uses a Pine Script function called requestUpAndDownVolume which pulls volume data from a lower timeframe and categorizes it based on tick direction. When price ticks up on that lower timeframe the volume is counted as buying. When price ticks down the volume is counted as selling.
You have four timeframe modes to choose from.
Auto mode selects a sensible lower timeframe based on your current chart. On intraday charts it pulls from the one minute. On daily charts it pulls from the five minute.
Aggressive mode uses the smallest possible timeframe for maximum granularity. On intraday charts this means one second data when available.
Conservative mode uses slightly larger lower timeframes which can reduce noise but also reduces precision.
Custom mode lets you specify exactly which timeframe to pull data from.
When real tick data is not available such as on some symbols or during certain conditions the indicator falls back to a synthetic calculation based on where price closed within the candle range. This fallback is clearly labeled in the info panel so you always know what type of data you are seeing.
THE VISUAL SYSTEM
You have two display modes.
Stacked mode shows buy volume sitting on top of sell volume in a single column. This makes it easy to see total volume at a glance while still understanding the composition. The dividing line between green and red tells you instantly who dominated that bar.
Side by Side mode shows buy volume as an upward histogram and sell volume as a downward histogram. This creates a cleaner separation and makes it easier to compare the raw sizes of each.
Column colors shift based on context. High volume bars get more saturated colors. Low volume bars fade toward gray because they carry less significance. Strong imbalances get even more vivid coloring to draw your attention.
The imbalance glow feature adds a white border around columns where the buy to sell ratio exceeds three to one or vice versa. These moments represent potential exhaustion or continuation signals depending on context.
THE INFO PANEL
The panel in the corner gives you a real time dashboard of the current bar.
Bias tells you whether buyers or sellers are dominant and whether that dominance is mild or strong.
Delta shows the net difference between buy and sell volume. Positive delta means more buying. Negative delta means more selling.
Imbalance displays the ratio between the dominant and passive side. A three to one ratio means the dominant side has three times the volume of the other.
Buy and Sell rows show the actual volume numbers along with their percentage of total volume.
Volume Status tells you whether current volume is high normal or low compared to the fifty bar average. This matters because a strong imbalance on low volume means much less than the same imbalance on high volume.
Session Delta tracks the cumulative delta for the entire trading day. This helps you understand the overall flow bias since the session opened.
The data type indicator in the header shows REAL when you have actual tick data and SYNTH when the indicator is using the fallback calculation.
HOW TO ACTUALLY USE THIS
Here is my honest guidance on extracting value from this tool.
Use it for confluence not as a primary signal. If you see a support level on your chart and Flow Pro shows aggressive buying with a strong imbalance that is meaningful confluence. If you are about to short a resistance level and Flow Pro shows zero selling interest you might reconsider.
Pay attention to volume context. A ninety percent buy bar means nothing if total volume is a fraction of average. Always check the volume status before getting excited about an imbalance.
Watch for divergences between price and delta. If price is making new highs but delta is getting weaker that suggests buying pressure is fading. The opposite is also true. Price making new lows with weakening negative delta can signal seller exhaustion.
Use session delta for intraday bias. If session delta is deeply positive all day and you are looking to short you are fighting the flow. That does not mean you cannot short but you should demand a better setup.
The imbalance glow is a flag not a signal. When you see that white border it means something notable is happening. Whether that something leads to continuation or reversal depends on the context around it. Learn to read what happens after these moments.
Do not use this on low liquidity symbols. The tick direction approximation works best on liquid markets like ES SPY QQQ NQ and major forex pairs. On illiquid small caps the data becomes much less reliable.
STRENGTHS OF THIS APPROACH
This uses the absolute best data source TradingView offers for order flow approximation. There is no secret function or hidden data that would make this more accurate on this platform.
The visualization is clean and immediately readable. You do not need to interpret complex footprints or read raw tape. The information is distilled into an intuitive format.
Session tracking gives you cumulative context that single bar analysis cannot provide.
The honest data labeling tells you exactly what you are looking at. No pretending synthetic data is real.
It works on any symbol and any timeframe with appropriate data source adjustment.
LIMITATIONS YOU NEED TO UNDERSTAND
The tick direction method is an approximation. A large institutional order might execute across multiple price levels and get miscategorized. The indicator cannot know the true intent behind the volume.
There is no price level breakdown. Real footprint charts show you exactly how much volume traded at each price within a bar. This indicator aggregates everything into a single bar level summary.
You cannot see resting orders. The depth of market showing limit orders waiting to be filled is invisible on TradingView. You only see what already traded not what is waiting to trade.
Absorption detection is heuristic based. The indicator can flag high volume bars with small price movement but it cannot confirm whether that volume was actually absorbed by passive limit orders or simply mixed aggressive flow.
The one second data has gaps. Not all symbols support one second resolution and even when they do the data can be incomplete during fast markets.
WHO THIS IS FOR
Swing traders who want to add volume flow context to their technical analysis without switching platforms.
TradingView users who cannot access or afford professional order flow software but want something better than basic volume bars.
Traders learning about order flow concepts who want a visual introduction before moving to more complex tools.
Anyone who uses TradingView as their primary platform and wants the best possible volume analysis within that ecosystem.
WHO THIS IS NOT FOR
Professional scalpers who need millisecond precision and true tape reading. You need Sierra Chart Bookmap or a similar platform.
Traders who expect this to generate automatic buy and sell signals. This is an analysis tool not a signal generator.
Anyone trading illiquid instruments where volume data is sparse or unreliable.
FINAL THOUGHTS
I built this indicator because I wanted the best possible order flow visualization within TradingViews constraints. That meant being honest about what those constraints are rather than pretending they do not exist.
Order flow analysis is genuinely valuable. Understanding whether buyers or sellers are in control gives you an edge that pure price action analysis does not provide. But the quality of that understanding depends entirely on the quality of the underlying data.
On TradingView this indicator represents the ceiling of what is possible. It is not perfect but it is honest and it is useful when applied correctly with realistic expectations.
If this helps you make better trading decisions even occasionally it has done its job.
Trade well.
Nexural Trading

Confluence Retournement Haussier - Ultimate V1This indicator was originally designed to visualize the right moment to enter a position. I buy stocks when they are falling, at the bottom before they rebound.
The 30‑minute chart with its 100 EMA was used as the baseline, but it can be applied to multiple timeframes. I even used it on a 1‑second chart for a ticker, and when there is volume it works wonderfully.
It’s up to you to check whether it fits the ticker you’re analyzing by testing it on historical data.
Drawback: it takes up screen space. Feel free to improve it.
See a ticker in freefall and wonder whether it’s a good time to buy or if it will keep falling? Switch your chart to 30 minutes and watch for triangles and green circles to start appearing.
You could call it momentum. Your background begins to show color when there is confluence. If it stays black, don’t buy.
Already in the trade and the screen turns black? Sell, and wait for the colors to return before buying back in

RoseTree M2 IndexM2 Money Supply Indicator with 10-Week Offset
This indicator tracks the expansion and contraction of M2 money supply with a 10-week offset, revealing strong correlation with Bitcoin price action. While other traders rely on standard 108/80 day offsets, our modified approach helps front-run market participants as this relationship has become widely recognized alpha.
Use this in combination with our systematic indicators to:
Project potential medium-term market trends
Position before major liquidity-driven moves
Identify divergences that signal potential trend changes
The indicator provides valuable insight into how expanding/contracting liquidity environments affect crypto markets, giving you a meaningful edge in anticipating broader market direction.
UM VIX30-rolling/VIX Ratio oscillatorSUMMARY
A forward-looking volatility tool that often signals VIX spikes and market reversals before they happen. MA direction flips spotlight the moment volatility pressure shifts.
DESCRIPTION
This indicator compares spot VIX to a synthetic 30-day constant-maturity volatility estimate (“VIX30”) built from VX1 and VX2 futures. The VIX30/VIX Ratio reveals short-term volatility pressure and regime shifts that traditional VX1/VX2 roll-yield alone often misses.
VIX30 is constructed using true calendar-day interpolation between VX1 and VX2, with VX1% and VX2% showing the real-time weights behind the 30-day volatility anchor. The table displays the volatility regime, the VX1/VX2 weights, spot-term roll yield (VIX30/VIX), and futures-term roll yield (VX2/VX1), giving a complete, front-of-the-curve perspective on volatility dynamics.
Use this to spot early vol expansions, collapsing contango, and regime transitions that influence VXX, UVXY, SVIX, VX options, and VIX futures.
⸻
HOW IT WORKS
The script calculates the exact calendar days to expiration for the front two VIX futures. It then applies linear interpolation to blend VX1 and VX2 into a 30-day constant-maturity synthetic volatility measure (“VIX30”). Comparing VIX30 to spot VIX produces the VIX30/VIX Ratio, which highlights short-term volatility pressure and regime direction. A full term-structure table summarizes regime, VX1%/VX2% weights, and both spot-term and futures-term roll yields.
⸻
DEFAULT SETTINGS
VX1! and VX2! are used by default for front-month and second-month futures. These may be manually overridden if TradingView rolls contracts early. The default timeframe is 30 minutes, and the VIX30/VIX Ratio uses a 21-period EMA for regime smoothing. The historical threshold is set to 1.08, reflecting the long-run average relationship between VIX30 and VIX. All settings are user-configurable.
⸻
SUGGESTED USES
• Identify early volatility expansions before they appear in VX1/VX2 roll yield.
• Confirm contango/backwardation shifts with front-of-curve context.
• Time long/short volatility trades in VXX, UVXY, SVIX, and VX options.
• Monitor regime transitions (Low → Cautionary → High) to anticipate trend inflections.
• Combine with price action, NW trends, or MA color-flip systems for higher-confidence entries.
• MA red → green flips may signal opportunities to short volatility or increase equity exposure.
• MA green → red flips may signal opportunities to go long volatility, reduce equity exposure, or even take short-equity positions.
⸻
ALERTS
Alerts trigger when the ratio crosses above or below the historical threshold or when the moving-average slope flips direction. A green flip signals rising volatility pressure; a red flip signals fading or collapsing volatility. These can be used to automate long/short volatility bias shifts or trade-entry notifications.
⸻
FURTHER HINTS
• Increasing orange/red in the table suggests an emerging higher-volatility environment.
• SVIX (inverse volatility ETF) can trend strongly when volatility decays; on a 6h chart, MA green flips often align with attractive short-volatility opportunities.
• For long-volatility trades, consider shrinking to a 30-minute chart and watching for MA green → red flips as early entry cues.
• Experiment with different timeframes and smoothing lengths to match your trading style.
• Higher VIX30/VIX and VX2/VX1 roll yields generally imply faster decay in VXX, UVXY, and UVIX — or stronger upside momentum in SVIX.

BTC STH Proxy vs Realized Price (RP) Ratio | STH : LTH📊 REALIZED PRICE MARKET SIGNAL
Indicator that builds a Short-Term Holder (STH) price proxy using a configurable moving average of Bitcoin’s market price and compares it to Bitcoin’s Realized Price (RP) derived from on-chain data.
Realized Price (RP) is calculated from CoinMetrics Realized Market Cap divided by Glassnode circulating supply.
STH Proxy is a user-defined moving average (EMA/SMA/WMA) of BTC price, designed to mimic the behavior of the true STH Realized Price.
Users can adjust the MA type, length, and RP smoothing to closely replicate the STH curve seen on Glassnode, Bitbo, and Bitcoin Magazine Pro.
Optionally, the indicator can display the STH/RP ratio, which highlights transitions between market phases.
This tool provides a simple but effective way to visualize short-term vs long-term holder cost-basis dynamics using only publicly accessible on-chain aggregates and price data.
----------
💡TLDR: An alt take on the Short-Term Holder Realized Price / Long-Term Holder Realized Price cross model | (STH/LTH cross)
- A mix of MAs are used to mimic STH.
- RP here used as a proxy for the long-term holder (LTH) cost basis.
- Bull/Bear signals are generated when the STH proxy crosses above or below RP.
⭐ Free to use • Leave feedback • Happy trading!

Self-Organized Criticality - Avalanche DistributionHere's all you need to know: This indicator applies Self-Organized Criticality (SOC) theory to financial markets, measuring the power-law exponent (alpha) of price drawdown distributions. It identifies whether markets are in stable Gaussian regimes or critical states where large cascading moves become more probable.
Self-Organized Criticality
SOC theory, introduced by Per Bak, Tang, and Wiesenfeld (1987), describes how complex systems naturally evolve toward critical (fragile) states. An example is a sand pile: adding grains creates avalanches whose sizes follow a power-law distribution rather than a normal distribution.
Financial markets exhibit similar behavior. Price movements aren't purely random walks—they display:
Fat-tailed distributions (more extreme events than Gaussian models predict)
Scale invariance (no characteristic avalanche size)
Intermittent dynamics (periods of calm punctuated by large cascades)
Power-Law Distributions
When a system is in a critical state, the probability of an avalanche of size s follows:
P(s) ∝ s^(-α)
Where:
α (alpha) is the power-law exponent
Higher α → distribution resembles Gaussian (large events rare)
Lower α → heavy tails dominate (large events common)
This indicator estimates α from the empirical distribution of price drawdowns.
Mathematical Method
1. Avalanche Detection
The indicator identifies local price peaks (highest point in a lookback window), then measures the percentage drawdown to the next trough. A dynamic ATR-based threshold filters out noise—small drops in calm markets count, but the bar rises in volatile periods.
2. Logarithmic Binning
Avalanche sizes are sorted into logarithmically-spaced bins (e.g., 1-2%, 2-4%, 4-8%) rather than linear bins. This captures power-law behavior across multiple scales - a 2% drop and 20% crash both matter. The indicator creates 12 adaptive bins spanning from your smallest to largest observed avalanche.
3. Bin-to-Bin Ratio Estimation
For each pair of adjacent bins, we calculate:
α ≈ log(N₁/N₂) / log(s₂/s₁)
Where N₁ and N₂ are avalanche counts, s₁ and s₂ are bin sizes.
Example: If 2% drops happen 4× more often than 4% drops, then α ≈ log(4)/log(2) ≈ 2.0.
We get 8-11 independent estimates and average them. This is more robust than fitting one line through all points—outliers can't dominate.
4. Rolling Window Analysis
Alpha recalculates using only recent avalanches (default: last 500 bars). Old data drops out as new avalanches occur, so the indicator tracks regime shifts in real-time.
Regime Classification
🟢 Gaussian α ≥ 2.8 Normal distribution behavior; large moves are rare outliers
🟡 Transitional 1.8 ≤ α < 2.8 Moderate fat tails; system approaching criticality
🟠 Critical 1.0 ≤ α < 1.8 Heavy tails; large avalanches increasingly common
🔴 Super-Critical α < 1.0 Extreme tail risk; system prone to cascading failures
What Alpha Tells You
Declining alpha → Market moving toward criticality; tail risk increasing
Rising alpha → Market stabilizing; returns to normal distribution
Persistent low alpha → Sustained fragility; heightened crash probability
Supporting Metrics
Heavy Tail %: Concentration of total drawdown in largest 10% of events
Populated Bins: Data coverage quality (11-12 out of 12 is ideal)
Avalanche Count: Sample size for statistical reliability
Limitations
This is a distributional measure, not a timing indicator. Low alpha indicates increased systemic risk but doesn't predict when a cascade will occur. Only that the probability distribution has shifted toward larger events.
How This Differs from the Per Bak Fragility Index
The SOC Avalanche Distribution calculates the power-law exponent (alpha) directly from price drawdown distributions - a pure mathematical analysis requiring only price data. The Per Bak Fragility Index aggregates external stress indicators (VIX, SKEW, credit spreads, put/call ratios) into a weighted composite score.
Technical Notes
Default settings optimized for daily and weekly timeframes on major indices
Requires minimum 200 bars of history for stable estimates
ATR-based dynamic sizing prevents scale-dependent bias
Alerts available for regime transitions and super-critical entry
References
Bak, P., Tang, C., & Wiesenfeld, K. (1987). Self-organized criticality: An explanation of the 1/f noise. Physical Review Letters.
Sornette, D. (2003). Why Stock Markets Crash: Critical Events in Complex Financial Systems. Princeton University Press.
