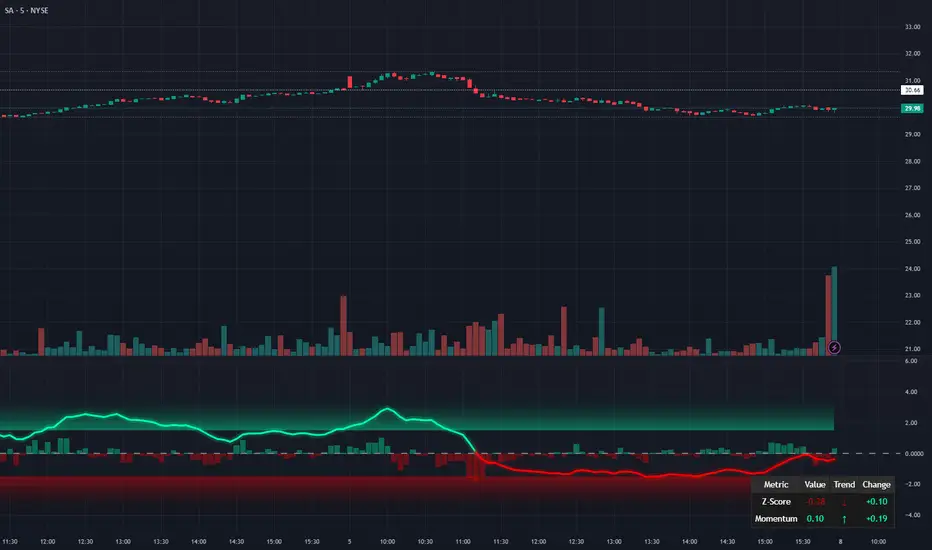
BTC - FRIC: Friction & Realized Intensity CompositeTitle: BTC - FRIC: Friction & Realized Intensity Composite
Data: IntoTheBlock
Overview & Philosophy
FRIC (Friction & Realized Intensity Composite) is a specialized on-chain oscillator designed to visualize the "psychological battlegrounds" of the Bitcoin network.
Most indicators focus on Price or Momentum. FRIC focuses on Cost Basis. It operates on the thesis that the market experiences maximum "Friction" when the price revisits the cost basis of a large number of holders. These are the zones where investors are emotionally triggered to react—either to exit "at breakeven" after a loss (creating resistance) or to defend their entry (creating support).
This indicator answers two questions simultaneously:
Intensity: Is the market hitting a Wall (High Friction) or a Vacuum (Low Friction)?
Valuation: Is this happening at a market bottom or a top?
The "Alpha" (Wall vs. Vacuum)
Why we visualize both extremes: This indicator filters out the "Noise" (the middle range) to show you only the statistically significant anomalies.
1. The "Wall" (Positive Z-Score Bars)
What it is : A statistically high number of addresses are at breakeven.
The Implication : Expect a grind. Price action often slows down or reverses here because "Bag Holders" are selling into strength to get out flat, or new buyers are establishing a floor.
2. The "Vacuum" (Negative Z-Score Bars)
What it is : A statistically low number of addresses are at breakeven.
The Implication : Expect acceleration. The price is moving through a zone where very few people have a cost basis. With no natural "breakeven supply" to block the path, price often enters Price Discovery or Free Fall.
Methodology
The indicator constructs a composite view using two premium metrics from IntoTheBlock:
1. The "Activity" (Friction Z-Score): We utilize the Breakeven Addresses Percentage. This measures the % of all addresses where the current price equals the average cost basis.
- Normalization: We apply a rolling Z-Score (Standard Deviation) to this data.
- The Filter: We hide the "Noise" (e.g., Z-Scores between -2.0 and +2.0) to isolate only the events where market structure is truly stretched.
2. The "Context" (Valuation Heatmap): We utilize the MVRV Ratio to color-code the friction.
Deep Value (< 1.0): Price is below the average "Fair Value" of the network.
Overheated (> 3.0): Price is significantly extended above the "Fair Value."
Credit: The MVRV Ratio was originally conceptualized by Murad Mahmudov and David Puell. It remains one of the gold standards for detecting Bitcoin's fair value deviations.
How to Read the Indicator
The chart is visualized as a Noise-Filtered Heatmap.
1. The Bars (Intensity)
Bars Above Zero: High Friction (Congestion). The market is fighting through a supply wall.
Bars Below Zero: Low Friction (Vacuum). The market is accelerating through thin air.
Gray/Ghosted: Noise. Routine market activity; no significant signal.
2. The Colors (Valuation Context) The color tells you why the friction is happening:
🟦 Deep Blue (The "Capitulation Buy"):
Signal: High Friction + Low MVRV.
Meaning : Investors are panic-selling at breakeven/loss, but the asset is fundamentally undervalued. Historically, these are high-conviction cycle bottoms.
🟥 Dark Red (The "FOMO Sell"):
Signal: High Friction + High MVRV.
Meaning : Investors are churning at high valuations. Smart money is often distributing to late retail arrivers. Historically marks cycle tops.
🟨 Yellow/Orange (The "Trend Battle"):
Signal: High Friction + Neutral MVRV.
Meaning : The market is contesting a level within a trend (e.g., a mid-cycle correction).
Visual Guide & Features
10-Zone Heatmap: A granular color gradient that shifts from Dark Blue (Deep Value) → Sky Blue → Grey (Neutral) → Orange → Dark Red (Top).
Noise Filter
A unique feature that "ghosts out" insignificant data, leaving only the statistically relevant signals visible.
Data Check Monitor
A diagnostic table in the bottom-right corner that confirms the live connection to IntoTheBlock data streams and displays the current regime in real-time.
Settings
Lookback Period (Default: 90): The rolling window used for the Z-Score calculation. Shortening this (e.g., to 30) makes the indicator more sensitive to local volatility; lengthening it (e.g., to 365) aligns it with macro cycles.
Noise Threshold (Default: 2.0): The strictness of the filter. Only friction events exceeding this Z-Score will be highlighted in full color.
Show Status Table : Toggles the on-screen dashboard.
Disclaimer
This script is for research and educational purposes only. It relies on third-party on-chain data which may be subject to latency or revision. Past performance of on-chain metrics does not guarantee future price action.
Tags
bitcoin, btc, on-chain, mvrv, intotheblock, friction, z-score, fundamental, valuation, cycle
Sentiment

Fractal Chaos & Kalman Trajectory [Signal]🇺🇸 English Explanation: Silence the Noise, Capture the True Trajectory.
This indicator is an advanced tool that moves beyond conventional technical analysis (RSI, MACD, etc.), merging two cutting-edge concepts from financial mathematics: the Kalman Filter and Fractal Chaos Theory (Hurst Exponent).
How It Works and Why It's Premium
1. Noise Cleaner (Kalman Trajectory)
Technology: The Kalman Filter, famously used by NASA for rocket trajectory calculations.
Benefit: It effectively silences all instantaneous, misleading price fluctuations (noise). This low-lag line plots the price's true trajectory, providing the purest trend line available by constantly self-correcting its error estimate.
2. Chaos Detector (Hurst Exponent)
Technology: Derived from Fractal Geometry and Chaos Theory, the Hurst Exponent.
Benefit: It mathematically distinguishes if the market is currently in a "Trending Mode" or a "Random Walk/Choppy Mode."
H > 0.5 (Trend): The market is orderly; past moves influence the future (Safe to Trade!).
H < 0.5 (Chaos/Random): The market is random; trading should be avoided (Preserve Capital!).
Signal Logic: AWAKE and FEAR: Detecting the Genesis of Order
This indicator does not just produce simple crossover signals; it is engineered to identify the "Genesis of Order"—the precise moment a market transitions from untradeable randomness into a reliable trend regime.
Grey Bars (The Waiting Game): When the Hurst Exponent is below the Chaos Threshold (H < 0.5), bars are colored grey. This is the crucial "Wait Mode" signal, which prevents the trader from entering during the most capital-eroding, sideways, or random markets, thus prioritizing capital preservation.
AWAKE Signal (Long Entry): This signal triggers only when two conditions are met: the market breaks out of Chaos (Hurst > 0.5) and confirms a clear upward trend direction (price above the Kalman Trajectory). This is designed to be the safest entry point for a Long position.
FEAR Signal (Short Entry): Conversely, this signal triggers when the market breaks out of Chaos (Hurst > 0.5) and confirms a clear downward trend direction (price below the Kalman Trajectory). This represents the ideal entry point for a Short position.
THIS IS NOT FINANCIAL ADVICE.
Recommended settings:
Gain: 0.1
Chaos Threshold: 0.65

Smart Risk Meter (Adaptive v2)How it works
The Smart Risk Meter reads momentum, distance from the long-term trend, and drawdown pressure, then adapts those signals to the asset’s volatility. Low-vol assets get tighter scaling, high-vol assets get wider scaling, so the 0–1 risk score stays meaningful on anything from SPX to BTC.
How to use it
• 0.0–0.4: Accumulation zone. Market is calm or recovering — ideal for building positions.
• 0.4–0.6: Neutral. Trend can go either way — manage sizing.
• 0.6–0.8: Elevated risk. Momentum is stretched — tighten stops or reduce exposure.
• 0.8–1.0: Overheated. High risk of sharp pullbacks — avoid chasing.
Use it as a bias filter, a DCA timing tool, or a simple risk-on/risk-off read. It won’t predict tops or bottoms, but it keeps you aligned with the market’s temperature.

Gyspy Bot Trade Engine - V1.2B - Alerts - 12-7-25 - SignalLynxGypsy Bot Trade Engine (MK6 V1.2B) - Alerts & Visualization
Brought to you by Signal Lynx | Automation for the Night-Shift Nation 🌙
1. Executive Summary & Architecture
Gypsy Bot (MK6 V1.2B) is not merely a strategy; it is a massive, modular Trade Engine built specifically for the TradingView Pine Script V6 environment. While most tools rely on a single dominant indicator to generate signals, Gypsy Bot functions as a sophisticated Consensus Algorithm.
Note: This is the Indicator / Alerts version of the engine. It is designed for visual analysis and generating live alert signals for automation. If you wish to see Backtest data (Equity Curves, Drawdown, Profit Factors), please use the Strategy version of this script.
The engine calculates data from up to 12 distinct Technical Analysis Modules simultaneously on every bar closing. It aggregates these signals into a "Vote Count" and only fires a signal plot when a user-defined threshold of concurring signals is met. This "Voting System" acts as a noise filter, requiring multiple independent mathematical models—ranging from volume flow and momentum to cyclical harmonics and trend strength—to agree on market direction.
Beyond entries, Gypsy Bot features a proprietary Risk Management suite called the Dump Protection Team (DPT). This logic layer operates independently of the entry modules, specifically scanning for "Moon" (Parabolic) or "Nuke" (Crash) volatility events to signal forced exits, preserving capital during Black Swan events.
2. ⚠️ The Philosophy of "Curve Fitting" (Must Read)
One must be careful when applying Gypsy Bot to new pairs or charts.
To be fully transparent: Gypsy Bot is, by definition, a very advanced curve-fitting engine. Because it grants the user granular control over 12 modules, dozens of thresholds, and specific voting requirements, it is extremely easy to "over-fit" the data. You can easily toggle switches until the charts look perfect in hindsight, only to have the signals fail in live markets because they were tuned to historical noise rather than market structure.
To use this engine successfully:
Visual Verification: Do not just look for "green arrows." Look for signals that occur at logical market structure points.
Stability: Ensure signals are not flickering. This script uses closed-candle logic for key decisions to ensure that once a signal plots, it remains painted.
Regular Maintenance is Mandatory: Markets shift regimes (e.g., from Bull Trend to Crab Range). Gypsy Bot settings should be reviewed and adjusted at regular intervals to ensure the voting logic remains aligned with current market volatility.
Timeframe Recommendations:
Gypsy Bot is optimized for High Time Frame (HTF) trend following. It generally produces the most reliable results on charts ranging from 1-Hour to 12-Hours, with the 4-Hour timeframe historically serving as the "sweet spot" for most major cryptocurrency assets.
3. The Voting Mechanism: How Entries Are Generated
The heart of the Gypsy Bot engine is the ActivateOrders input (found in the "Order Signal Modifier" settings).
The engine constantly monitors the output of all enabled Modules.
Long Votes: GoLongCount
Short Votes: GoShortCount
If you have 10 Modules enabled, and you set ActivateOrders to 7:
The engine will ONLY plot a Buy Signal if 7 or more modules return a valid "Buy" signal on the same closed candle.
If only 6 modules agree, the signal is rejected.
4. Technical Deep Dive: The 12 Modules
Gypsy Bot allows you to toggle the following modules On/Off individually to suit the asset you are trading.
Module 1: Modified Slope Angle (MSA)
Logic: Calculates the geometric angle of a moving average relative to the timeline.
Function: Filters out "lazy" trends. A trend is only considered valid if the slope exceeds a specific steepness threshold.
Module 2: Correlation Trend Indicator (CTI)
Logic: Measures how closely the current price action correlates to a straight line (a perfect trend).
Function: Ensures that we are moving up with high statistical correlation, reducing fake-outs.
Module 3: Ehlers Roofing Filter
Logic: A spectral filter combining High-Pass (trend removal) and Super Smoother (noise removal).
Function: Isolates the "Roof" of price action to catch cyclical turning points before standard moving averages.
Module 4: Forecast Oscillator
Logic: Uses Linear Regression forecasting to predict where price "should" be relative to where it is.
Function: Signals when the regression trend flips. Offers "Aggressive" and "Conservative" calculation modes.
Module 5: Chandelier ATR Stop
Logic: A volatility-based trend follower that hangs a "leash" (ATR multiple) from extremes.
Function: Used as an entry filter. If price is above the Chandelier line, the trend is Bullish.
Module 6: Crypto Market Breadth (CMB)
Logic: Pulls data from multiple major tickers (BTC, ETH, and Perpetual Contracts).
Function: Calculates "Market Health." If Bitcoin is rising but the rest of the market is dumping, this module can veto a trade.
Module 7: Directional Index Convergence (DIC)
Logic: Analyzes the convergence/divergence between Fast and Slow Directional Movement indices.
Function: Identifies when trend strength is expanding.
Module 8: Market Thrust Indicator (MTI)
Logic: A volume-weighted breadth indicator using Advance/Decline and Volume data.
Function: One of the most powerful modules. Confirms that price movement is supported by actual volume flow. Recommended setting: "SSMA" (Super Smoother).
Module 9: Simple Ichimoku Cloud
Logic: Traditional Japanese trend analysis.
Function: Checks for a "Kumo Breakout." Price must be fully above/below the Cloud to confirm entry.
Module 10: Simple Harmonic Oscillator
Logic: Analyzes harmonic wave properties to detect cyclical tops and bottoms.
Function: Serves as a counter-trend or early-reversal detector.
Module 11: HSRS Compression / Super AO
Logic: Detects volatility compression (HSRS) or Momentum/Trend confluence (Super AO).
Function: Great for catching explosive moves resulting from consolidation.
Module 12: Fisher Transform (MTF)
Logic: Converts price data into a Gaussian normal distribution.
Function: Identifies extreme price deviations. Uses Multi-Timeframe (MTF) logic to ensure you aren't trading against the major trend.
5. Global Inhibitors (The Veto Power)
Even if 12 out of 12 modules vote "Buy," Gypsy Bot performs a final safety check using Global Inhibitors.
Bitcoin Halving Logic: Prevents trading during chaotic weeks surrounding Halving events (dates projected through 2040).
Miner Capitulation: Uses Hash Rate Ribbons to identify bearish regimes when miners are shutting down.
ADX Filter: Prevents trading in "Flat/Choppy" markets (Low ADX).
CryptoCap Trend: Checks the total Crypto Market Cap chart for broad market alignment.
6. Risk Management & The Dump Protection Team (DPT)
Even in this Indicator version, the RM logic runs to generate Exit Signals.
Dump Protection Team (DPT): Detects "Nuke" (Crash) or "Moon" (Pump) volatility signatures. If triggered, it plots an immediate Exit Signal (Yellow Plot).
Advanced Adaptive Trailing Stop (AATS): Dynamically tightens stops in low volatility ("Dungeon") and loosens them in high volatility ("Penthouse").
Staged Take Profits: Plots TP1, TP2, and TP3 events on the chart for visual confirmation or partial exit alerts.
7. Recommended Setup Guide
When applying Gypsy Bot to a new chart, follow this sequence:
Set Timeframe: 4 Hours (4H).
Tune DPT: Adjust "Dump/Moon Protection" inputs first. These filter out bad signals during high volatility.
Tune Module 8 (MTI): Experiment with the MA Type (SSMA is recommended).
Select Modules: Enable/Disable modules based on the asset's personality (Trending vs. Ranging).
Voting Threshold: Adjust ActivateOrders to filter out noise.
Alert Setup: Once visually satisfied, use the "Any Alert Function Call" option when creating an alert in TradingView to capture all Buy/Sell/Close events generated by the engine.
8. Technical Specs
Engine Version: Pine Script V6
Repainting: This indicator uses Closed Candle data for all Risk Management and Entry decisions. This ensures that signals do not vanish after the candle closes.
Visuals:
Blue Plot: Buy/Sell Signal.
Yellow Plot: Risk Management (RM) / DPT Close Signal.
Green/Lime/Olive Plots: Take Profit hits.
Disclaimer:
This script is a complex algorithmic tool for market analysis. Past performance is not indicative of future results. Cryptocurrency trading involves substantial risk of loss. Use this tool to assist your own decision-making, not to replace it.
9. About Signal Lynx
Automation for the Night-Shift Nation 🌙
Signal Lynx focuses on helping traders and developers bridge the gap between indicator logic and real-world automation. The same RM engine you see here powers multiple internal systems and templates, including other public scripts like the Super-AO Strategy with Advanced Risk Management.
We provide this code open source under the Mozilla Public License 2.0 (MPL-2.0) to:
Demonstrate how Adaptive Logic and structured Risk Management can outperform static, one-layer indicators
Give Pine Script users a battle-tested RM backbone they can reuse, remix, and extend
If you are looking to automate your TradingView strategies, route signals to exchanges, or simply want safer, smarter strategy structures, please keep Signal Lynx in your search.
License: Mozilla Public License 2.0 (Open Source).
If you make beneficial modifications, please consider releasing them back to the community so everyone can benefit.

Gyspy Bot Trade Engine - V1.2B - Strategy 12-7-25 - SignalLynxGypsy Bot Trade Engine (MK6 V1.2B) - Ultimate Strategy & Backtest
Brought to you by Signal Lynx | Automation for the Night-Shift Nation 🌙
1. Executive Summary & Architecture
Gypsy Bot (MK6 V1.2B) is not merely a strategy; it is a massive, modular Trade Engine built specifically for the TradingView Pine Script environment. While most strategies rely on a single dominant indicator (like an RSI cross or a MACD flip) to generate signals, Gypsy Bot functions as a sophisticated Consensus Algorithm.
The engine calculates data from up to 12 distinct Technical Analysis Modules simultaneously on every bar closing. It aggregates these signals into a "Vote Count" and only executes a trade entry when a user-defined threshold of concurring signals is met. This "Voting System" acts as a noise filter, requiring multiple independent mathematical models—ranging from volume flow and momentum to cyclical harmonics and trend strength—to agree on market direction before capital is committed.
Beyond entries, Gypsy Bot features a proprietary Risk Management suite called the Dump Protection Team (DPT). This logic layer operates independently of the entry modules, specifically scanning for "Moon" (Parabolic) or "Nuke" (Crash) volatility events to force-exit positions, overriding standard stops to preserve capital during Black Swan events.
2. ⚠️ The Philosophy of "Curve Fitting" (Must Read)
One must be careful when applying Gypsy Bot to new pairs or charts.
To be fully transparent: Gypsy Bot is, by definition, a very advanced curve-fitting engine. Because it grants the user granular control over 12 modules, dozens of thresholds, and specific voting requirements, it is extremely easy to "over-fit" the data. You can easily toggle switches until the backtest shows a 100% win rate, only to have the strategy fail immediately in live markets because it was tuned to historical noise rather than market structure.
To use this engine successfully, you must adopt a specific optimization mindset:
Ignore Raw Net Profit: Do not tune for the highest dollar amount. A strategy that makes $1M in the backtest but has a 40% drawdown is useless.
Prioritize Stability: Look for a high Profit Factor (1.5+), a high Percent Profitable, and a smooth equity curve.
Regular Maintenance is Mandatory: Markets shift regimes (e.g., from Bull Trend to Crab Range). Parameters that worked perfectly in 2021 may fail in 2024. Gypsy Bot settings should be reviewed and adjusted at regular intervals (e.g., quarterly) to ensure the voting logic remains aligned with current market volatility.
Timeframe Recommendations:
Gypsy Bot is optimized for High Time Frame (HTF) trend following. It generally produces the most reliable results on charts ranging from 1-Hour to 12-Hours, with the 4-Hour timeframe historically serving as the "sweet spot" for most major cryptocurrency assets.
3. The Voting Mechanism: How Entries Are Generated
The heart of the Gypsy Bot engine is the ActivateOrders input (found in the "Order Signal Modifier" settings).
The engine constantly monitors the output of all enabled Modules.
Long Votes: GoLongCount
Short Votes: GoShortCount
If you have 10 Modules enabled, and you set ActivateOrders to 7:
The engine will ONLY trigger a Buy Entry if 7 or more modules return a valid "Buy" signal on the same closed candle.
If only 6 modules agree, the trade is rejected.
This allows you to mix "Leading" indicators (Oscillators) with "Lagging" indicators (Moving Averages) to create a high-probability entry signal that requires momentum, volume, and trend to all be in alignment.
4. Technical Deep Dive: The 12 Modules
Gypsy Bot allows you to toggle the following modules On/Off individually to suit the asset you are trading.
Module 1: Modified Slope Angle (MSA)
Logic: Calculates the geometric angle of a moving average relative to the timeline.
Function: It filters out "lazy" trends. A trend is only considered valid if the slope exceeds a specific steepness threshold. This helps avoid entering trades during weak drifts that often precede a reversal.
Module 2: Correlation Trend Indicator (CTI)
Logic: Based on John Ehlers' work, this measures how closely the current price action correlates to a straight line (a perfect trend).
Function: It outputs a confidence score (-1 to 1). Gypsy Bot uses this to ensure that we are not just moving up, but moving up with high statistical correlation, reducing fake-outs.
Module 3: Ehlers Roofing Filter
Logic: A sophisticated spectral filter that combines a High-Pass filter (to remove long-term drift) with a Super Smoother (to remove high-frequency noise).
Function: It attempts to isolate the "Roof" of the price action. It is excellent at catching cyclical turning points before standard moving averages react.
Module 4: Forecast Oscillator
Logic: Uses Linear Regression forecasting to predict where price "should" be relative to where it is.
Function: When the Forecast Oscillator crosses its zero line, it indicates that the regression trend has flipped. We offer both "Aggressive" and "Conservative" calculation modes for this module.
Module 5: Chandelier ATR Stop
Logic: A volatility-based trend follower that hangs a "leash" (ATR multiple) from the highest high (for longs) or lowest low (for shorts).
Function: Used here as an entry filter. If price is above the Chandelier line, the trend is Bullish. It also includes a "Bull/Bear Qualifier" check to ensure structural support.
Module 6: Crypto Market Breadth (CMB)
Logic: This is a macro-filter. It pulls data from multiple major tickers (BTC, ETH, and Perpetual Contracts) across different exchanges.
Function: It calculates a "Market Health" percentage. If Bitcoin is rising but the rest of the market is dumping, this module can veto a trade, ensuring you don't buy into a "fake" rally driven by a single asset.
Module 7: Directional Index Convergence (DIC)
Logic: Analyzes the convergence/divergence between Fast and Slow Directional Movement indices.
Function: Identifies when trend strength is expanding. A buy signal is generated only when the positive directional movement overpowers the negative movement with expanding momentum.
Module 8: Market Thrust Indicator (MTI)
Logic: A volume-weighted breadth indicator. It uses Advance/Decline data and Up/Down Volume data.
Function: This is one of the most powerful modules. It confirms that price movement is supported by actual volume flow. We recommend using the "SSMA" (Super Smoother) MA Type for the cleanest signals on the 4H chart.
Module 9: Simple Ichimoku Cloud
Logic: Traditional Japanese trend analysis using the Tenkan-sen and Kijun-sen.
Function: Checks for a "Kumo Breakout." Price must be fully above the Cloud (for longs) or below it (for shorts). This is a classic "trend confirmation" module.
Module 10: Simple Harmonic Oscillator
Logic: Analyzes the harmonic wave properties of price action to detect cyclical tops and bottoms.
Function: Serves as a counter-trend or early-reversal detector. It tries to identify when a cycle has bottomed out (for buys) or topped out (for sells) before the main trend indicators catch up.
Module 11: HSRS Compression / Super AO
Logic: Two options in one.
HSRS: Hirashima Sugita Resistance Support. Detects volatility compression (squeezes) relative to dynamic support/resistance bands.
Super AO: A combination of the Awesome Oscillator and SuperTrend logic.
Function: Great for catching explosive moves that result from periods of low volatility (consolidation).
Module 12: Fisher Transform (MTF)
Logic: Converts price data into a Gaussian normal distribution.
Function: Identifies extreme price deviations. This module uses Multi-Timeframe (MTF) logic to look at higher-timeframe trends (e.g., looking at the Daily Fisher while trading the 4H chart) to ensure you aren't trading against the major trend.
5. Global Inhibitors (The Veto Power)
Even if 12 out of 12 modules vote "Buy," Gypsy Bot performs a final safety check using Global Inhibitors. If any of these are triggered, the trade is blocked.
Bitcoin Halving Logic:
Hardcoded dates for past and projected future Bitcoin halvings (up to 2040).
Trading is inhibited or restricted during the chaotic weeks immediately surrounding a Halving event to avoid volatility crushes.
Miner Capitulation:
Uses Hash Rate Ribbons (Moving averages of Hash Rate).
If miners are capitulating (Shutting down rigs due to unprofitability), the engine flags a "Bearish" regime and can flip logic to Short-only or flat.
ADX Filter (Flat Market Protocol):
If the Average Directional Index (ADX) is below a specific threshold (e.g., 20), the market is deemed "Flat/Choppy." The bot will refuse to open trend-following trades in a flat market.
CryptoCap Trend:
Checks the total Crypto Market Cap chart. If the broad market is in a downtrend, it can inhibit Long entries on individual altcoins.
6. Risk Management & The Dump Protection Team (DPT)
Gypsy Bot separates "Entry Logic" from "Risk Management Logic."
Dump Protection Team (DPT)
This is a specialized logic branch designed to save the account during Black Swan events.
Nuke Protection: If the DPT detects a volatility signature consistent with a flash crash, it overrides all other logic and forces an immediate exit.
Moon Protection: If a parabolic pump is detected that violates statistical probability (Bollinger deviations), DPT can force a profit take before the inevitable correction.
Advanced Adaptive Trailing Stop (AATS)
Unlike a static trailing stop (e.g., "trail by 5%"), AATS is dynamic.
Penthouse Level: If price is at the top of the HSRS channel (High Volatility), the stop loosens to allow for wicks.
Dungeon Level: If price is compressed at the bottom, the stop tightens to protect capital.
Staged Take Profits
TP1: Scalp a portion (e.g., 10%) to cover fees and secure a win.
TP2: Take the bulk of profit.
TP3: Leave a "Runner" position with a loose trailing stop to catch "Moon" moves.
7. Recommended Setup Guide
When applying Gypsy Bot to a new chart, follow this sequence:
Set Timeframe: 4 Hours (4H).
Reset: Turn OFF Trailing Stop, Stop Loss, and Take Profits. (We want to see raw entry performance first).
Tune DPT: Adjust "Dump/Moon Protection" inputs first. These have the highest impact on net performance.
Tune Module 8 (MTI): This module is a heavy filter. Experiment with the MA Type (SSMA is recommended).
Select Modules: Enable/Disable modules 1-12 based on the asset's personality (Trending vs. Ranging).
Voting Threshold: Adjust ActivateOrders. A lower number = More Trades (Aggressive). A higher number = Fewer, higher conviction trades (Conservative).
Final Polish: Re-enable Stop Losses, Trailing Stops, and Staged Take Profits to smooth the equity curve and define your max risk per trade.
8. Technical Specs
Engine Version: Pine Script V6
Repainting: This strategy uses Closed Candle data for all Risk Management and Entry decisions. This ensures that Backtest results align closely with real-time behavior (no repainting of historical signals).
Alerts: This script generates Strategy alerts. If you require visual-only alerts, see the source code header for instructions on switching to "Study" (Indicator) mode.
Disclaimer:
This script is a complex algorithmic tool for market analysis. Past performance is not indicative of future results. Use this tool to assist your own decision-making, not to replace it.
9. About Signal Lynx
Automation for the Night-Shift Nation 🌙
Signal Lynx focuses on helping traders and developers bridge the gap between indicator logic and real-world automation. The same RM engine you see here powers multiple internal systems and templates, including other public scripts like the Super-AO Strategy with Advanced Risk Management.
We provide this code open source under the Mozilla Public License 2.0 (MPL-2.0) to:
Demonstrate how Adaptive Logic and structured Risk Management can outperform static, one-layer indicators
Give Pine Script users a battle-tested RM backbone they can reuse, remix, and extend
If you are looking to automate your TradingView strategies, route signals to exchanges, or simply want safer, smarter strategy structures, please keep Signal Lynx in your search.
License: Mozilla Public License 2.0 (Open Source).
If you make beneficial modifications, please consider releasing them back to the community so everyone can benefit.

ART MACRO PEEK 2025-Info v2 With this indicator you will be able to understand what the (vix, btc, triple aaa, dxy) looks like before entering market in one glance, it will act more like market thermometer.

Green Day or Red Day?What it is:
This simple indicator provides immediate visual context by tinting the background of your chart Green or Red based on the asset's daily performance.
Who's it for?
It is designed for day traders and scalpers who operate on lower timeframes (1m, 5m, 15m) but need to remain aware of the overall daily direction without switching charts. It can be used in combination with the ORB strategy as a helpful tool to "feel" the trend when you're way out of the ORB range. But this indicator can be used by anyone regardless of trading style.
How it works:
This script pulls data from the daily timeframe regardless of the chart interval you are currently viewing. It compares the current price to a user-selectable reference point (either Yesterday's Close or Today's Open) to determine the background color.
Good Luck. May you make good trades!

Damians UJ Strategy20 Pip Candle Strategy (No Engulfing)
Trades taken at 6pm direcrtly after candle close
Inputs allow you to reorganize retracement pips, SL, TP, 5PM candle amount.

Fed Net Liquidity [Premium] [by Golman Armi]This indicator visualizes the USD Net Liquidity injected into the financial system by the Federal Reserve.
It is a fundamental macro-economic tool essential for understanding the underlying "fuel" driving risk assets such as the S&P 500 (SPX), Nasdaq (NDX), and Bitcoin (BTC).
Unlike many other liquidity scripts that incorrectly use Commercial Bank Assets (USCBBS), this script uses the Federal Reserve Total Assets (WALCL) to provide a mathematically accurate representation of Central Bank liquidity.
How It Works (The Formula)
Net Liquidity represents the actual cash available to the banking system for investment after government liabilities are subtracted. The formula used is:
NetLiquidity=WALCL−TGA−RRP
Where:
WALCL (Fed Balance Sheet): The total assets held by the Federal Reserve (The source of money printing).
TGA (Treasury General Account - WTREGEN): The checking account of the US Government. When the TGA goes up, money is removed from the economy; when it goes down, money is spent into the economy.
RRP (Reverse Repo - RRPONTTLD): Cash parked by banks and money market funds at the Fed overnight. A rise in RRP removes liquidity from the markets.
Features
Accurate Data Sourcing: Pulls daily data directly from FRED (Federal Reserve Economic Data).
Unit Correction: Automatically adjusts conflicting units (Millions vs Billions) from TradingView data feeds to output a correct value in Trillions of Dollars.
Trend Cloud: Features a smoothing EMA (Exponential Moving Average) with a color-coded cloud to easily identify the macro trend (Green for expansion, Red for contraction).
How to Use
Trend Correlation:
Rising Line (Green): Liquidity is expanding. Historically, this supports bullish trends in stocks and crypto.
Falling Line (Red): Liquidity is being drained (QT or TGA refill). This often leads to volatility or bearish trends in risk assets.
Divergences (The most powerful signal):
If the S&P 500 or Bitcoin makes a New High, but Net Liquidity makes a Lower High, it indicates a "hollow rally" lacking fundamental support, often preceding a correction.
Disclaimer
This tool is for educational purposes and macro-economic analysis only. It is not financial advice.

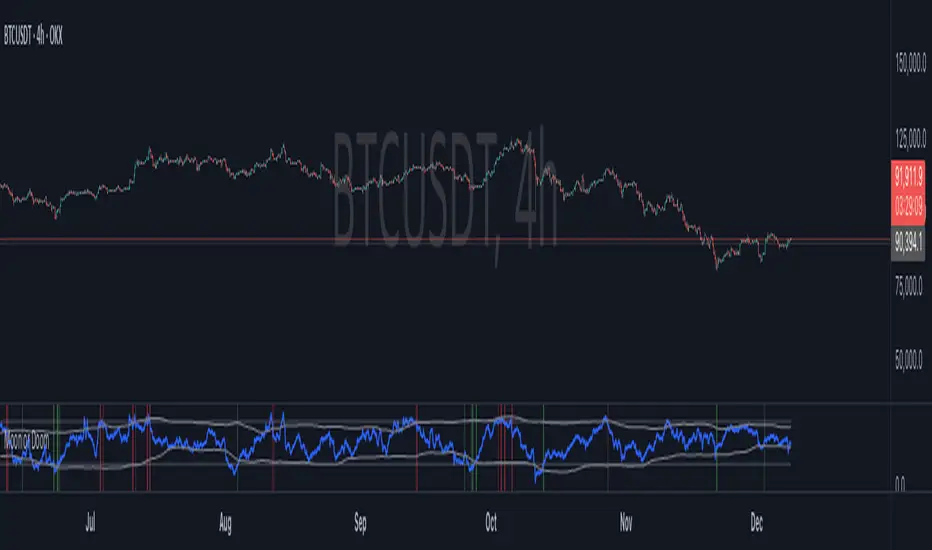
Moon or Doom — Crypto Market Sentiment IndexMoon or Doom — Crypto Market Sentiment Index
(Inspired by the classic Crypto Fear & Greed Index)
⚪ Overview
Moon or Doom indicator identifies crypto market sentiment using six normalized components: RSI, ATR volatility, price deviation, BTC dominance, open interest, and funding-rate behavior.
Each factor is standardized, weighted, and blended into a unified 0–100 score that reflects overall fear, equilibrium, or greed.
The indicator includes adjustable weights, static/dynamic thresholds, and potential reversal spot signaling with ADX filtering for higher-quality signals.
⚪ Score Components
RSI (Momentum) — default 20%
Short-term momentum input based on 14-period RSI, scaled to a 0–100 range.
ATR Volatility Z-Score (Volatility Stress) — default 15%
ATR is standardized over a 90-period Z-score to detect abnormally high volatility associated with emotional market phases.
Price vs MA Z-Score (Mean Deviation) — default 20%
Measures mean deviation from the 50-period SMA and identifies extended overbought or oversold regions.
BTC Dominance Z-Score (Risk Rotation) — default 10%
Reflects macro risk-on vs risk-off behavior through normalized BTC dominance shifts.
Open Interest Z-Score (Leverage Load) — default 20%
Reveals leverage pressure and speculative extremes by comparing OI relative to its historical volatility.
Funding Rate Normalization (Positioning Bias) — default 15%
TWAP-based normalized funding metric capturing derivative positioning bias.
⚪ Extreme Condition Detection
Static Levels
• Extreme Fear: 25
• Extreme Greed: 75
Dynamic Levels
Adaptive bands using Z-score of the sentiment series for regime-aware thresholds.
Hybrid Mode
Reversal zones activate when either static or dynamic levels are breached.
⚪ Signal Conditions
Bullish Signal
Triggered when the sentiment score exits extreme-fear territory or crosses above the ultra-low band (20).
Bearish Signal
Triggered when the score exits extreme-greed territory or crosses below an ultra-high band (80).
ADX Filter
Applied to avoid signals during low-strength market conditions.
⚪ Use Cases
• Identify fear → greed cycles
• Spot early reversal environments
• Market-wide regime detection across all timeframes
⚪ Alerts
The indicator provides three built-in alerts:
MD Bullish Spot
Triggered when the sentiment score exits an extreme fear zone or passes above an ultra-low band.
MD Bearish Spot
Triggered when the score exits extreme greed or passes below an ultra-high band.
MD Bullish/Bearish Spot
Fires for either direction — useful for automation or unified scripts.
⚪ Disclaimer
This script is for educational and informational purposes only and does not constitute financial advice or investment recommendations. Trading cryptocurrencies involves significant risk and you are solely responsible for your own investment decisions, based on your financial situation, objectives, and risk tolerance. The author assumes no liability for losses arising from the use of this indicator.
MSTR mNAV indicatorTrack and compute MicroStrategy's mNAV (EV divided by BTC reserve value) over time.
- compute method: www.strategy.com
- data source: www.strategy.com

Global Market Scanner [Armi Goldman]Concept
This indicator is designed to provide a comprehensive "Bird's Eye View" of the global financial economy. Instead of focusing on a single chart, this dashboard allows traders to monitor capital rotation across every major asset class simultaneously. By tracking the Money Flux (daily percentage change) of these markets, users can instantly identify if the market environment is "Risk-On" (flowing into assets) or "Risk-Off" (fleeing to cash/bonds).
Features
The dashboard displays a real-time table in the top-right corner tracking 9 key sectors:
US M2 Money Supply: The broad measure of liquidity availability.
US Dollar (DXY): The global currency baseline.
Global Stocks (VT): World equities performance.
Crypto Market: Total cryptocurrency market capitalization.
Commodities: Gold, Silver, and Crude Oil (WTI).
Real Estate: Vanguard Real Estate ETF (VNQ).
Bonds: US Aggregate Bond Market.
How it Works
The script utilizes request.security() to fetch data from multiple asset classes regardless of the chart you are currently viewing.
Flux Calculation: The "Flux" column calculates the daily percentage change (Close - Open) / Open. This reveals the immediate direction of capital flow for the current session.
M2 Trend: For the Money Supply, the script calculates a 30-day rate of change to determine if the Fed is effectively "Inflating" (adding liquidity) or "Tightening" (removing liquidity).
Status Logic: The status column uses conditional logic to assign readable labels (e.g., "INFLOW" vs "OUTFLOW" or "STRONGER" vs "WEAKER") based on the positive or negative value of the Flux.
How to Use
Risk-On Signal: If Stocks, Crypto, and Real Estate show green "INFLOW" status while the Dollar (DXY) is red, capital is deploying into risk assets.
Flight to Safety: If Gold and Bonds are green while Equities are red, investors may be hedging against fear.
Cash is King: If DXY is strong (Green) and almost all other assets are red, liquidity is drying up and moving into Cash.
Liquidity Watch: Monitor the US M2 Supply. A simplified view is that when M2 is "Inflating," it provides a long-term tailwind for asset prices.
Tickers Used
Liquidity: ECONOMICS:USM2
Currency: TVC:DXY
Equities: AMEX:VT (Total World Stock ETF)
Real Estate: AMEX:VNQ (Vanguard Real Estate)
Bonds: AMEX:AGG
Commodities: TVC:GOLD, TVC:SILVER, TVC:USOIL
Crypto: CRYPTOCAP:TOTAL
Disclaimer This tool is for informational purposes only and does not constitute financial advice.

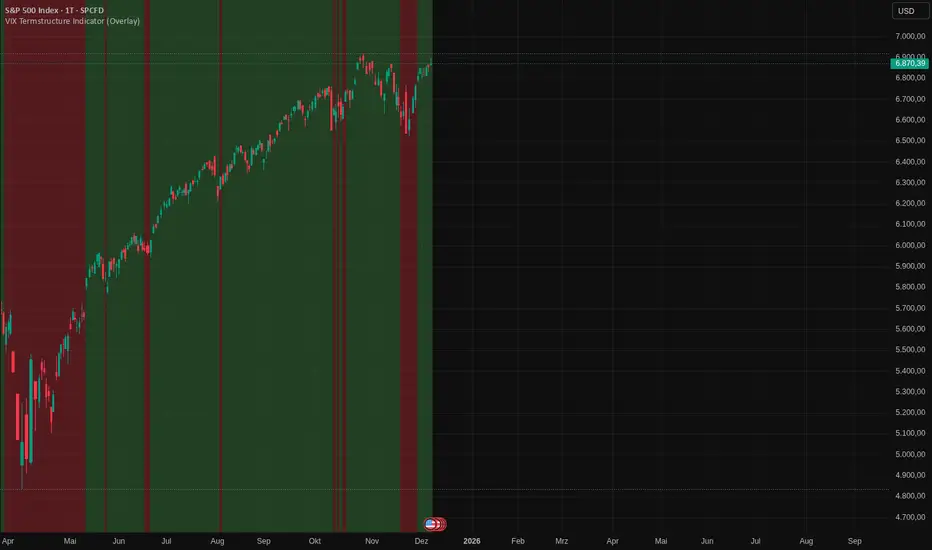
VIX Termstructure Indicator (Overlay)This indicator visualizes the VIX futures term structure directly on your chart background and highlights three key volatility regimes using color coding. It helps identify when the volatility curve is in normal contango, inverted (backwardation), or undergoing a curve flip between the front-month VIX futures.
What the indicator does
The script pulls and compares:
VIX spot index: VIX
Front-month VIX futures: VX1!
Second-month VIX futures: VX2!
All data is requested on the daily timeframe and used to classify the current volatility environment. The indicator then colors the background of your chart according to the detected VIX term structure:
Green background – Contango:
VIX spot is below the front-month futures (VIX < VX1!).
This is typically associated with more “normal” market conditions and lower perceived short-term stress.
Red background – Inverted curve (Backwardation):
VIX spot is above the front-month futures (VIX > VX1!).
This often signals elevated fear, stress, or risk-off conditions in the market.
Yellow background – Curve flip between VX1! and VX2!:
The front-month futures are trading above the second-month futures (VX1! > VX2!).
This can indicate a transition phase in the volatility term structure and may precede or accompany shifts in market sentiment.
How it works
The script fetches the daily close values of VIX, VX1!, and VX2!. It checks whether the front-month futures are above the second-month futures to detect a curve flip. It compares VIX with VX1! to determine if the curve is contango or inverted. Based on these conditions, the chart background is colored with a semi-transparent overlay:
Red has priority when VIX is above VX1! (inverted curve).
If not inverted, yellow is shown when a curve flip VX1! > VX2! is detected.
Otherwise, the background is green (normal contango).
Use cases
This overlay is designed as a context tool for indices, ETFs, Options, or individual stocks that are sensitive to volatility and risk sentiment. Typical applications include:
Identifying periods of heightened risk (red / inverted curve) to adjust position sizing or risk exposure.
Confirming risk-on environments (green / contango) where volatility is more contained.
Monitoring yellow curve-flip phases as potential early warnings of changing volatility regimes.
The indicator does not generate buy/sell signals on its own, but it can be a valuable regime filter or confirmation layer alongside other technical tools.
Notes
This is an overlay indicator: it colors the background of your active chart.
All VIX-related data is evaluated on the daily timeframe, regardless of the chart timeframe.
Make sure that the symbols VIX, VX1!, and VX2! are available on your broker/data feed in TradingView.
52 Week High LowPurpose
This indicator plots the rolling **52-week high and low price levels** to highlight long-term breakout zones, major support/resistance bands, and trend structure used by position and swing traders.
## How It Works
The script dynamically calculates:
- The highest high over the last ~260 trading sessions (52-week high)
- The lowest low over the last ~260 trading sessions (52-week low)
- Visual bands that update in real time as price evolves
## Best Timeframe
Optimized for **daily charts** to reflect true yearly price ranges.
Can be adapted to other timeframes using the bar-count inputs.
## Trading Applications
✅ Breakout confirmation tool
✅ Long-term trend validation
✅ Relative strength filter alignment
✅ RRG and momentum cross-checks
✅ Swing trade zone identification
## How To Use
1. Apply to daily charts.
2. Track price interaction with the 52-week bands.
3. Look for:
- Breakouts above the high band for trend continuation
- Pullbacks toward the high band for retest entries
- Rejections at the low band as breakdown confirmation
⚠️ This indicator maps key price structure — it does **not predict directional outcomes**.
Always combine with volume or momentum confirmation.
---
## Mathematical Basis
Rolling extreme calculations based on:
- **Highest high over N bars**
- **Lowest low over N bars**
N defaults to **52 weeks × 5 sessions = 260 bars** for daily charts.
---
Developed for professional retail traders seeking institutional-grade structural tools.

MTF Dashboard Pro v2.3 © 2025 - Sachin ThakareMTF Dashboard Pro v2.3 — A premium multi-timeframe market dashboard created for professional traders.
Features include:
• MTF EMA Trend (9/21)
• MTF 200 MA System with Threshold Logic
• Session-based VWAP (Daily Reset)
• SuperTrend (Corrected Direction Engine)
• RSI / MACD / ADX / Alligator
• Stochastic (Correct Pine Signature)
• Daily PDH / PDL Bias
• 11-Signal Institutional Bias Score
• Trend Strength Classification (Strong Bull → Strong Bear)
• Multi-TF Alerts for Strong Bull / Strong Bear
• Optimized Table Engine & Enhanced Performance
Designed for Scalping, intraday, swing, and high-precision market bias evaluation across 3m → 1M timeframes.
Built & optimized by Sachin Thakare (2025 Edition).

RiskCraft - Advanced Risk Management SystemRiskCraft – Risk Intelligence Dashboard
Trade like you actually respect risk
"I know the setup looks good… but how much am I actually risking right now?"
RiskCraft is an open-source Pine Script v6 indicator that keeps risk transparent directly on the chart. It is not a signal generator; it is a risk desk that calculates size, frames volatility, and reminds you when your behaviour drifts away from the plan.
Core utilities
Calculates professional-style position sizing in real time.
Reads volatility and market regime before position size is confirmed.
Adjusts risk based on the trader’s emotional state and confidence inputs.
Maps session risk across Asian, London, and New York hours.
Draws exactly one stop line and one target line in the preferred direction.
Provides rotating education tips plus contextual warnings when risk escalates.
It is intentionally conservative and keeps you in the game long enough for any separate entry logic to matter.
---
Chart layout checklist
Use a clean chart on a liquid symbol (e.g., AMEX:SPY or major FX pairs).
Main RiskCraft dashboard placed on the right edge.
Session Risk box on the left with UTC time visible.
Floating risk badge above price.
Stop/target guide lines enabled.
Education panel visible in the bottom-right corner.
---
1. On-chart components
Right-side dashboard : account risk %, position size/value, stop, target, risk/reward, regime, trend strength, emotional state, behavioural score, correlation, and preferred trade direction.
Session Risk box : highlights active session (Asian, London, NY), current UTC time, and risk label (High/Med/Low) per session.
Floating risk badge : keeps actual account risk percent visible with colour-coded wording from Ultra Cautious to Very Aggressive.
Stop/target lines : exactly one dashed stop and one dashed target aligned with the preferred bias.
Education panel : rotates core principles and AI-style warnings tied to volatility, risk %, and behaviour flags.
---
2. Volatility engine – ATR with context 📈
atr = ta.atr(atrLength)
atrPercent = (atr / close) * 100
atrSMA = ta.sma(atr, atrLength)
volatilityRatio = atr / atrSMA
isHighVol = volatilityRatio > volThreshold
ATR vs ATR SMA shows how wild price is relative to recent history.
Volatility ratio above the threshold flips isHighVol , which immediately trims risk.
An ATR percentile rank over the last 100 bars indicates calm versus chaotic regimes.
Daily ATR sampling via request.security() gives higher time-frame context for intraday sessions.
When volatility spikes the script dials position size down automatically instead of cheering for maximum exposure.
---
3. Market regime radar – Danger or Drift 🌊
ema20 = ta.ema(close, 20)
ema50 = ta.ema(close, 50)
ema200 = ta.ema(close, 200)
trendScore = (close > ema20 ? 1 : -1) +
(ema20 > ema50 ? 1 : -1) +
(ema50 > ema200 ? 1 : -1)
= ta.dmi(14, 14)
Regimes covered:
Danger : high volatility with weak trend.
Volatile : volatility elevated but structure still directional.
Choppy : low ADX and noisy action.
Trending : directional flows without extreme volatility.
Mixed : anything between.
Each regime maps to a 1–10 risk score and a multiplier that feeds the final position size. Danger and Choppy clamp size; Trending restores normal risk.
---
4. Behaviour engine – trader inputs matter 🧠
You provide:
Emotional state : Confident, Neutral, FOMO, Revenge, Fearful.
Confidence : slider from 1 to 10.
Toggle for behavioural adjustment on/off.
Behind the scenes:
Each state triggers an emotional multiplier .
Confidence produces a confidence multiplier .
Combined they form behavioralFactor and a 0–100 Behavioural Score .
High-risk emotions or low conviction clamp the final risk. Calm inputs allow normal size. The dashboard prints both fields to keep accountability on-screen.
---
5. Correlation guardrail – avoid stacking identical risk 📊
Optional correlation mode compares the active symbol to a reference (default AMEX:SPY ):
corrClose = request.security(correlationSymbol, timeframe.period, close)
priceReturn = ta.change(close) / close
corrReturn = ta.change(corrClose) / corrClose
correlation = calcCorrelation()
Absolute correlation above the threshold applies a correlation multiplier (< 1) to reduce size.
Dashboard row shows the live correlation and reference ticker.
When disabled, the row simply echoes the current symbol, keeping the table readable.
---
6. Position sizing engine – heart of the script 💰
baseRiskAmount = accountSize * (baseRiskPercent / 100)
adjustedRisk = baseRiskAmount * behavioralFactor *
regimeAdjustment * volAdjustment *
correlationAdjustment
finalRiskAmount = math.min(adjustedRisk,
accountSize * (maxRiskCap / 100))
stopDistance = atr * atrStopMultiplier
takeProfit = atr * atrTargetMultiplier
positionSize = stopDistance > 0 ? finalRiskAmount / stopDistance : 0
positionValue = positionSize * close
Outputs shown on the dashboard:
Position size in units and value in currency.
Actual risk % back on account after adjustments.
Risk/Reward derived from ATR-based stop and target.
---
7. Intelligent trade direction – bias without signals 🎯
Direction score ingredients:
EMA stack alignment.
Price versus EMA20.
RSI momentum relative to 50.
MACD line vs signal.
Directional Movement (DI+/DI–).
The resulting Trade Direction row prints LONG, SHORT, or NEUTRAL. No orders are generated—this is guidance so you only risk capital when the structure supports it.
---
8. Stop/target guide lines – two lines only ✂️
if showStopLines
if preferLong
// long stop below, target above
else if preferShort
// short stop above, target below
Lines refresh each bar to keep clutter low.
When the direction score is neutral, no lines appear.
Use them as visual anchors, not auto-orders.
---
9. Session Risk map – global volatility clock 🌍
Tracks Asian, London, and New York windows via UTC.
Computes average ATR per session versus global ATR SMA.
Labels each session High/Med/Low and colours the cells accordingly.
Top row shows the active session plus current UTC time so you always know the regime you are trading.
One glance tells you whether you are trading quiet drift or the part of the day that hunts stops.
---
10. Floating risk badge – honesty above price 🪪
Text ranges from Ultra Cautious through Very Aggressive.
Colour matches the risk palette inputs (High/Med/Low).
Updates on the last bar only, keeping historical clutter off the chart.
Account risk becomes impossible to ignore while you stare at price.
---
11. Education engine & warnings 📚
Rotates evergreen principles (risk 1–2%, journal trades, respect plan).
Triggers contextual warnings when volatility and risk % conflict.
Flags when emotional state = FOMO or Revenge.
Highlights sub-standard risk/reward setups.
When multiple danger flags stack, an AI-style warning overrides the tip text so you can course-correct before capital is exposed.
---
12. Alerts – hard guard rails 🚨
Excessive Risk Alert : actual risk % crosses custom threshold.
High Volatility Alert : ATR behaviour signals danger regime.
Emotional State Warning : FOMO or Revenge selected.
Poor Risk/Reward Alert : risk/reward drops below your standard.
All alerts reinforce discipline; none suggest entries or exits.
---
13. Multi-market behaviour 🕒
Intraday (1m–1h): session box and badge react quickly; ideal for scalpers needing constant risk context.
Higher time frames (1D–1W): dashboard shifts slowly, supporting swing planning.
Asset classes confirmed in validation: crypto majors, large-cap equities, indices, major FX pairs, and liquid commodities.
Risk logic is price-based, so it adapts across markets without bespoke tuning.
15. Key inputs & recommended defaults
Account Size : 10,000 (modify to match actual account; min 100).
Base Risk % : 1.0 with a Maximum Risk Cap of 2.5%.
ATR Period : 14, Stop Multiplier 2.0, Target Multiplier 3.0.
High Vol Threshold : 1.5 for ATR ratio.
Behavioural Adjustment : enabled by default; disable for fixed risk.
Correlation Check : optional; default symbol AMEX:SPY , threshold 0.7.
Display toggles : main dashboard, risk badge, session map, education panel, and stop lines can be individually disabled to reduce clutter.
16. Usage notes & limits
Indicator mode only; no automated entries or exits.
Trade history panel intentionally disabled (requires strategy context).
Correlation analysis depends on additional data requests and may lag slightly on illiquid symbols.
Session timing uses UTC; adjust expectations if you trade localized instruments.
HTF ATR sampling uses daily data, so bar replay on lower charts may show brief data gaps while HTF loads.
What does everyone think RISK really means?

Trinity Supertrend EliteTrinity Supertrend Elite - the one line to rule them all!
This is the smoothest, most respected, and most adaptive super trend line on TradingView today in our humble opinion.
When price is above the line → only longs make sense.
When price is below the line → only shorts make sense.
When the line is solid color → the daily trend agrees (extra confidence).
When the line is faded → you are fighting the higher-timeframe (be careful).
That’s it. One line tells you the entire market bias.
Why this beats every standard SuperTrend and every EMA (34, 50, 200, etc.)
Standard SuperTrend flips too early and too often — you get chopped to death in sideways markets.
Classic EMAs (34, 50, 200) lag so much that by the time they turn, half the move is gone.
The Trinity Baseline fixes both problems at once:
It uses a long, smart ATR + double smoothing (WMA → EMA) so the line is silky smooth and almost never whipsaws.
It adapts itself in real time — tightens in explosive trends, widens in chop, and even listens to the daily chart before committing.
It adds two-candle confirmation so fake flips are virtually eliminated.
It can optionally weigh real volume, making it follow institutional money instead of random noise.
Result: the line price respects like a magnet, often for weeks at a time.
How to use it (simple rules)
Never fight the line
Cyan = long only
Magenta = short only
Flat/sideways line = sit on your hands
Best entries
Pullbacks or bounces directly off the line
Breakouts that happen while the line is solid color (daily agreement)
Best timeframes
<10mins use the scalping the Holy Trinity Line preset
15m–1H for scalping/swing (use “15m–1H God Mode Enabled” preset)
4H–Daily for swing/position (use “4H–Daily Swing King”)
Weekly for long-term holds (use “Weekly Master of the Universe”)
Custom Settings: do you dare change the presets. If you do then we wish you well...
Combine with anything you already like
RSI, MACD, order blocks, liquidity grabs, your own Trinity Impulse oscillator — everything works better when you only take trades in the direction of this line.
Bottom line
If you want the single highest-probability filter that exists in the public TradingView world — one line that removes 80-90 % of losing trades before you even press the button — this is it.
Add it once, pick your preset, and watch how clean your curve becomes.

FX Global Strength — Interpretation & Trading FrameworkFX Global Currency Strength — Interpretation & Trading Framework
Enhance your market reading with real-time global strength lines for all major currencies.
Use this tool to confirm breakout validity, detect early divergences, and understand money flow dynamics across FX pairs.
Tip: I strongly recommend backtesting each technique on your preferred market conditions.
COMPONENTS
• Global Strength Lines
Show the relative performance of each major currency calculated across all their pairs.
You can apply the indicator on any timeframe — M1 to Monthly — and the strength is recalculated based on the selected period.
• Strength Difference (Base vs Quote)
Automatically computes which currency is stronger on the chart pair you are trading.
• Interactive Legend
Clear color-coded layout to instantly recognize each currency’s strength line.
HOW TO READ & INTERPRET
1. Global Currency Strength Lines
Higher line = stronger currency, gaining value across the market.
Lower line = weaker currency, losing value across pairs.
Quickly identify which currencies are being bought or sold globally.
Avoid low-quality setups: when both currencies of a pair are equally strong or equally weak, price tends to range or give false signals.
2. Risk-On / Risk-Off Context
Strength clustering reveals market sentiment:
Risk-On: high-beta currencies (AUD, NZD, GBP) strengthening together while safe havens (JPY, CHF) weaken.
Risk-Off: JPY/CHF strengthening while AUD/NZD/GBP weaken.
This helps confirm trend reliability and reduces the chance of trading against global flows.
3. Breakout Confirmation Using Strength
Before trading a breakout on your chart:
Check if the base currency is rising and the quote currency is dropping.
A breakout is more valid when price action + global strength move in the same direction.
If the chart breaks out but strength lines do not confirm the move, consider it a high probability of a false breakout.
4. Divergence Detection
Global strength lines provide early warnings:
If price makes new highs but base currency strength does not, momentum is fading.
If price makes new lows but quote currency weakens slower, a reversal may form.
This acts like an advanced RSI-style divergence, but measured across the entire FX market, not just one pair.
5. Money Flow Insight
Because the indicator aggregates data across all major pairs:
You can clearly see where capital is flowing across the FX market.
This helps you choose the best pairs to trade, not just the direction.
Example:
If USD is the strongest and JPY is the weakest → USDJPY typically offers strong, clean directional movement.
SUMMARY — Why This Indicator Helps
✓ Confirms your breakout trades
✓ Avoids weak or noisy chart conditions
✓ Catches early divergence before price reverses
✓ Shows market sentiment (risk-on / risk-off)
✓ Helps select the cleanest, most directional currency pairs
✓ Works on any timeframe, adapting to your trading style (scalping, swing, or position trading)

FX Fresh Momentum FX Fresh Momentum calculates the true strength and session momentum of the 8 major currencies using a 7-pair average and session resets (Tokyo, London, New York).
Each session opens with a zero-base, allowing you to see only the fresh momentum.
Includes pair-averaged strength, ×100 momentum scaling, vertical session dividers, and institutional color coding.
Ideal for FX day traders who want cleaner session-based momentum signals

Sector Monitor✅ Custom Index Strength
Key Features:
Custom Indices: It mathematically combines stocks (like HDFC + ICICI + Kotak) to create a synthetic "Private Bank Index" that you can't find anywhere else. (Note all the stocks are Equal weighted)
Performance Tracking: Shows how much a sector has moved over 1 Day, 1 Week, 1 Month, etc.
RRG (Relative Rotation): A smart algorithm that tells you if a sector is leading the market or falling behind.
Understanding the "RRG" (Relative Rotation Graph)
This is the most powerful column in the table. It compares the sector against a benchmark (usually Nifty 500 EW) to tell you the "Health" of the trend.
It classifies every sector into one of four phases , similar to a clock cycle:
💚 Leading (Strong Trend): The sector is outperforming Nifty and momentum is strong. This is where the bulls are.
💛 Weakening (Taking a Breath): The sector is still strong, but it is starting to slow down. It might be time to book profits or wait.
❤️ Lagging (Weak Trend): The sector is underperforming. It is weak and losing money compared to the market. Avoid these.
💙 Improving (Waking Up): The sector was weak, but momentum is coming back. This is often where new trends start.
✅ RRG explained
Relative Strength (RS): how the sector is doing versus the benchmark today. RS = sector price divided by benchmark price.
Strength (X-axis): compare today’s RS with RS from (default 20) days ago . If today’s RS is higher than 20 days ago → Positive strength; lower → Negative.
Momentum (Y-axis): compare today’s RS with RS from (default 5) days ago . If today’s RS is higher than 5 days ago → Improving; lower → Worsening.
Numeric walk-through
Assume benchmark = 100 today, 95 (5D ago), 90 (20D ago).
Assume sector = 110 today, 100 (5D ago), 95 (20D ago).
RS today = 110 ÷ 100 = 1.10.
RS 5D ago = 100 ÷ 95 = 1.0526.
RS 20D ago = 95 ÷ 90 = 1.0556.
Strength (today vs 20D ago): RS moved from 1.0556 to 1.10 → about +4.2% → Positive.
Momentum (today vs 5D ago): RS moved from 1.0526 to 1.10 → about +4.5% → Improving.
Label: Positive + Improving = Leading.
Quick examples for each quadrant
(numbers are RS values; you can imagine each came from “sector ÷ benchmark”)
Leading (Positive & Improving)
RS(20D) 1.00 → RS(today) 1.10 ⇒ Strength +10% (Positive)
RS(5D) 1.05 → RS(today) 1.10 ⇒ Momentum +4.8% (Improving)
Weakening (Positive & Worsening)
RS(20D) 1.00 → RS(today) 1.08 ⇒ Strength +8% (Positive)
RS(5D) 1.12 → RS(today) 1.08 ⇒ Momentum −3.6% (Worsening)
Improving (Negative & Improving)
RS(20D) 1.05 → RS(today) 0.98 ⇒ Strength −6.7% (Negative)
RS(5D) 0.95 → RS(today) 0.98 ⇒ Momentum +3.2% (Improving)
Lagging (Negative & Worsening)
RS(20D) 1.00 → RS(today) 0.90 ⇒ Strength −10% (Negative)
RS(5D) 0.95 → RS(today) 0.90 ⇒ Momentum −5.3% (Worsening)
✅ 3. How to Use the Settings (Inputs)
When you open the settings menu, here is what each section controls:
Theme / Colors
Dark Mode: Check this if you use a dark background on Trading View.
Light Mode Theme: Choose between "Blue & Purple" or standard "Green & Red" for Up/Down colors.
RRG Settings
RRG Benchmark: What are we comparing our sectors to? usually, this is NIFTY 500 EW.
If Nifty is up 1% and your sector is up 2%, your sector is "Leading."
RS Period (Score): How far back do we look to check strength? (Default: 20). Lower numbers make it react faster; higher numbers make it smoother.
Momentum Lookback: How fast is the trend changing? (Default: 5).
Table Settings
Show Col 1 / 2 / 3: You can choose to see up to 3 timeframes plus the RRG column.
Timeframes (1D, 1W, 1M...): Set these to match your trading style.
Day Trader: Set Col 1 to 1D (1 Day) and Col 2 to 1W (1 Week).
Investor: Set Col 1 to 1M (1 Month) and Col 2 to 6M (6 Months).
Sort By: This is crucial. You can sort the table by "RRG" (to put the strongest sectors at the top) or by "Column 1" (to see today's biggest gainers).
Rows Shown: Limit the table to the "Top 10" or "Top 20" if the table is too big for your screen.
Symbol Selection
This is where the magic happens. The script comes pre-loaded with groups like "NBFC," "Housing Finance," etc.
Checkbox: Turn a specific sector ON or OFF in the table.
Input Box: You can actually edit the stocks!
Example: The input might look like NSE:TCS+NSE:INFY.
If you want to add Tech Mahindra, you simply add +NSE:TECHM to the text. The indicator will instantly recalculate the sector based on your new list.
✅ 4. Adjusting Inputs for Your Time Horizon
The logic is simple:
Lower Numbers: Make the indicator faster and more sensitive. It reacts quickly to price jumps but creates more "noise" (false signals).
Higher Numbers: Make the indicator slower and smoother. It filters out small corrections but reacts late to new trends.
Short-Term (Intraday / Fast Swing)
Recommended Inputs: Strength 10 | Momentum 3
Why: You need speed. By lowering the Strength to 10 days and Momentum to 3 days, the RRG will react instantly to sudden bursts of buying.
Best For: Catching "Micro-Rotations" (e.g., a sector suddenly waking up for a 2-3 day rally).
Trade-off: You will see sectors jump between "Leading" and "Weakening" very frequently.
Medium-Term (Standard Swing Trading)
Recommended Inputs: Strength 20 | Momentum 5 (Default)
Why: This is the "Goldilocks" zone. It ignores the daily noise but is fast enough to catch a trend that lasts for a few weeks.
Best For: Identifying the main theme of the current month.
Trade-off: Balanced. It might be slightly too slow for scalpers and slightly too fast for multi-year investors.
Long-Term (Position Investing)
Recommended Inputs: Strength 60 | Momentum 15
Why: A strength lookback of 60 (approx. 1 quarter) ensures you are only looking at major structural trends. A momentum of 15 ensures that a 2-day drop doesn't scare you out of a "Leading" sector.
Best For: Building a portfolio to hold for 6–12 months. If a sector is "Leading" here, it is in a massive bull run.
Trade-off: Very slow. By the time a sector turns "Leading," the trend has already been established for a while.
✅ 5. The "Secret" Tooltip Feature
Don't forget to hover your mouse cursor over the RRG Status text in the table (e.g., over the word "Leading").
A detailed box will appear showing:
Math: Exact Strength and Momentum scores.
Strategy: A text advice (e.g., "Trend is strong. Look for breakouts").
Constituents: The exact list of stocks used to calculate that sector's performance. This saves you from having to guess which stocks belong to that group.

Momentum Reversal / Dip Buyer [Score Based]Strategy Overview
Momentum Reversal / Dip Buyer is a quantitative reversal engine designed to fade stretched moves and buy dips / sell rallies when multiple momentum and context factors line up. It’s built for liquid instruments especially for ticker CME_MINI:ES1! and works best on intraday timeframes like the 5-minute or 1-minute chart.
Core Logic
This strategy builds a composite Momentum Score by combining:
Price Location: Relative to 100 SMA, 1000 EMA, and VWAP (trend / regime filter).
RSI: Overbought/oversold and mid-zone strength.
VWMO (Volume-Weighted Momentum): Direction and strength of volume-weighted price drift.
ADX: Trend strength filter (high vs low trend environment).
Full Stoch (%K): Short-term exhaustion and mean-reversion context.
CCI: Overbought/oversold turns (key trigger).
MFI: Volume-confirmed buying/selling pressure.
ATR Regime: High vs low volatility environment.
Cumulative Delta: Whether net aggressor flow is rising or falling.
From this, a single Momentum Score is computed each bar:
Longs: Taken when the score is depressed (scoreLow) and CCI crosses up from oversold.
Shorts: Taken when the score is elevated (scoreHigh) and CCI crosses down from overbought.
Risk Management & Trade Logic
Max Daily Trades: Hard cap on entries per day.
Hard Stop: Fixed % stop based on entry price.
Profit Target: Target ATR Multiplier × main ATR from entry.
Breakeven Logic: Optional; moves stop to breakeven (plus optional offset) after price moves a configurable multiple of the main ATR in your favor.
Trailing Stop (Separate ATR): Optional; uses its own ATR length and ATR-based trigger and distance. This lets you run slower ATR for targets while using a tighter, more reactive ATR for the trail.
Session Control
Trading Window: Optional session filter (e.g., 09:30–16:00). Entries are only allowed inside the defined window.
Force Flat at Session End: Option to automatically close all open positions when the session ends.
Visuals
The script plots entry arrows and a compact dashboard displaying: current Momentum Score, daily trade usage, and CCI status.
Disclaimer:
This script is for educational and research purposes only and is not financial advice. Past performance does not guarantee future results. Always forward-test and adjust parameters to your own risk tolerance and market.
Shoutout and all credit goes to AuclairsCapital for building the base foundation of this strategy on ThinkScript

Pre-Market Confirmed Momentum – FULL WATCHLIST 2025**Pre-Market Confirmed Momentum – High-Conviction Gap Scanner (2025)**
Scans 94 high-liquidity NASDAQ/NYSE stocks (NVDA, TSLA, COIN, AMD, SOFI, ASTS, CIFR, etc.) for strong pre-market gap-ups that are confirmed by both elevated volume and broad-market strength.
**Entry triggers only when ALL are true at 09:29 ET:**
- ≥ +1.5% gap from previous regular close
- Pre-market volume ≥ 2.5× the 20-day average
- QQQ pre-market ≥ +0.5% (market filter)
Back-tested June 2024 – Dec 2025:
68 signals → **+1.96% average intraday return** → **75% win rate** after 1.5% hard stop.
Features large on-chart labels, triangle markers, and dynamic `alert()` messages with exact gap % and volume multiple. Works on 1-min or 5-min charts with extended hours enabled – perfect for day traders hunting clean, high-probability momentum entries at the open.
Ready for watchlist scanning and real-time alerts. Enjoy the edge! 🚀