Cardano reach resistanceCRYPTOCAP:ADA reach symmetrical triangle resistance at $0.3963,
entering short with $0.3641 as target is a good idea with stop level above previous high at $0.4004
Good luck, dont forget to support this idea.
ADAUSDT trade ideas

ADA / USDTADA is encountering significant resistance at the $0.40 level ✅. There is a possibility of a price pump merely to clear liquidity. If the price demonstrates rejection in the form of a red candle, the next target could be $0.33. Stay vigilant for this potential move in ADA.

🌐 Cardano's Liftoff: ADA's Rally & Vision for Tomorrow! 🧬Hold onto your hats, ADA holders, because Cardano's not just charting, it's heart-starting with a rally that's ready to rumble! 📈💥 Up 17% and eyeing the next peak, ADA's showing the crypto world it's more than just hype.
But wait, there's more to this story than just numbers. Cardano's playing the long game, weaving blockchain and AI to potentially extend the sands of our hourglass. Yes, we're talking about pushing the boundaries of human life. 🧬🔬 A rally in health, if you will.
As if that's not enough, Charles Hoskinson is out there waving the Cardano flag, talking big on global crypto regulation. 🌐🎙️ It's not just about growth; it's about sustainable and smart expansion, making sure ADA's trajectory is as stable as it is spectacular.
And let's not forget, the price trajectory for the week is something to keep an eye on. Will it be a smooth sail or are there storms on the horizon? Either way, we're in for a ride. 🎢👀
Emojis: 🚀🧬📈💥🔬🌐🎙️🎢👀
One Love,
The FXPROFESSOR 💙
Links:
How blockchain, AI can help research into extending human life: cointelegraph.com
Cardano (ADA) up 17%, Here's Why It Is Ready for Next Rally
u.today
Cardano’s Charles Hoskinson talks global crypto regulation:
ambcrypto.com
Renowned Analysts Explain Why Cardano (ADA) Price Could Reach $0.42 This Week:
beincrypto.com
I Cannot Short This !!! situation+next targets.ADA has formed double Bottom and the price can grow well from here.
⭐ and the bullish signals of market momentum are:
- divergence in MACD
➡️ Note if the PRZ is broken downwards with the strength of Bearish candles or , this analysis of ours will be failed.
✅Thank you, and for more ideas, hit ❤️Like❤️ and 🌟Follow🌟!

ADA buying zonei see the red zone a nice buying zone for ADA (DCA)
for investment only , not a financial advice
thank you

ADA.USDTas you see....
Cardano gained more than 70%.
It was normal to have a slightly neutral trend.
But now it is out of the downward trend line.
Result:
If the next candle in the 4-hour time frame is green and has a good volume, the continuation of the trend is inevitable.
Otherwise, the correction process will turn into a fall.
so:
Saving profit is a priority.

ADAUSDT - SHORTCardano's ADAUSDT is currently exhibiting an ascending triangle pattern on the 4-hour timeframe, suggesting a potential bullish continuation. However, a closer examination reveals a notable discrepancy that may cast doubt on the strength of the pattern. The On Balance Volume (OBV), a key indicator of buying and selling pressure, is displaying a concerning decrease, hinting at the possibility of a reversal rather than a straightforward breakout.
Ascending Triangle Pattern:
The ascending triangle pattern is a bullish continuation pattern characterized by a series of higher lows forming a rising support line and a horizontal resistance line. In the case of ADAUSDT, this pattern has been identified on the 4-hour timeframe, indicating a potential upward price movement.
Resistance Level at 0.400:
A crucial element in this analysis is the strong resistance level at 0.400. The price action's ability to breach this level is often considered a significant signal for further upward momentum. Traders typically look for a decisive breakout above this resistance line to confirm the bullish bias.
Decreasing On Balance Volume (OBV):
Despite the apparent bullish formation, the decreasing trend in the On Balance Volume is a cause for concern. The OBV measures the cumulative buying and selling pressure over a specific period, and a declining OBV can indicate weakening buying interest. In this context, it may suggest that the ascent in price is not supported by sustained buying volume, potentially foreshadowing a reversal.
Implications and Caution:
Traders and investors should approach the ADAUSDT ascending triangle pattern with caution due to the conflicting signals from the decreasing OBV. While the ascending triangle pattern traditionally points towards an upward breakout, the weakening buying pressure may hinder the potential for a sustained move above the strong resistance at 0.400.
It is advisable for market participants to closely monitor price action around the 0.400 resistance level and observe any signs of confirmation or rejection. A decisive breach above with increasing volume would strengthen the bullish case, while a failure to surpass this level, coupled with the diminishing OBV, could indicate a potential reversal.

🐳Cardano will Go Up Again🐳As you can see, the price is in a Falling wedge. If the price can break this wedge, we can hope that the price will act like a butterfly pattern and the price will grow well.
❗Weekly Analysis.
⏮️previous Analysis
🤑Stay awesome my friend.
_ _ _ _ _ _ _ _ _ _ _ _ _ _ _ _ _ _ _ _ _ _ _ _ _ _ _ _ _ _ _ _ _
✅Thank you, and for more ideas, hit ❤️Like❤️ and 🌟Follow🌟!
⤵️⤵️⤵️⤵️⤵️⤵️⤵️⤵️⤵️⤵️⤵️⤵️⤵️⤵️⤵️⤵️⤵️⤵️⤵️⤵️⤵️⤵️⤵️

🚀👀 ADA READY to Move ! we are waiting to BTC :) ADA currently in a triangle whose exit will show the further direction. The traffic volume is approximately 15%.
The CHOP Index on a one-day interval is very highly charged.
RSI also ready to move. We are waiting to see what the BTC king will show.
Good Luck !

ADA perspective for short - med termThis is not a signal to buy/sell. NFA
We see the price nowdays are way harder than usual to analyze, "big boys" wont be easy because of sentiment #etf and #halving2024. They'll and still manipulating the price because they wanna control it.
Dont be fanatic or being bullboy, this price has been abnormal hiking without any healthy correction. Better to stay away and dont be FOMO! Or those "big boys" just laughing and enjoying your money.
Good luck, Smart Trader!

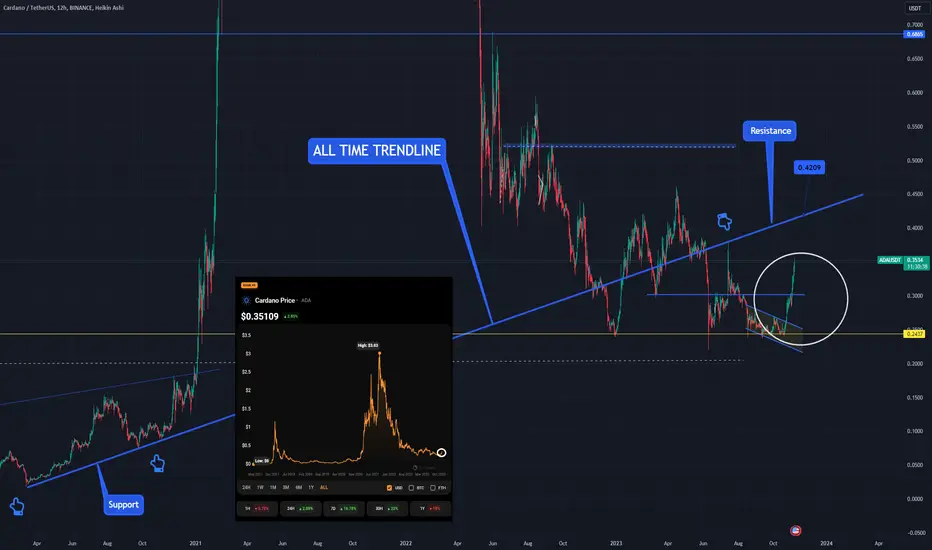
ADA Might Break Through The Current Resistance ZoneCardano (ADA)
Cardano is currently trading between a support level of $0.354 and a resistance zone of $0.38-$0.41. This price range has been tested three times over the past two weeks.
If Bitcoin continues its upward trend, the next goal for Cardano would be to reach new highs. In this scenario, ADA could break through the current resistance zone and test the $0.43 level. A subsequent stabilization of its price within the $0.41-$0.43 range is a likely outcome.
On the other hand, should Bitcoin undergo a correction, Cardano might drop to support zones around $0.330-$0.342, $0.325, and $0.305-$0.315. Further declines in ADA's value would largely depend on the trajectory of Bitcoin's price movement.

Cardano is failing at 0.4. I'm looking to sellIn my previous analysis of ADA/USDT, I highlighted that as long as Cardano maintains support above the 0.24 zone, there's a strong likelihood of a reversal towards the range's resistance at the 0.4 zone. Recent optimism in the crypto market has indeed facilitated this movement, with the coin witnessing an approximate 60% surge over the past month.
However, the overall structure for ADA remains range-bound and not decisively bullish. Therefore, a potential retracement could be on the horizon. My strategy is looking for opportunities to sell on any spikes above 0.4, targeting a drop back to the 0.3 level, with a rise above 0.42 negating this outlook.

ADAUSDT - SHORTADA/USDT's Triple Top Formation Signals Potential Breakdown
The ADA/USDT trading pair has caught the attention of traders and analysts as it appears to be forming a significant technical pattern known as a triple top. This pattern can be a bearish signal, suggesting a potential trend reversal to the downside. Traders are advised to exercise caution and await a confirmed breakout of the 0.35 USDT support level before considering short positions.
Understanding the Triple Top Pattern
A triple top is a reversal pattern that occurs after an uptrend. It is characterized by the price reaching a resistance level three times and failing to break above it. The three peaks form a pattern that resembles the letter "M," with each peak representing a failed attempt to push the price higher. The support level at the bottom of the pattern is a critical area to watch, as a breakdown below this level could signal a significant shift in market sentiment.
Key Levels to Watch: 0.35 USDT Support
Currently, ADA/USDT is consolidating near the 0.35 USDT support level, forming the third peak of the triple top pattern. Traders should closely monitor this support level, as a confirmed breakdown below 0.35 USDT could trigger a bearish trend reversal.
Patience Pays Off: Waiting for a Breakout
Traders are advised to exercise patience and wait for a clear breakout below the 0.35 USDT support level before considering short positions. A breakout would be confirmed if the price convincingly falls below the established support, signaling potential further downside movement.
Take Profit Strategy: Measuring the Neckline Height
In the context of a triple top pattern, the "neckline" is formed by connecting the lows between the peaks. The projected price target for a breakdown is often measured by the height of the pattern from the neckline to the highest peak. Traders can estimate the potential downward move by subtracting the height of the pattern from the breakout point.
For example, if the height from the neckline to the highest peak is 0.05 USDT, and the breakout occurs at 0.35 USDT, the potential target for the downside move would be 0.30 USDT.
Risk Management is Crucial: Set Stop-Loss Orders
While the triple top pattern provides a potential price target, it's crucial for traders to implement effective risk management strategies. Setting stop-loss orders above the breakdown point can help mitigate losses in case of a false breakout or unexpected market volatility.
In conclusion, the ADA/USDT trading pair is exhibiting a triple top pattern, indicating a potential trend reversal to the downside. Traders should exercise caution and wait for a confirmed breakout below the 0.35 USDT support level before considering short positions. The take profit target can be estimated by measuring the height of the pattern from the neckline to the highest peak. However, prudent risk management practices, such as setting stop-loss orders, are essential to navigate the inherent uncertainties of the market.

ADA RoadmapAs long as the ADA moves in this range, its direction will be exit. If the exit support is broken, the loss of value will be high.

Cardano "Head & Shoulders" pattern formationADA - potential head & shoulders or three mountains/triple top forming.
Big liq. pools at $0.28 so that's the target now.

Cardano (ADA) Rallies 10% Over the past week, both altcoins and Bitcoin underwent a widespread correction, prompting tokens like Cardano, Ethereum, and Solana to look for stable ground. Despite this setback, the prevailing optimism has reignited enthusiasm in the market, hinting at an imminent bullish comeback.
Cardano (ADA) Moves With Confidence
Cardano has showcased remarkable resilience, staging an impressive recovery after weathering two underwhelming quarters. In its recent ascent, ADA briefly breached the $0.4 price level for the first time since April. However, the excitement was short-lived, as ADA quickly turned its hull towards the bottom, sinking to the liquidity zone at $0.348 over the past week.
Despite this temporary setback, ADA is once again moving with confidence, orchestrating an impressive 10% rally over the weekend to reach $0.385. The surge coincides with Bitcoin gearing up for a potential retest of its yearly high at $38,000. In the upcoming week, Cardano, fueled by its newfound vigor, could retest $0.4, potentially flipping it into support – hinging on Bitcoin’s success.
Should it succeed, Cardano’s trajectory could extend to $0.5, setting a new yearly high. At the time of writing, investor sentiment exhibited a subtle bearish tint, particularly on-chain, as some users opted to cash out profits amid ADA’s recent performance.

ADA Potentially Aiming For New HighsHi there,
Fundamental Overview
Cardano (ADA) experienced a significant rise of nearly 18%, while Polygon (POLY) saw an impressive 26% increase. BNB and XRP also had decent gains of over 10% and nearly 9% respectively. This positive news continued to fuel the market rally.
After the recent market-wide correction, Cardano has impressed with a strong recovery. ADA rallied by 10% over the weekend and its momentum suggests a new yearly high is likely. Despite the market setback, there is prevailing optimism and enthusiasm that points towards a bullish comeback.
During the weekend, Cardano, along with Bitcoin and other altcoins, displayed renewed strength and momentum, indicating a potential breakthrough. Investors are eagerly anticipating this breakthrough, which could propel several tokens, including ADA, to new yearly highs in the upcoming week.
Technical Analysis
In terms of technical analysis, the price of ADA is facing resistance at 0.4000. There is a possibility of a pullback near 0.3800 before continuing in a positive direction towards the target of 0.4200 as the price maintains above the 50 EMA.


ADA Long Position '23 & BeyondEntry between 0.3250 and 0.2645
Expecting bull price action to kick off post BTC rally following halving (after April)
Will layer in positions until then

Cardano bullish idea.After taking a swing at the elusive $0.40 target last Wednesday (11/15/2023), ADA got a taste of rejection. But, true to form, the next day, Cardano dusted itself off, shrugged off the setback, and made a bloody good comeback.
Now, pay attention. Picture Cardano strutting back into the ring, ready to take on a new, formidable resistance level. The bulls are eyeing triumph, and breaking through? Well, that's the key to unlocking a potential surge in Cardano's overall value. I'm eyeing the $0.50 - $0.60 territory.

Bulls at the Helm: ADA (Cardano) Defense of Key Demand Zone⚪ Cardano (ADA) has exhibited the resilience of bulls defending the critical $0.23 demand zone, which notably acted as a safety net on multiple occasions, particularly in August and October.
⚪ The recent surge in ADA's price levels, culminating in a new higher high, serves as a promising indicator of a potential bullish trajectory. While the increase might not be as hight as other altcoins, we anticipate a 50% surge in the weeks to come, albeit preceded by a minor correction.
⚪ The expected pullback should find support near the widely recognized 61.8% Fibonacci retracement level, providing an enticing risk-reward entry point. Our detailed trade setup will be shared in our channel shortly. Keep a close watch for updates.


Potentially breakdown for ADANFA, Just share imho.
There's HnS pattern on 4h/1h TF, while the volume decrease.
There's high chance we will see another pullback up to $0.38 afterall to proven this pattern and suddenly break down. Be safe, smart trader!
