XOP trade ideas


XOP - DAILY CHARTXOP - SPDR S&P Oil & Gas Exploration & Production ETF
The ETFs seems poised to be affected by the recent news regarding the Oil output, that it's increasing due to the latest report from Iran that discovered a new oil field with over 50 billion barrels, plus the announcement from OPEC + that isn't going to cut its Oil output for now. Working in favor of the asset we have for now only the perspective of increase of revenue on this quarter due the Winter season, but this its a weak argument compared to the current geopolitical context.
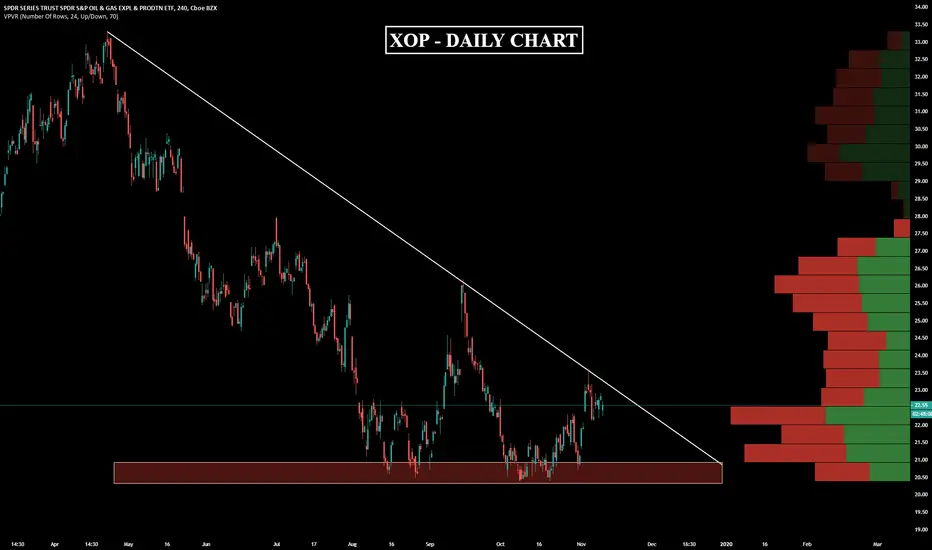


SYMMETRICAL TRIANGLE ON XOPThe chart shows the analisys of a Simmetrical Triangle for XOP in ETF Market using 1 day of timeline. The trend is continuous and descending, the upper dide of the triangle is touched by Points 1,2 and 3 and the lower side is touched by Points 4,5,6 and 7. A break out point occurs and it is time to open a short position.

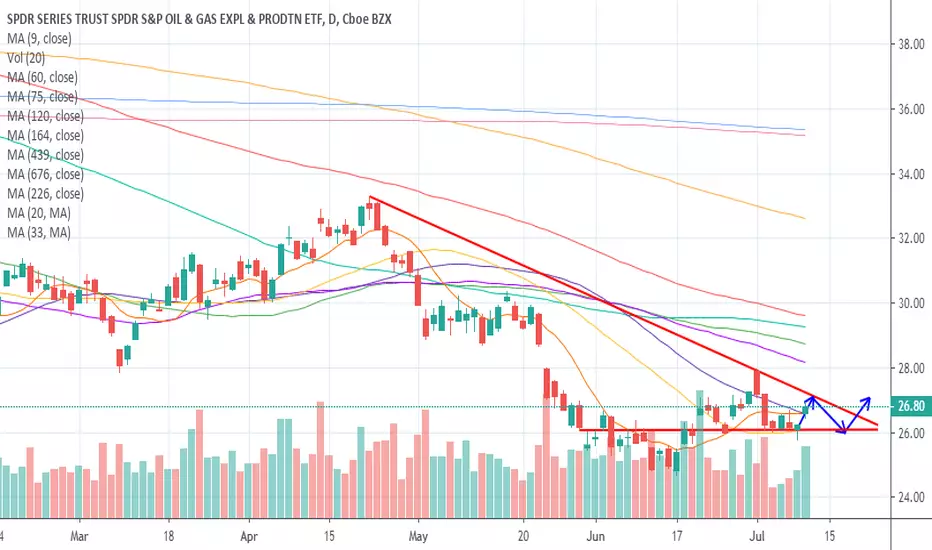
Possible Reversal of XOP (Oil & Gas Exploration & Production)Here we have an enormous falling wedge pattern with a textbook Elliot Wave ending diagonal. We also have bullish divergences. If TA is our guide the upside could be at least 70%.


XOP: Plan to LONG XOP for two weeksPlan to buy CALL on Monday Open, then keep it for two weeks.
details information @
youtu.be


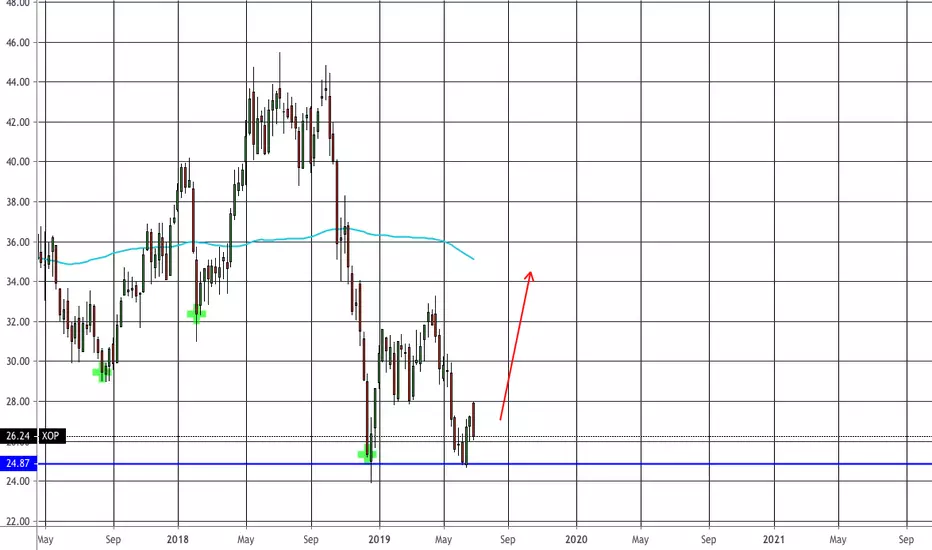
XOP Forms a Potential Bear TrapThe Oil and Gas Exploration and Production industry has been hammered. I typically have no interest in weak sectors...until there's a potential bear trap which sets up a major bullish opportunity. That setup could be underway now.
A few weeks ago XOP broke below the 2016 low, consolidated, and has since jumped back above the 2016 low. This was on massive volume. Volume has been escalating, and in July and August, it looks like the bulls threw in the towel as the price went below the 2016 low. This has been followed by even larger volume to the upside this week. A nice shift from fearful and excessive supply to hungry demand.
The profit target is a relatively conservative estimate from this oversold condition. But of course, we'll have to see. This a medium-term trade, and will likely take 9 to 18 months to unfold.
Disclosure: Likely initiating a long this week.

XOP: will buy XOP around tomorrow noon Sep/10 2019Maybe before EIA report, there will be a good enty


xop yeeshlets see, below 2008, below 2016 crude low print 26$/bbl, and just now breaking down to all time lows, nothing going right for this group, XLE is next

OPENING: XOP NOV 15TH 16/SEPT 20TH 22 LONG CALL DIAGONAL... for a 4.89 debit.
Metrics:
Max Profit: $111/contract
Max Loss: $489/contract
Break Even: 20.89
Delta/Theta: 38.75/.98
Debit Paid to Spread With Ratio: 81.5%
Notes: Going long XOP at long-term lows with a 90/50 long call diagonal (i.e., 90 delta for the long call/50 for the short). Going a little more aggressive with the short call than I usually would to get a little more room to the downside. Shooting for 50% max.


Daily XOP stock forecast trend analysis 10-JUL
Price trend forecast timing analysis based on pretiming algorithm of Supply-Demand(S&D) strength.
Investing position: In Falling section of high risk & low profit
S&D strength Trend: In the midst of a rebounding trend of upward direction box pattern price flow marked by limited falls and upward fluctuations.
Today's S&D strength Flow: Supply-Demand strength had a strong buying flow than a flow in falling section.
read more: www.pretiming.com
D+1 Candlestick Color forecast: RED Candlestick
%D+1 Range forecast: 1.5% (HIGH) ~ -0.1% (LOW), 0.6% (CLOSE)
%AVG in case of rising: 2.1% (HIGH) ~ -0.6% (LOW), 1.3% (CLOSE)
%AVG in case of falling: 0.6% (HIGH) ~ -2.3% (LOW), -1.8% (CLOSE)
BULLISHtesting old pullback levels possible reversal , & downtrend followed by Bullish engulfing (accepted)
OPENING: XOP JUNE 21ST 32 SHORT STRADDLEThis is a continuation of a directionally neutral premium selling play (See Post Below) which I've rolled out to June and transformed into a bullish assumption premium selling play.
Here, I'm looking to work it as a quasi-synthetic covered call, with the in the money short put standing in for my stock, and the short call acting as cover. Naturally, it isn't completely accurate to describe it as a "synthetic covered call" because covered calls have no upside risk, and this setup does. A more accurate description would probably be "bullish assumption short straddle."
A true synthetic covered call would be something like a 70 delta short put with no upside risk since many covered calls are in the area of 70-80 net delta long (100 long delta for the stock, 20-30 delta short for the call).
There are a couple of reasons for why I prefer bullish assumption short straddles to in-the-money short puts with covered call metrics: (a) the delta is a little flatter; and (b) you get a little extra sumthin' sumthin' in cost basis reduction by having the short call on. Here, the net delta of the position is around 50,* versus the 70 delta short put/synthetic covered call. As usual, the trade off is the upside risk aspect of the setup, which will have to be managed as any other oppositional setup would in the event that the underlying rips through the short call strike.
In any event, I've collected 2.86 in credits so far, which would mean my cost basis in any shares assigned via the 32 short put would have a cost basis of 29.14 versus 28.98 spot, so it's slightly underwater at the moment.
Like a covered call, I'll look to roll the setup out as a unit when the short call approaches 50% max.
* -- The net delta on the position can be made "shorter" by setting it up closer to at-the-money; "longer" by setting it up farther away. Generally speaking, I like to sell the 25 delta short call and sell the same strike short put, which generally yields delta metrics in the 40-50 net long area, depending on skew.
