XOP trade ideas

Falling wedge with positive hourly MACD divergence Showing bull divergence working with falling wedge pattern. Stochastic at bottom of range and price at bottom of trend.

XOP is going DOWN to test the bottomI'd buy drip here to gain about 200% in short order. Watch for the bottom and ride gush on the way up for the BREAKOUT of the bullish symmetric.


$XOP channel breakdown - March 16, 2021$XOP broke below the bullish channel today with a gap down. I'm expecting this to continue downward. The ideal entry is on the retracement. I see this going down more over the coming weeks.

XOP Finds ResistanceHere is a logical place for the run in oil and gas companies to find some resistance. These stocks have shown some really great relative strength, but maybe it's time for a pause. I don't think a short is advisable, but I'd be cautious adding any longs here and it would probably be a good time to take some profits from existing positions. Top components of XOP include FANG, MRO, DVN, OXY, APA, XOM, VLO

Oil will be leading the market in 2021XOP against the QQQ. Reaching pivotal lows with macd cross. Will continue to lead the market as the reopening continues.


Something to Watchno confirmation = no trade
no profit margin = no trade
must get a confirmation on LTF
Either 15M Timeframe or 10M or 5M
we must get a change of trend on those timeframes like price coming into the zone with LL/LH and we need HH/HL To come in!
that's how i enter 99% of my trades

𝗢&𝗚 𝗨𝗽𝗱𝗮𝘁𝗲: $XOP Weekly. Moving Averages and VolumeMoving averages and volume in and of themselves can tell an interesting story. Is a Wave 3 under way in a new bull?
$DRIP $GUSH $XLE $CL_F $USO $NG_F $UNG $BOIL #Trading #ElliottWave #CrudeOil #OOTT 🛢️

XOP Watch $72 level - making handle or taking off now?Like MJ sector two weeks ago, XOP is close to a breakout after a double bottom. The only question is will there be a handle or shoot straight up.


XOP fractalOil prices have been on a tear lately, driven by a combination of travel recovery and inflation expectations. Oil and gas stocks have been rising along with them. (Other commodities prices are climbing as well, by the way, which bodes well for value stocks for the foreseeable future.)
Oil and gas companies still looks reasonably valued, with roughly 10-15% upside to median valuation of the last 4 years. The space still offers some of the best dividends available, even after a number of companies made dividend cuts last year. However, companies in the space are also still financially pretty weak. Free cash flow has plummeted toward zero even on some of the most secure oil majors. So there's definitely some risk.
In technical terms, I noticed that XOP looks to be making a repeating fractal pattern. If the fractal continues, then we ought to see the price rise more or less straight up from the current close of $72 to my target at about $80, before pulling back toward the trend line. Be aware that I've not traded fractals much, so I don't really know how likely this is to play out. Just posting the idea here for future reference.

Long $XOP Multi-timeframe analysisBullish pennant on the shorter TF for $XOP with confluence at weekly support for the pennant target which shows an amazing R:R for a long opportunity.
But, being that this ETF is fundamentally bearish because of current concerns for the new virus strain and the fact that technically this is still bearish on the weekly, Ill be setting first target to top of pennant. Then, move stop to BE and then just wait and see how the pennant pattern plays out. At this time, when stop is at BE this would be a risk free trade.


XOP, the clues were there.The bottoming clues were there. Good volume buying bars, lower selling bars, relative strength as price was falling. I dont normally play these, but but the R/R was there.

Channel and Wedge at XOP ETFPodemos ver un Canal Ascendente y una Cuña bajista en el SPDR SERIES TRUST


THE WEEK AHEAD: XOP/XLE, GDXJ/GDX, KRE, EWZ, IWM/RUTEARNINGS:
It's a light week for earnings announcements, which means it's an even lighter week for options liquid underlyings, none of which meet my cut-off for 30-day implied >50%.
EXCHANGE-TRADED FUNDS RANKED BY PERCENTAGE THE JANUARY AT THE MONEY SHORT STRADDLE IS PAYING AS A FUNCTION OF STOCK PRICE:
XOP (18/59/15.8%)
GDXJ (16/42/13.2%)
XLE (26/46/11.6%)
KRE (24/40/11.4%)
GDX (17/40/11.4%)
USO (7/46/11.0%)
EWZ (15/39/10.6%)
SLV (25/38/10.3%)
Honorable Mention:
GLD (23.5/18.5/5.0%)
* * *
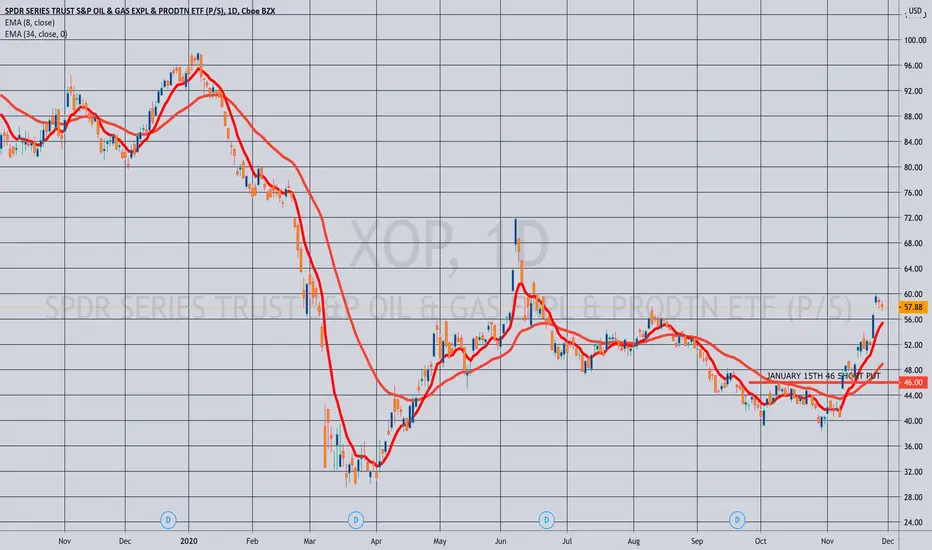
Pictured here is an XOP January 15th 46 short put, which was paying .92 as of Friday close (2.04% ROC as a function of notional risk at max; 15.5% annualized at max). I still like bullish assumption, pandemic recovery plays in the oil space, although implied volatility has bled out quite a bit here, and the break even (45.08) would be above the 2020 lows.
GLD gets an honorable mention here due to its being nearly 15% off of its early August highs with the January 15th strike nearest the 16 delta (the 157) paying .94 as of Friday's close (.60% as a function of notional risk at max; 4.6% annualized). The ROC %-age isn't great, however, but if you're looking to establish a gold position, now might be the time to consider starting one. I'm already working one here, (See Post Below), and will consider adding once December out-of-the-money's fall off or I manage them.
Alternatively, look to establish a position in SLV, GDXJ, or the more liquid GDX, all of which are more scalable due to size and provide more bang for your buck, with the GDXJ January 15th 42 paying .70 (1.7% ROC as a function of notional risk; 12.9% annualized), the GDX January 15th 30 paying .40 (1.4% ROC at max; 10.3% annualized), and the SLV January 15th 19 paying .30 (1.6% ROC at max as a function of notional risk; 12.9% annualized at max).
For those of a defined risk bent, the GLD January 15th 153/158 short put vertical was paying .54 at the mid as of Friday close (10.8% ROC at max; 82.1% annualized).
BROAD MARKET
IWM (23/29/7.8%)
QQQ (19/25/6.9%)
DIA (16/22/5.8%)
SPY (13/21/5.3%)
EFA (16/18/4.6%)
Volatility has pissed out mightily here, and the <10% the at-the-money short straddles are paying in the January cycle are reflective of that.
The IWM January 15th 157 short put was paying .94 (.6% ROC at max as a function of notional risk; 4.6% annualized) as of Friday close, which isn't exactly great. Here, defined is more compelling from a pure ROC %-age return perspective (it usually is), with the IWM January 15th 158/163 was paying .54 as of Friday's close (10.8% ROC at max; 82.1% annualized) and its cash-settled counterpart RUT, paying 5.10 for the January 15th 1610/1660 with similar ROC %-age metrics with the short option legs camped out at the 16 delta strike. Naturally, you can be more aggressive, bringing in the setup more toward the expected move.
$XOP (Oil and Gas Exploration & Products) | Bullish SetupNice long setup after retesting the trendline breakout.
Clear structure swap at $46
Long targets: $51, $54/$55

4th Dimensional Price-Square Completion on January 3rd, 2022Using the bottom trendline, we can place a trendline along the top of the graph. Using the left-handed spiral time series in bars before each reversal area {11, 22, 33, 55}, presented in my past xop idea, and a harmonic starting before the crash and through the first two vectors, we find that the top and bottom of the trendlines at the next two time zones correspond to acceptable fib and fib derivations of the harmonic. We can see that if we add another bullish harmonic from A to E then there should be an extension of the harmonic up to G that is acceptable for that harmonic to work (See Pictures Below). Before my final step, I added vector AB to the origin price to find the top of the 4th-dimensional square created by the vector. Finally, Using a 1 to 4 wave trendline to find price at point 6, I added the final vector trading days to the overall time series trading days, multiplying the total trading days by the slope of the two points and adding that value to the origin price. You can see these final two steps below.
1. Price of 4th Dimensional Square created by V(AB) = A + V(AB) = 121.95
2. Price- Square Completion A-D Slope-Intercept:
i. Add V(DE) to time: 359 + 103 = 462 bars
ii. A + ( ( ( Ay-Dy ) / ( Ax-Dx ) ) * 462 bars ) = 29.25 + ( ( ( 29.25-81.02 ) / ( 0-258 ) ) * 462 ) = 121.95 on Jan 3rd, 2022.

XOP long on pull-back Target 60The energy pack broke out of a multi-month downtrend, and pierced through anchored quarterly VWAP and it's 1 stdev. After a strong move, it's doing what bulls want it to do - after strong candle 1 and 4, retracing from 2nd Stdev before the next leg up. Expect continuation of the TD sequential.
Target 59-60 to profit take, its immediate support at 47, strong support at 44.
Position: Long call
Disclaimer: These should be seen as the commentator's Notes to Self. Hopefully educational but aiming for entertaining. No legal or financial liabilities should be pursued from these materials.
