Bitcoin fighting to break away from 60k zone for goodthird time in bitcoin history it broke 60k but recently has been showing signs of breaking up for good. Thoughts?
BEARUSD trade ideas

Bitcoin Halving - What will happen? Historically, Bitcoin halvings have been associated with price increases in the past.
Supply Reduction: Bitcoin halvings reduce the rate at which new Bitcoins are created, effectively reducing the supply. Historically, this reduction in supply has led to upward pressure on the price as demand remains relatively constant or increases.
Halving Anticipation: Many investors and traders anticipate Bitcoin halvings, and this anticipation can lead to increased interest and buying activity leading up to the event. The "buy the rumor, sell the news" phenomenon can contribute to price increases before the actual halving takes place.
Historical Patterns: In the past, Bitcoin has experienced price increases in the months leading up to and following a halving event. While this historical pattern doesn't guarantee future gains, some investors may use it as a basis for their investment decisions.

BTCUSD Support Rejection At $66208.53 14.06.2024BTCUSD support rejection at $66208.53 on 1hr chart.
If rejection holds:
Target $67025.48.
Break above $67025.48 targets $67668.23.
If rejection fails:
Target $65170.17.
Break below $65170.17 targets $63849.31.
Apply Risk Management
Risk Warning: Trading in CFDs is highly speculative and carries a high level of risk. It is possible to lose all of your invested capital. These products may not be suitable for everyone, and you should ensure that you fully understand the risks taking into consideration your investment objectives, level of experience, personal circumstances as well as personal resources. Speculate only with funds that you can afford to lose. Seek independent advice if necessary. Please refer to our Risk Disclosure.
BDSwiss is a trading name of BDS Markets and BDS Ltd.
BDS Markets is a company incorporated under the laws of the Republic of Mauritius and is authorized and regulated by the Financial Services Commission of Mauritius ( FSC ) under license number C116016172, address: 6th Floor, Tower 1, Nexteracom Building 72201 Ebene.
BDS Ltd is authorized and regulated by the Financial Services Authority Seychelles (FSA) under license number SD047, address: Suite 3, Global Village, Jivan’s Complex, Mont Fleuri, Mahe, Seychelles. Payment transactions are managed by BDS Markets (Registration number: 143350)
Disclaimer

BTC/USDTA butterfly spread involves buying and selling call options at three different strike prices. It's designed to profit from a moderate price move to the middle strike price while limiting potential losses. This strategy provides a balanced risk-reward profile, making it attractive for traders with specific market expectations.

btc how I think cycle will play out
for my own reference so won't explain much
x.com maybe just read this and think how that institutional money + ETH ETF trading starting fits into the chart
inshallah
PRE

$BTC Daily UpdateCRYPTOCAP:BTC back on $66,323 support currently testing it, Previous 1D closed with bearish engulfing if followed thru it might break $66,323 support, next key support $64,344, next support from here $65,521. RSI on 1D looks weak. Watch the support areas, must regain $68,546 support to retest $69,813. Watch given S/R

The speculative cup and handle is now valid and in playAfter the recent correction,the previous idea about this cup and handle (which I will link below) which described this pattern as purely speculative because we had not yet started to form a legitimate handle,is now no longer speculative as we have retraced enough and for enough daily candles to consider the current price action a handle even if it breaks above the rim line in jsut the next few days. There are still a couple speculative aspects to this chart. I went ahead and picked a random guesstimate for the length of the handle that I drew with the red trendlines. I tried to make it wider than it might actually be just to try to keep the price action inside its parameters as it develops…I also took its depth down to around the daily 50ma(in orange) it could go lower than that, or it could already have reached its lowest point, I felt doing so would be a nice middle ground for wherever it eventually finds its lowest point to be. Lastly where I placed the dotted green measured move line is also currently speculative…as always I just guesstimate an breakout point for the emasured move line until we have validated the breakdown then I go back an adjust the measured move line accordingly to get the most precise breakout target. Good news is where ever this thing eventually breaks out the target would be somewhere around 130k or higher. Now for the more bearish scenario, Iwent ahead and cloned the rimline of the cup and found that when I put it on the bottom and make a channel with it, there were enough pivotal candlestick touches on that line that not only is the cup and handle very valid so is the channel, this means should we somehow experience some sort of massive black swan, that it would be possible for price action to drop far enough to retest that bottom channel trendline and in turn nullify the cup and handle. This seems like a much lower probability than the cup and handle triggering its validation but it is indeed still a possibility…also, should it do something like that, and the channel becomes the more valid pattern, the breakout target of the channel would be roughly the exact same as whenever we were to break up and out of the cup and handle anyways, so to be honest, a retest of the bottom of the channel would actually be an even greater opportunity than if we just went ahead and broke up from the cup and handle itself because it would allow us to accumulate much more at a much lower price and the percentage of gains that could be made from all the way at the bottom of the channel to the final breakout target would be much higher. For now though I think just breaking up from the cup and handle is the much mroe probable outcome, but I am always ready for the less probable outcomes to occur as well. Really, in my opinion, no matter what happens in this situation, it’s a win win. *not financial advice*

long bitcoinTwo things need to happen. First continuously tiny volume to signify that the selling power if gone. Second, a group of straight, up, solid, green candles need to appear after the first signal to demonstrate the buying power can easily drive the market up. Manage the risk and good luck.

BTC Longterm Idea Hey hope this post can help you to see everything from another perspective. I did this chart already last year where the pencil drawing starts. Let me know what you can see here in this chart I am really suprised how well I read the market but I have to say I made no profit I was just not sticking to my strategy.

Analyzing Bitcoin's Weekly Trend: Potential Sell Opportunity DetBitcoin, the flagship cryptocurrency, continues to captivate the attention of investors worldwide. As of the latest weekly trend study, Bitcoin is trading at a price of $66554.74, reflecting a substantial increase of 35.01% above the midpoint of its 52-week range. This surge places Bitcoin squarely at the zenith of its 52-week range, a notable feat considering its volatile nature.
A closer look at technical indicators reveals an interesting picture. The Exponential Moving Average (EMA) with a 13-period stands proudly above the Simple Moving Average (SMA) with a 30-period. This alignment suggests a bullish sentiment prevailing in the market, potentially signaling further upward momentum in the short to medium term.
However, amidst this seemingly bullish scenario, a cautious signal emerges from our technical analysis. Our proprietary indicator has assigned Bitcoin a TA score of 2, indicating a moderate signal. This score, coupled with Bitcoin's position at the top of its 52-week range, raises a flag for potential overbought conditions. While the EMA/SMA crossover implies short to medium-term bullishness, the TA score underscores the need for prudence.
Despite the indications of a potential sell opportunity, prudent investors are advised to exercise patience and conduct further analysis on a lower time frame before executing any trades. Lower time frame analysis can provide valuable insights into short-term price movements, potential support and resistance levels, and confirmation of the sell signal detected by the TA score.
In conclusion, while Bitcoin's weekly trend study reveals promising signs of bullish momentum, the presence of potential overbought conditions warrants caution. Investors are encouraged to remain vigilant and leverage additional analysis tools to make informed decisions. By staying informed and adopting a disciplined approach, investors can navigate the dynamic landscape of cryptocurrency markets with confidence.
Disclaimer:
This content has been automatically generated by an AI system and should be used for entertainment purposes only. It should not be used for any other purpose, such as making financial decisions. The information provided may contain errors, inconsistencies, or outdated information. It is provided as-is without any warranties or guarantees of accuracy. We disclaim any liability for damages or losses resulting from the use or reliance on this content.

I still think we are going lower to the daily breaker FVG.Price has been nicely rejected in th order block and I think it will drop further to the Daily breaker / FVG confluence from where I would like to be bullish.
Always follow these rules
- Accumulation / Manipulation / Distribution
- No liquidity raid = No trade
- Never buy high and never sell low
“Adapt what is useful, reject what is useless, and add what is specifically your own.”
Dave FX Hunter ⚔
Follow me for daily updates

SYSTEM throws a sell signal on BTC , i believe itI have finished hardcoding the Signal system for the crypto assets, and it threw s a sell signal on btc, now btc was not supposed to be bearish at all this year but lets see

Crypto ready for a cookoff?Revisiting a weekly chart of a 9 symbol crypto mega cap index (BTC, ETH, XRP, ADA, DOGE, MATIC, SOL, DOT, LTC) one can't help but notice price resting on a shelf that was formed during momentum running deep into overbought territory. As the shelf is more or less flat for many months, we see momentum cooling into saner levels.
Price could continue to base out in what turns out to be a bullish flag, especially with the Nasdaq 100 ripping fresh records, inflation cooling, rate cuts likely etc... It's also a scary place to think about going long on crypto though as there's a big gap down to the major support level!

Spring Comes only after WinterNot Financial Advice.
The timing on a greater timescale could wrong but I believe in the predicted price movements

Still BULLISH on BTCStill bullish! I see BTC hitting a new ATH as the bullish flag formation is now broken signifying strong bullish sentiment. This move is being supported by the CPI and PPI numbers released this week which was bad for fiat and of course good for crypto.

Is Bitcoin back in the game? | Analysis Bitcoin's price rallied sharply after United States Consumer Price Index (CPI) data came in lower than forecast. The CPI data was unchanged from last month, and the year-on-year figure of 3.3% showed a slowdown from the previous pace of 3.4% — both 0.1% lower than forecast.
Bitcoin plummeted below the 20-day exponential moving average ($68,700) on June 11 but found support at the 50-day simple moving average ($65,982).
The bulls aggressively purchased the dip to the 50-day SMA and pushed the price above the 20-day EMA. This suggests that the BTC/USDT pair may oscillate inside the tight range between $66,500 and $72,000 for some time.
Buyers will have to catapult the price above the $72,000 to $73,777 resistance zone to seize control. That will open the gates for a rally to $80,000 and eventually to $88,000. On the downside, a slide below the 50-day SMA could start a downward move to $60,000.
WHITEBIT:BTCUSDT

BTCUSDTHere is a short #TrendAnalysis on #BTCUSDT. Watch the whole video to see what to do if you are in a trade. If you are not in a trade wait for it!

$BTC retest 0.5 fib level. Breaking?Hey there guyys!
Some update for BTC, we retested the 0.5 fib level in the 4th correctional wave.
But, according to volumes and my expectations to see full ABC corrections seems like we can test also 0.618 and from this level I will check the enter point. Also, there is summer, could also happen that we can go lower, so don't forget to use SL.
Your thoughts?
IMPORTANT! Always follow RM strategy. Don't take more than 5% risk. Happy trades!

One can dream, Bitcoin retest low/mid 60s then MarsCrazy year
Bitcoin bulls going on summer vacations
Can they return in time?


Bitcoin is at a Cross roads and MUST break a trend or loose High
One of the MAJOR things we look to in trading are TRENDS.
They give us patterns and Signals and the Longer a trend has existed, the stronger the "Suggestions" it can Give.
Bitcoin has been in a rising Trend since it hit a Low in 2011. From this point, it has been subject to rejection off a Fibonacci Spiral. ( I have explained this in detail in other posts, so I will not spend to much time on it now )
The ATH's of 2013, 2017 and 2021 all were rejected off that line.
What is VERY important to understand here is that a Spiral does not always rise...Once it reaches its apex, it will begin to descend again and that apex occurs around Feb 2025.
Bitcoin has to break out of this Trend with Positive momentum.
What is slightly concerning, is that PA is up high, near that line of rejection already.
This RSI chart shows us that we do still have room on the RSI to go higher. The Vertical lines are the previous ATH's and where RSI was at that point. IT is the lower time frames that are currently cooling off but the weekly MACD, for instance, It still high and Just turning Bearish....We have 8 months for it to cool down to neutral or lower and it should manage that.
Something that has also really crossed my mind is the Volume since 2011.
"The Volume indicator is used to measure how much of a given financial asset has traded in a specific period of time. For example, with stocks, volume is measured by the traded shares. For futures, volume is based more on the number of contracts. By looking at volume patterns over time, traders can better understand the strengths of advances and declines in stocks as well as in markets in general." ( taken from Trading View )
What we are looking at there is a STRONG BEARISH DIVERGENCE.
But do not worry, BTC has, in its history, had a remarkable habit of defeating this type of thing while in a Bullish state, as it is now.
But it HAS to break this trend and get out and Above that upper line.
I have little doubt that Bitcoin can break this trend. But as we move into the corporate World, things will change for all of us in Bitcoin's world now.
For instance, that drop in Volume .... The Asset was able to be traded in higher volumes when you could buy 1000 Bitcoin for the price of a Beer.
It is a little harder to do now.
And People are "Betting" on BTC via ETF now and not directly Buying and these large Corporations will begin manipulating the price...
WE NEED TO HOLD OUT BITCOIN CLOSE = NEVER SELL -
The other indicators in the original image are, from top to bottom,
VOLUME
RSI
SOPR
MVRV Z Score
ATR
On a final note. This chart is from Bitstamp, the Exchange that ROBINHOOD just bought. That is one of th elarger financial corporations in the USA...they would not have just bought this exchange if there was a chance of collapse........But......always best to be aware of potential

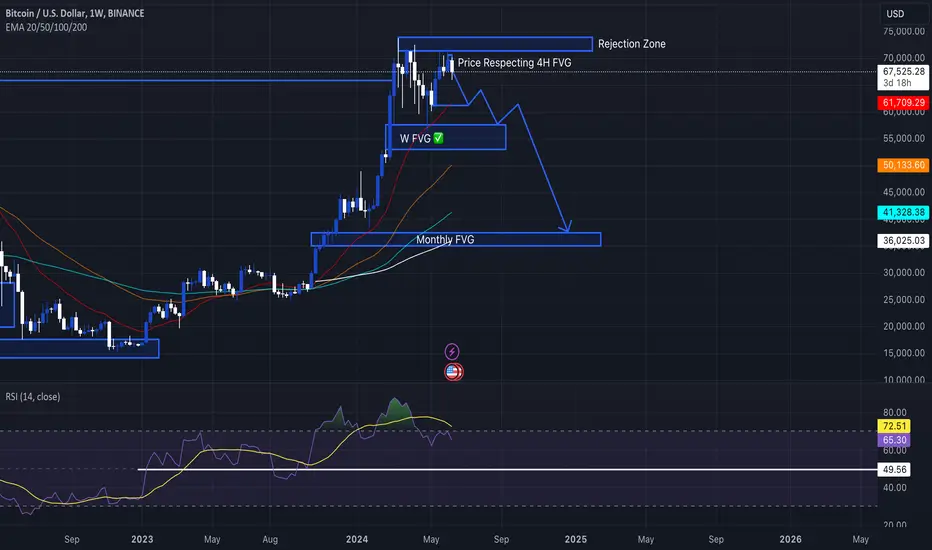
BTCUSD Short Prediction Using Fair Value Gap and Rejection ZoneClear Analysis On Chart.
I am a Beginner and I am just documenting my journey and trying to learn from my Mistakes.
Do Point out my mistakes and your thoughts. Appreciate experienced Opinions :)
As a man thinketh, so he is.