PullbackLast time was not the time. This time is the time for a pullback. We reached ATHs, time for a small breather before going wild. Unless we reach 71k.
BEARUSD trade ideas

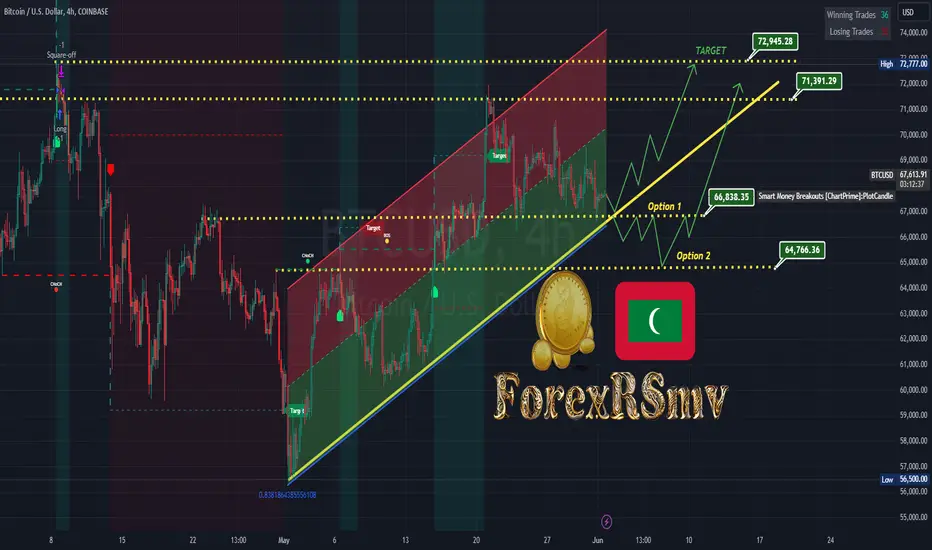
BTCUSD IDEAThe price is still in consolidation.
Now we need to watch for the reaction to the mentioned area :-
(66838-66000-64766 Support ).
If the bulls hold, then the price will head towards the resistance. But, most likely, the market has not yet accumulated the proper potential and the price may go deeper and test the support at 64500 before going up.
But, there is no talk about a crash or a global fall now.
BITCOIN - TIME TO BUY?$2.5 Billion In Bitcoin Withdrawn From Centralized Exchanges – A Bullish Signal?
Investor confidence in the crypto market is rising, and Bitcoin is reaping the benefits. Large-scale investors are accumulating BTC despite its recent price fluctuations.
In May, Bitcoin's price failed to stay above the critical $70,000 mark, even though it briefly touched this level twice in the last two weeks. However, recent on-chain data shows growing faith in Bitcoin.
Is BTC Ready for a Price Rally?
Prominent crypto analyst Ali Martinez highlighted a significant outflow of Bitcoin from centralized exchanges in a recent post on the X platform. This observation is based on the CryptoQuant Exchange Reserve metric, which tracks the amount of a specific cryptocurrency held in centralized exchange wallets.
An increase in this metric indicates more deposits than withdrawals of Bitcoin into exchanges, whereas a decrease implies more withdrawals than deposits.
Martinez reported that over 37,000 BTC, worth approximately $2.53 billion, have been withdrawn from exchanges in the past three days. This significant outflow signals a shift in sentiment and suggests that investors are increasingly opting to hold Bitcoin in self-custodial wallets for the long term.
While the exact reasons for this massive outflow are unclear, the movement of funds away from exchanges points to increased investor confidence in Bitcoin's future. This shift could lead to a supply crunch, a situation where demand exceeds supply, potentially driving up Bitcoin's price.
Bitcoin Price Overview
As of now, Bitcoin is priced around $67,489, showing a 1.5% decline in the past 24 hours. Despite this, the ongoing reduction of BTC on exchanges might set the stage for a bullish rally, especially if the supply crunch materializes.

#BTC On Support Cloud + Bullish divergence#BTC On Support Cloud + Bullish divergence
I expecting Next week we will go to 73k
Waiting for Monday Bullish Power.

Bitcoin will cross 134,000My this Chart was Published on eToro few years ago, from now I will be publishing on both platform. This Chart is Update Version . So follow this Chart.
Bitcoin will cross 134,000 in next few MONTHS , I dont think its good idea to Exit from the Market now , instead wait .

Bitcoin will cross 134,000Bitcoin will cross 134,000 in next few MONTHS , I dont think its good idea to Exit from the Market now , instead wait .

btc tight range ,chasing the short of the price rangeBTCUSD is playing the accumulation range, watch closely on this idea and how to short this zone to take profit at the bottom 60 k arround!

BTCUSD massive short signals appearbtcusd is trading at the price of67634 today, new month and new week has got triggered some of the strongest sell signals , could this be 32k incomming ,or we could stay in this accumulation zone untill beginning of the bussiness week

Possible movement for BitcoinPossible breakout and support levels to devise trading strategies.
Note: this is not financial advice. kindly do your independent research and analysis before making financial decisions.

BTCUSD Bitcoin / US Dollar Bearish Side Money Heist PlanMy Dear Robbers / Traders,
This is our master plan to Heist BTCUSD Market based on Thief Trading style Technical Analysis.. kindly please follow the plan I have mentioned in the chart. Our target is Green Zone that is High risk Dangerous level MA act as a Dynamic Support & Order Block, So the Market is oversold / Consolidation / Trend Reversal at the level Bullish Robbers / Traders gain the strength. Be safe and be careful and Be rich.
Note: Day traders & Scalpers If you've got a lot of money you can get out right away otherwise you can join with a swing trade robbers and continue the heist plan,
Loot and escape on the target 🎯 Swing Traders Plz Book the partial sum of money Use Trailing Stop To Protect Looted Money and wait for next breakout of dynamic level / Order Block, Once it is cleared we can continue our heist plan to next new target it will update after the Breakouts.
support our robbery plan we can easily make money & take money 💰💵 Join your hands with US. Loot Everything in this market everyday.

BTC. Weekly trading levels 27.05.2024 - 2.06.2024During the week you can trade from these price levels. Finding the entry point into a transaction and its support is up to you, depending on your trading style and the development of the situation. Zones show preferred price ranges WHERE to look for an entry point into a trade.
If you expect any medium-term price movements, then most likely they will start from one of the zones.
Levels are valid for a week, the date is in the title. Next week I will adjust the levels based on new data and publish a new post.
! Please note that brokers have a difference in quotes, take this into account when trading.
The history of level development can be seen in my previous posts. They cannot be edited or deleted. Everything is fair. :)
----------------------------------------------
I don’t play guess the direction (that’s why there are no directional arrows), but zones (levels) are used for trading. We wait for the zone to approach, watch the reaction, and enter the trade.
Levels are drawn based on volumes and data from the CME. They are used as areas of interest for trading. Traded as classic support/resistance levels. We see the reaction to the rebound, we trade the rebound. We see a breakout and continue to trade on a rollback to the level. The worst option is if we revolve around the zone in a flat.
Do not reverse the market at every level; if there is a trend movement, consider it as an opportunity to continue the movement. Until the price has drawn a reversal pattern.
Don't forget to like Rocket and Subscribe!!! Feedback is very important to me!

Bitcoin Monthly Bullish ScenarioHello everyone. Did some preliminary work on BTC today. I will update with more details explaining my technical analysis.
Preliminary observation : Maintain of bullish scenario. However, original and modified schiff structures lost in 2018. Good news, current must zone to hold is upwards of 20, 30k so prices under these levels jeopardize this analysis.

#BTC/USDT ANALYSIS Bitcoin is currently trading within a descen#BTC/USDT ANALYSIS
Bitcoin is currently trading within a descending triangle pattern. It is rebounding from the horizontal support zone of the triangle, with the 100-day moving average acting as resistance.
A breakdown below the support zone would indicate a bearish trend, while a breakout above the triangle would suggest a bullish trend in the crypto market. Stay tuned for further updates.

Bitcoin - Weekly Forecast - 03 June 2024My weekly forecast of Bitcoin for the week of 03 June 2024.
I see Bitcoin going lower to take out some liquidity and close an inefficiency (FVG) lower.
That would then see us have a break in structure to the downside, so then looking for lower lows in the months ahead.
There is a video that accompanies this image as well.

Bitcoin - Weekly Forecast - 03 June 2024My weekly forecast of bitcoin for the week of 03 June 2024.
I see bitcoin going lower to take out some liquidity and close an inefficiency (FVG) lower.
That would then see us have a break in structure to the down side, so then looking for lower lows in the months ahead.

BTCUSD 1MBTC ~ 1M
#BTC on Monthly Time Frame BITSTAMP:BTCUSD Looks very good. The retest of the support line has been successful.
Our short term target is $80,000
Our long term target is +$100,000

BITCOIN - BTC/USD 4h Technical analysisThe basic trend is bullish on BITCOIN - BTC/USD and in the short term, the price is attempting to correct. For the time being, this is only a simple technical correction and the basic trend is not threatened. For the correction to be confirmed, it would have to at least return to below the support 68,657.99 USD. Sellers would then use the next support located at 68,034.78 USD as an objective. Crossing it would then enable sellers to target 67,566.93 USD. If there is a return to above the resistance located at 69,749.05 USD, this would be a sign of a reversal in the basic bullish trend. The next bullish objectives will be 70,216.90 USD and 70,840.11 USD by extension.

Double Top/Double Bottom/Triangle Duplicate idea 3 to show smart money movements. Double top downtrend rejection but later made its move to a fall creating a double bottom. Short position belong to hidden double top.
Smart money green and red trendlines; all I did was retrace and applied to chart which are areas where smart money revisits.
Reads triangle, hoping for a breakout which consists with double bottom.
FYI: since double top is complete; trend may go sideways or make its way up. Hidden double tops have gone down as low as 2.29%. Target is at 2%.

BTCUSD Daily Rising Narrowing WedgeBTC/USD on the Daily
BTC is moving inside a rising wedge with a support that goes back to October of 2023. Rising wedges have a bearish bias.
If the rising support fails to hold, the 50/100 SMA area will likely get a test, and possible the 200 SMA, both of which coincide with major order blocks.
First order block lines up with the .236 fib retracement level.
Second order block lines up with the .382 fib retracement level.
I don't think this move is worth a play in either direction, so this idea is neutral. Just sharing for the sake of sharing.
NFA
Do your own DD

BTCUSD M30 FORCAST
Hey team Hope you are Enjoying our ideas and Analysis, Today we are monitoring BTCUSD Looking for Bullish Because That Running in a Trend line That we have Mentioned Already in Chart Pattern,
Reason :
-Bullish TRENDLINE
-Support TRENDLINE
-Resistance Area Follow
-Supply Zone
-Continuosly Bearish

BTC Double TopThe charts are showing us a double top on the weekly. We've had divergence on the daily, and now we are finally breaking down. We have a weekly level at 52K and a Monthly level at 42K. This is where I would be looking to rebuy in on a bounce until we confirm we have made a base of support to build and go higher. Don't HODL, take your profits and look for the next trade! Best of luck to you all.
Comment: **disclaimer- anything mentioned in this forum is for information & educational purposes only and does not constitute investment advice. please talk to your investment advisor and do additional research and due diligence on your own before investing and making important investment decisions.- disclaimer**

ZOOMED IN Triangle Breakout Zoomed in to show you this idea as an update form its original idea. should and shows to finally work its course. Tried to make as clear as possible. You can compare and shows the same.

BITCOIN CONSOLIDATION PATTERN POINTING PRICE TO $80 T0 $90K.Here's my analysis of the pattern:
A - This region marks a consolidation phase where the price moves within a narrow range before breaking out to the upside. The horizontal blue line likely represents the resistance level of this consolidation phase, which the price breaks above.
B - Similar to region A, this appears to be another consolidation phase with the price eventually breaking above the blue horizontal line, indicating a breakout and continuation of the upward trend.
C - This region again shows a consolidation pattern, followed by a breakout above the blue horizontal line. The pattern of consolidation followed by an upward breakout continues here.
D - This region is marked with another consolidation phase. The chart suggests that the price is consolidating around the blue horizontal line, possibly preparing for another move. Given the previous patterns, this might indicate a potential for another breakout, although it’s important to note that past performance is not indicative of future results.
The overall pattern suggests a series of consolidation phases followed by breakouts to higher levels. This stair-step pattern is often indicative of a strong uptrend where the price moves up, consolidates, and then continues to move up after breaking out of the consolidation phase.
Analyzing the Pattern
1. Consistent Growth:
The average is 25% and it suggest a strong and steady bullish trend. This can be indicative of significant buying pressure and positive market sentiment.
2, Breakout Analysis:
A to B: After consolidation at A, the price pumps by approximately 25% before reaching a new consolidation phase.
B to C: Following a similar pattern, the price again increases by around 25% after breaking out from B.
C to D: The same 25% increase is observed after the breakout from C.
3. Future Projections:
If the pattern holds, one might anticipate a similar breakout from the current consolidation phase around D, potentially leading to another 25% average increase in the price. However, it’s crucial to combine this with other technical indicators and market conditions for a more robust prediction.
Potential Next Steps
1.Watch for Breakout Signs:
Look for signs of breakout from the current consolidation phase at D. Indicators such as increased trading volume, bullish candlestick patterns, and moving averages can provide confirmation.
2.Technical Indicators:
Use additional technical indicators to confirm the strength of the breakout.
3. Market Sentiment:
Keep an eye on overall market sentiment and news that could impact Bitcoin’s price. Positive news could reinforce the bullish trend, while negative news might hinder the pattern.
4.Monitor Consolidation Breakout:
Keep an eye on signs of a breakout from the current consolidation phase at D. Indicators like increased volume, bullish candlestick patterns, or moving average crossovers can provide confirmation.
Final:
The chart shows a consistent pattern of upward momentum following consolidation phases, with an average pump of 25%. If this pattern continues, Bitcoin might reach the projected targets of $83,000 and $90,000. However, it is essential to consider market conditions, other technical indicators, and news events that might impact Bitcoin's price to make informed trading decisions.
