BTCUSD - CUP AND HANDLE WEEKLY CHARTThis chart is only for educational purpose and it is not a recommendation for trading.
This study is only based on past chart patterns which have been studied by various technical analyst.
BEARUSD trade ideas

Bitcoin in the short and medium termBitcoin in the short and medium term:
According to the previous analysis, Bitcoin stopped at $56,500 before reaching $52,000 on May 1st, and the second wave of the previous analysis has started from this point.
This analysis shows the continuation of the path in more detail. Based on this analysis, this week we will see the price of Bitcoin drop to $58,000 and then within the next two weeks, Bitcoin will grow to the price range of $70,000.
As you can see in the chart, after that Bitcoin has a heavier fall ahead and will fall to the $27,000 range in the coming months.
@JalilRafieefard
May 14, 2024

BTC BEARISH MOVEBTC is making a bearish pattern . head and shoulder and retraced from 0.786 level and next tp is lows

BTCUSD BUYI believe BTCUSD is about to buy and take the liquidity all the way till the 62260 area. A good SL may be around 60100 with a TP of 62200 and 62600.
A good entry is around 60400 - 60550

The amazing BTC and the secret of 152 & 52 weeks.🤔Here's an intriguing take on BTC and the potential significance of the 152 (Bulls) & 52 (Bears) week cycles:
🔑 BTC: Unlocking the Secrets of the 152 (Bulls) & 52 (Bears) Weeks 🗝️
Throughout BTC's history, a fascinating pattern has emerged – the alternation between 152-week bull cycles and 52-week bear cycles. 📈📉
This cyclical behavior has been observed multiple times, leading to the tantalizing question: Will history repeat itself once again? 🔄
My answer: Yes, I think the stars are aligning for another cosmic dance between the bulls and bears. 🐂🐻
If this pattern holds true, we are potentially witnessing a new 152-week bull run started in 7 Nov 2022 till the top around 6 October 2025, followed by a 52-week bear hibernation, and the cycle continues. ∞
However, as with all things crypto, nothing is set in stone, and the market is known for its unpredictability. 📊🔮
Nonetheless, for those who believe in the power of historical cycles, the 152 (Bulls) & 52 (Bears) weeks could serve as a fascinating guide, offering insights into potential market movements. 🧭
It is not a financial idea.
PLZ DYOR.
Good Luck.

Potential Bitcoin Long on Weekly Stochastic RSI CrossoverBitcoin, the world's leading cryptocurrency, has experienced a volatile period in recent months. However, a technical indicator on the weekly timeframe is sparking potential buying opportunities for long-term investors. This indicator is the Stochastic RSI, and a recent or upcoming bullish crossover could signal a reversal in the downtrend.
Understanding the Stochastic RSI
The Stochastic RSI (Stochastic Relative Strength Index) is a technical momentum indicator that oscillates between 0 and 100. It measures the closing price of an asset relative to its price range over a specific period. In simpler terms, it indicates whether the asset is currently trading near the highs or lows of its recent price range.
The Stochastic RSI consists of two lines: %K and %D. The %K line is the faster-moving average of the RSI, while the %D line is a slower-moving average of %K. A bullish crossover occurs when the %K line crosses above the %D line, suggesting a potential reversal from oversold conditions and a possible upswing in price.
Why a Weekly Stochastic RSI Crossover Matters
The weekly timeframe provides a broader perspective on price movements compared to daily or hourly charts. A bullish crossover on the weekly Stochastic RSI suggests a shift in momentum that could hold more weight than on shorter timeframes. This crossover can indicate that oversold conditions have been exhausted, and buyers are starting to take control.
Current Bitcoin Situation and the Stochastic RSI
By analyzing historical charts, we can see that the weekly Stochastic RSI for Bitcoin has fluctuated between oversold and overbought territories throughout its history. In previous instances, bullish crossovers on the weekly timeframe often coincided with periods of price accumulation and subsequent price increases.
Is a Bullish Crossover Imminent?
While it's impossible to predict the future with certainty, a potential bullish crossover on the weekly Stochastic RSI for Bitcoin is an interesting development to watch. If the crossover materializes and is accompanied by other positive indicators, it could signal a buying opportunity for long-term investors.
Important Considerations Before Going Long on Bitcoin
• Market Volatility: The cryptocurrency market remains highly volatile. Even with a bullish technical indicator, there's no guarantee of a sustained price increase.
• Fundamental Analysis: Don't rely solely on technical indicators. Consider fundamental factors like regulations, adoption rates, and overall market sentiment when making investment decisions.
• Risk Management: Always implement proper risk management strategies, such as stop-loss orders, to limit potential losses. Bitcoin is a high-risk investment, and investors should only allocate a portion of their portfolio that they can afford to lose.
Conclusion
A potential bullish crossover on the weekly Stochastic RSI for Bitcoin presents a glimmer of hope for long-term investors. However, it's crucial to remember that technical indicators are just one piece of the puzzle. A comprehensive investment strategy should also consider fundamental analysis and proper risk management. While the future remains uncertain, this technical development is worth keeping an eye on as Bitcoin continues to navigate a volatile market.

Short to a longWaiting for price to hit resistance than drop off to a buy for 1000 pip move. 1000 pips a week keeps the 9-5 away

BITCOIN $80,000 by the end of this monthBTCUSD is neutral on its 1D technical outlook (RSI = 49.966, MACD = -901.100, ADX = 24.861) as it is trading inside the 1D MA50 and 1D MA100. This squeeze is taking place while the Inverse H&S is forming its Right Shoulder. The 1D RSI is trading over the MA level, which is the same price action as the Inverse H&S of January. If it crosses over the 1D MA50 (Resistance since April 13th) we will target the 2.0 Fibonacci extension (TP = 80,000).
## If you like our free content follow our profile to get more daily ideas. ##
## Comments and likes are greatly appreciated. ##


BTCUSD/continued update 11Bears will dominate still, but not too far. The analysis is from a system called D waves. This is not financial advice.

Smart money trend-lines, they follow their own pattern3 possible price ranges. I won’t say if price will actually get there: this will most likely be a BULL TRAP. View red trend-lines created by smart money manipulation: realize they move according to the red trend-lines.
They have disregarded their ORDER BLOCKS and pattens. Thats because of the BEAR 2MO TF.
Please, I will not expect miracles.
GETTEX:59K is likely to happen. I can’t say, no one knows but BULL TRAP in process.
Soon I’ll get a SELL SIGNAL. I will update.
There’s a red trend-line above the trending blue wave. As they might move up to it, then white trend-line is their hidden double bottom trend guidance move along to the upper side.
Likely to happen: let’s see how it plays out.
I will be creating short price range ideas during this 2MO TF.
Once it reaches the white trend-line; this would be a sell signal once the trend falls below it otherwise I’m not waiting for my sell signal.
Red trend-lines have been created by smart money movements: I traced over them from my analysis.
Do not consider what I say as entry or exit, it’s intended for my own personal use, price predictions, and entertainment.

Bitcoin probably going to 43KBitcoin is probably going down to 43K at least, because it took top liquidity, and because of the financial crisis in the world. Just a quick opinion nothing else.
This is not a trading or investing advice. Trade and invest at your own responsiblity.

BTCUSD - New heavens ?I said 2 things earlier but I changed my mind a bit
- the first thing was that I wanted to wait on Monday to do a new post because of the geopolitical situation and the halving, what happened last night convinced me that the floor was here (of course I can be 100% wrong)
- second thing is that from my last post, I said we could chill some months because nothing would happen, it still can be true but the situation looks familiar and this rebound just before the halving is kinda interesting, also summer is only in 2 months.
So, for the little time frame, we are sitting under the 1H 200MA which is about to likely be break (or maybe is already it took me times to write this)
I'm saying this situation looks familiar because the floor at the 0.786 fib which has been made during the past month is very similar to the one from Jan 2021 to June 2021(maybe not on the daily but if you zoom in you'll see it maybe)
You can note the big uptrend going on after this, not saying that we will see the same but from that pattern recognition, and knowing that it works well here, I think we're heading to the new ATH : 100K, a big psychological resistance + a line resistance made from the past highs in 2021
Also this is interesting to notice that this new floor is at the past first ATH made in March 2021
Till this new ATH I don't really see any other paths that could happen (or maybe I refuse to see them, also I don't know about the time it will make)
But then, here are the 2 scenarios I drew :
- Pink : We go super fast too 125k, 20% retrace rule to 100K while chilling during the summer and we go back to new highs from fall 2024/January 2025
- Green : We go a bit slower doing a retrace of 20% at 100 and 125K (or, in this scenario, not doing at retrace at 125K is possible)
I think those 125K and 100K are very important levels (that still can be drilled tho) for several reasons, the most important one is about the patterns BTC did the past cycles.
Concerning this pattern, it is very likely that we are going to go up till the beginning of Summer, then we might see some months of sunny holidays to retrace and we will be back for 1 year of this famous bull run that might start mid fall 2024/early January 2025
Cheers good luck,

BTC BULL RUN CONTINUE💥Traders! Last 2 bull runs continue more than 1000 days. It will take at least 500 days to take BTC to new top. Enjoy😊

BTC AMD MODELBTC price accumulated a range. Om the orange circle we see price selling aggressively and buying back the orders leaving imbalance. We have an entry on 4 hr timeframe for the Bullish setup. But also keep in mind the internal supply zone that might affect price. Goodluck

Bitcoin (BTC): Candles Are Closing at Lower ZonesAnother week is here, and we are yet back with Bitcoin, still trading in those "cursed zones" of upper resistance and our entry line.
While last week closed nicely in red with almost no wick, we see that the new weekly is pushing, but we are not very optimistic for that push!!
Our gameplan is still the same, where we wait for our entry zone to be broken so that movement to lower zones can start!
Swallow Team

Bitcoin investment must, this week's important events
This week's macro events of general importance, mainly the CPI news is striking, Bowman just mentioned last week that there is no expectation of a rate cut this year, this week's speech is therefore worth paying more attention to. At present, rate cuts seem to be becoming distant, some economies have even begun to study the continuation of interest rate hikes, the status quo of tight market funding will continue. There are no relevant events in the cryptocurrency world that are enough to affect the market, but the FTX claim and multiple hearings are worth paying attention to, and cryptocurrencies have been weaker recently, especially the cottage coins represented by ETH.
🌟 Heavyweight events this week:
Tuesday 5/14 *
📢 Fed Chair Powell and ECB Governing Councilor Nauert attend a conference together
📝 OpenAI launch event
💼 Judicial outcome for Tornado Cash developers and Samourai Wallet co-creators
Wednesday 5/15 ***
💼U.S. CPI for April
💼 U.S. retail sales data for April
💼 FTX opens claims window
5/16 Thursday **
💼 Fed Governor Bowman delivers remarks
💼 U.S. initial jobless claims for the week
5/17 Friday *
💼 Speech by several FOMC Voters
📌 Crypto Market Outlook:
The entire cryptocurrency market has had two consecutive weeks of V-reversals and a significant drop in volatility.Dvol has bounced back, with short and intermediate term IVs now down to the 50% line, which is significantly below average. Low IV in major term options is an opportunity for buyers, and in the short term it can be cost effective to choose a term and price with lower IV and continue to buy options.
💼 On the crypto rate market, Bitfinex spot big players continue to keep bottoming out, the green leaf rate market can often be encountered with 20% annualized interest rate orders, encountering the right interest rate orders can be actively transacted, and the use of high-interest mode may be a surprise.

BTCUSD What Next? BUY!
My dear friends,
My technical analysis for BTCUSD is below:
The market is trading on 61092 pivot level.
Bias - Bullish
Technical Indicators: Both Super Trend & Pivot HL indicate a highly probable Bullish continuation.
Target - 62771
Recommended Stop Loss - 59852
About Used Indicators:
A pivot point is a technical analysis indicator, or calculations, used to determine the overall trend of the market over different time frames.
———————————
WISH YOU ALL LUCK

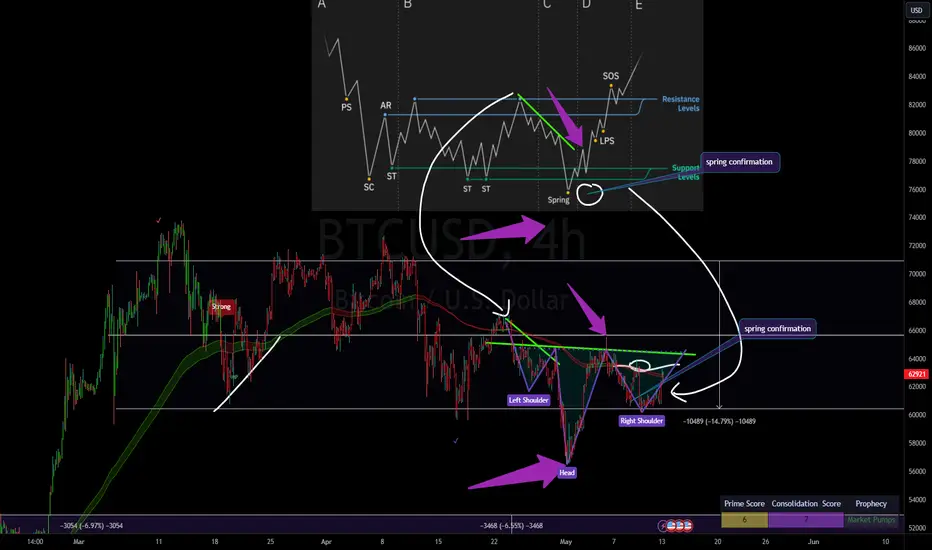
Wyckoff range in BTC 4 hours that could define the huge C&HWe have been following on a Wyckoff range. If we can define the spring, we could get a higher percentage of getting to the top of the range, and also have a break out on the cup and Hnadle from Daily
BTCUSD to 32.000 usdWhy I am bearish on BTC?
I think we are at the top of this cycle and during this year we will touch 36.000 usd.
RSI is coming out of of the estimated area and It will drop to 50 or maybe more down.

BTCUSDT Trade for longBTCUSDT will start a bull run for all time high expected to break the resistance,


Bitcoin massive bullrun incoming!!!If historical patterns serve as a guide, we consistently observe the formation of a rounding bottom pattern on BTC preceding each bull run.
Presently, it appears we are on the brink of significant BTC movements this year. Notably, a critical support level indicated on the chart stands at 59k, extrapolated from historical data.
The target for the rounding bottom formation is distinctly delineated on the chart. This post will be continuously updated in a timely manner.
Do share your insights regarding this pattern.
