American inside week month and bullish engulfing those are showing up on my scanner today. I still think that my last post still stands. Can this stock continue growing? It’s scary but watch AXP
AXP trade ideas


American Express - Looking for more downsideCould go either way here, but i am swaying to the short side more than long! I will come back to this Monday
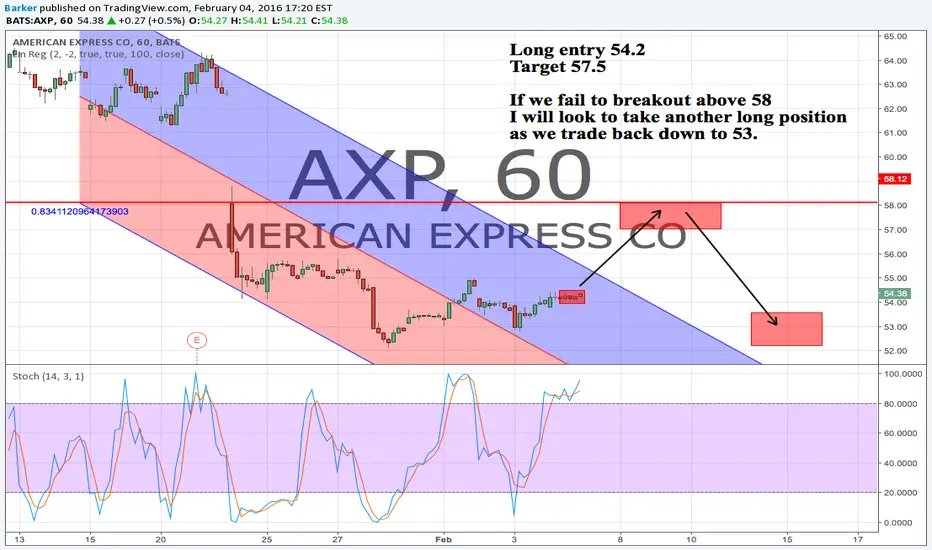
Target 59-58.30 area
Edit to add: I love this VPVR Indicator. Great visual

American Express The weekly chart looks pretty interesting to watch for a move from Friday’s close that would be 14.07%. Keep in mind that this stock took a hit within 3 months. American Express is trying to make it back up above $74.76. I think that American Express will recover with 51 days when earnings reporting. The month started off in green a little resistance within the triangle. I think $80 is a good buy.


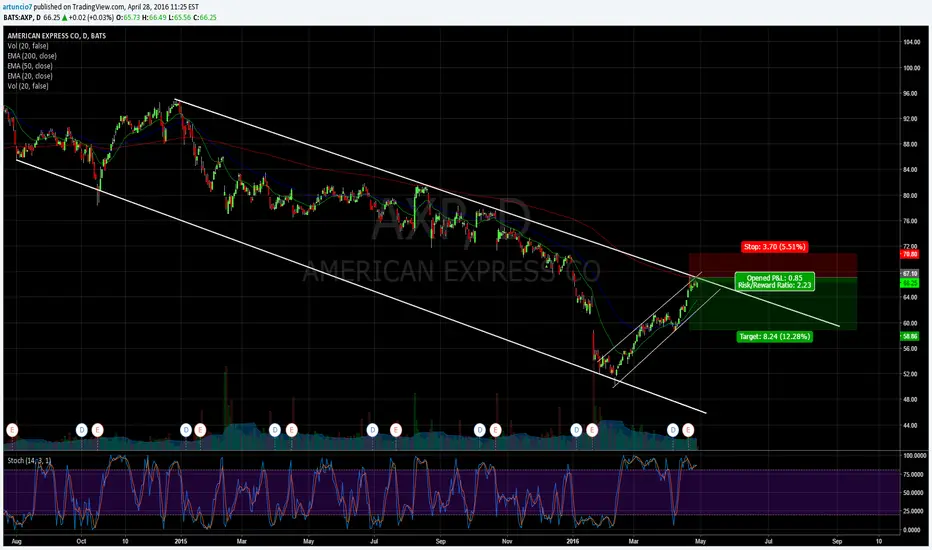
American Express (AXP)Long AXP if it trades at 66.00 or higher. If triggered, place your stop at 63.69 and exit the position for a profit at 71.50 or at your own discretion.

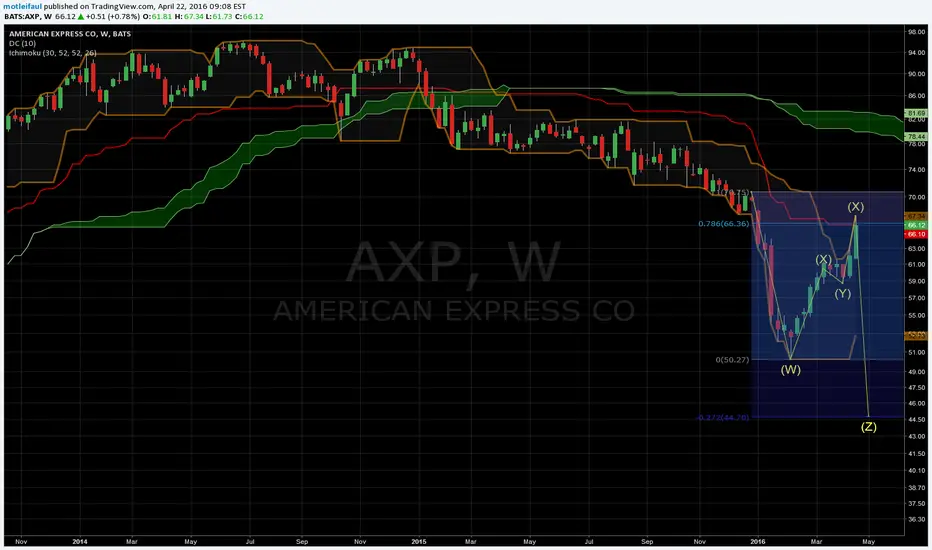
Retest doneWe were coming from 95 $ in late 2014. Now we see an attempt to retest the highs of at least December 2015. The overall trend is down. If this backtest fails we may see a sharp fall.
$AXPLooks like interesting short. Stochastics on 1H chart are bearish also you can see topping pattern
AXP - weekly chart target almost reached.Caution is warranted for bulls, as the rebound in AXP has taken price almost to its first major target. Earnings were a positive surprise, but - as with all financials - we still have to watch if this is real buying or just a counter-trend rally.


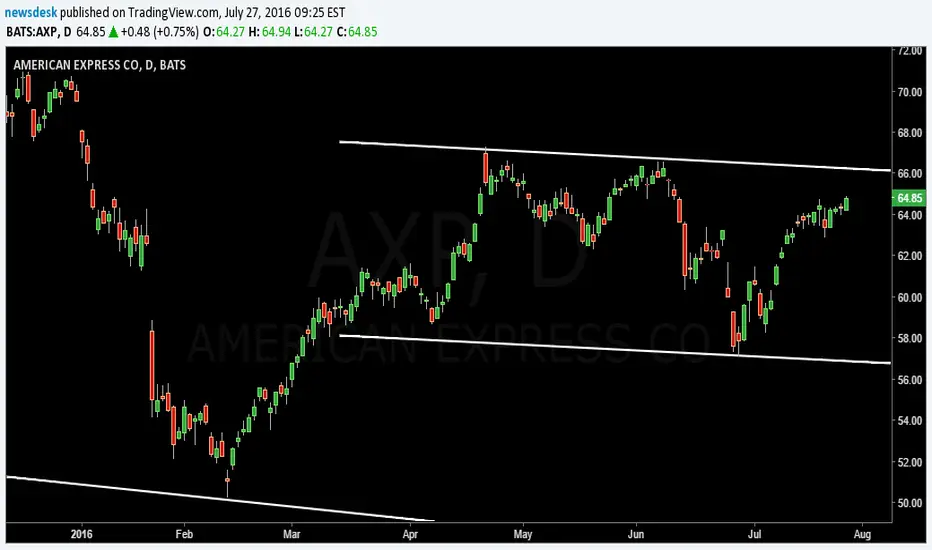
AXP - American Express finding support.Depending on the general market, further recovery in AXP off support at 52.00 USD could take it back to 65.00 and 67.43. Should we see declines in Indices I expect a sideways price behaviour in AXP, but as long as 52.00 USD holds I will be cautiously bullish.

Buy the consumer credit dip AXP and Vfibs 50 % and monthly SMA should hold around here for longer term entry, smaller size due to stop far


DOW JONES OVERVIEW: AMERICAN EXPRESS RISKS TO TAG 5-YEAR MEANAmerican Express has fallen below 1st standard devations from quarterly (66-day) and yearly (264-day) means, thus entering short term downtrend
Price is also trading within 1-st standard deviation from 10-year (520-week) and 5-year (260-week) moving averages, meaning that it is in lateral trend on long term basis
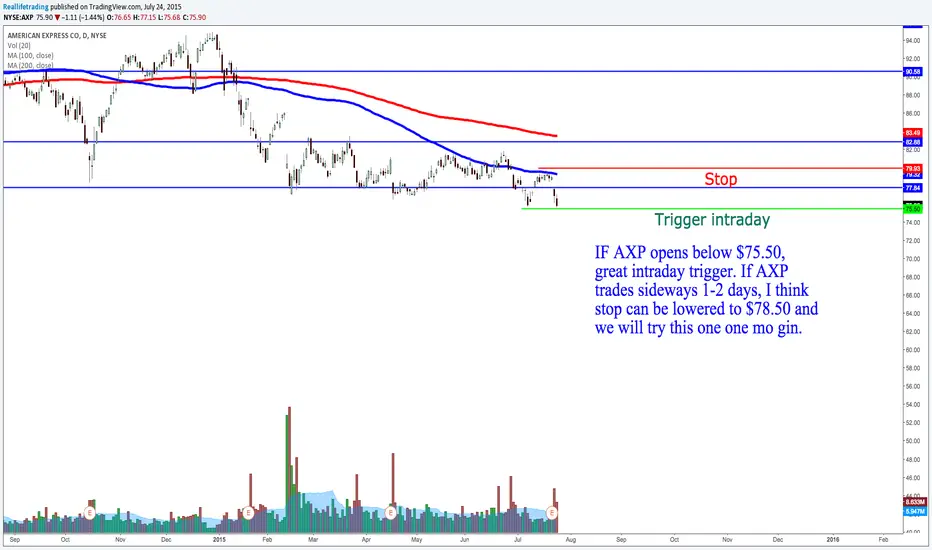
If the short term downtrend holds (price trading below 76.4-77.1 levels), there is a high probability to tag 5-year mean at 75 level
Scenario is canceled, if price returns to trend on 10-year basis by spiking above 1st standard deviations from 10-year mean (above 80)

(Live test) - Steve Primo #4 Setups - (Day 3)AXP, SLB, KO, CVX
- A good mix showing short. - No Long Setup

AXP - Topping. Or not?Nope, probably not.
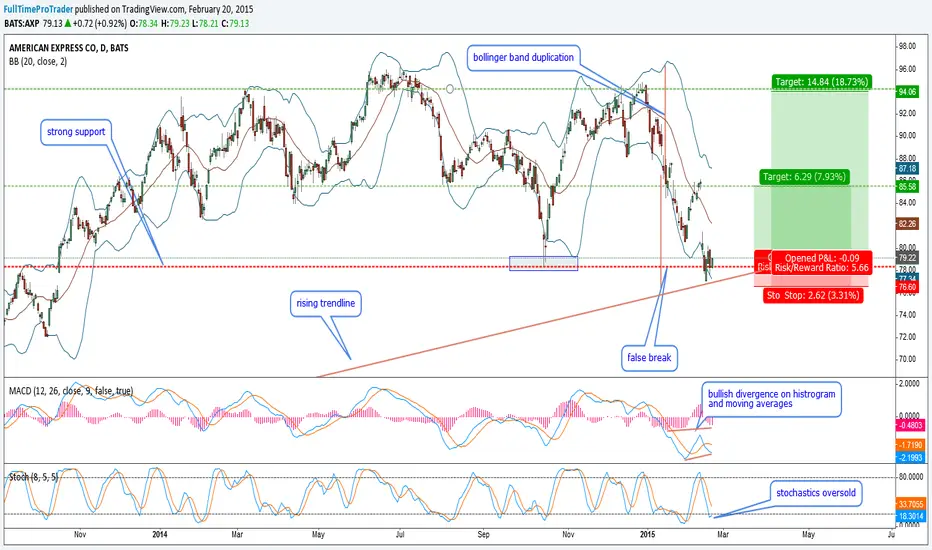
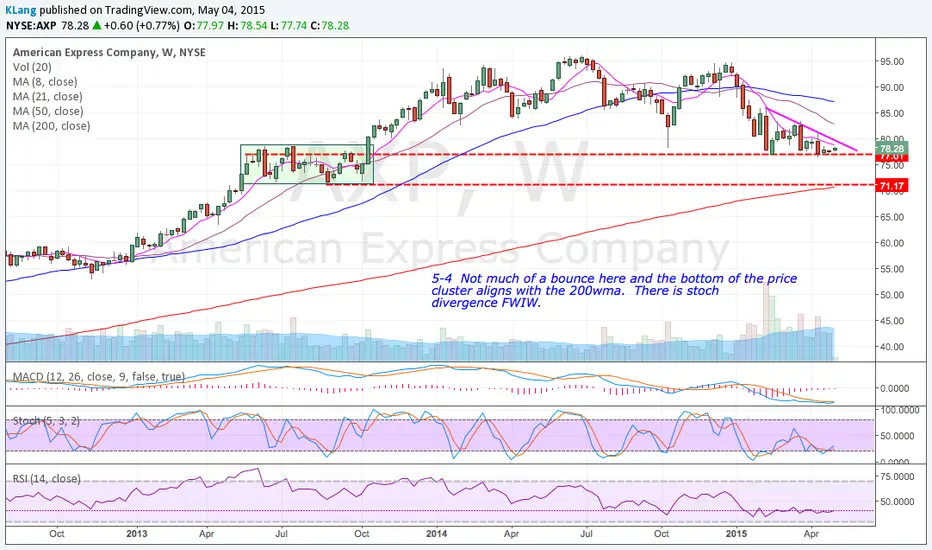
The weekly chart on the left shows a nasty topping pattern, a weird H&S. However, the bearish picture is not sustainable, as the indicators are very oversold, while we are still in an uptrend. Climatic action on the Force Index, climactic volume for the previous week on the volume bar. Price also stands at an important support area, and the breakdown proved false. Until I wont see a clear downtrend, oversold indicators are a buying opportunity. The current oversold condition is not sustainable, and rallies are likely. The impulse is still red.
Now, looking at the daily, the picture is similar, but here there is more information that the sell-off is over. Price made a false breakdown (as outlined also on the weekly) below strong support. What is even more interesting about this is that the breakdown proved false on a Monday, after a gap down, after a bearish Friday. This is one of the best triggers I know (trigger identified by Gary Smith). Further down, there are confirmed bullish divergences on the MACD lines and histogram. The Force Index is extremely oversold and has now climbed back inside the channel, while the volume on the Weis Wave is climactic.
Look for 93$.

AXP-false breakA classic false break setup.
The fundamental information supports a bullish bias from here.
We have the w1 chart bullish also:
Fundamental review:
***************************
"We rate AMERICAN EXPRESS CO (AXP) a BUY. This is based on the convergence of positive investment measures, which should help this stock outperform the majority of stocks that we rate. The company's strengths can be seen in multiple areas, such as its growth in earnings per share, notable return on equity, increase in net income and reasonable valuation levels. We feel these strengths outweigh the fact that the company has had lackluster performance in the stock itself."
Happy trading