Target TGT after ER play12.12.23
Strong move after ER
Looking for move towards 138
Over 138 level resistance at 140, 142,48, 147,54
and 150 psych level
Lower support 132,47 131, 127,9
Only squeeze on 30min for now
TGT trade ideas

Example of The Retracement TheoryOn the chart I include the formula and a example of how to get shirt term price targets using the retrace theory.
Basic retracement theory
(B-A)+C
(130.77-128.71)+129.94=$132
the low = A
the retrace high = B
current retracement low = C
Trend Strength Maximum Retracements Upside Targets (downside targets are inverse)
Very Strong
-14.6% to 23.7%
A to B added to C
Easily exceed B
-Strong
38.2%
A to B added to C
Easily exceed B
-Medium Strong
38.2% to 50%
80% of A to B added to C
Should Easily exceed B
-Medium
50%
80% of A to B added to C
Should Easily exceed B
-Medium Weak
61.8% to 50%
80% of A to B added to C
Possibly exceed B
-Weak
61.8%
80% of A to B added to C
Possibly exceed B
-Very Weak
85.4%to 76.3%
80% of A to B added to C
Probably will not exceed B

I'm going to try this againPrice is retesting the broken support. We have here several bearish patterns (see my previous post lines below) and the stock need much more for a come back. It might try to break the resistance but I don't think is going to make it. If my puts expire out of the money I'll buy more and try again.


The low is in for TGT4th largest pullback in history.
Bouncing off of a STRONG support. Earnings came in hot.
BUY LOW, sell high = looking GOOOOOOD!!

dive in TGT upTarget Corp. engages in the operation and ownership of general merchandise stores. It offers food assortments including perishables, dry grocery, dairy, and frozen items.
I think its oversold
im in tgt a bit longer with calendar call options strategy I have realized and rolled short positions you can dive in with calls

$TGT Fibonacci Support or Double BottomIn the case of Target Corporation ( NYSE:TGT ), the consideration of whether to rely on Fibonacci support levels or to wait for a potential double bottom formation around $90.17 involves a strategic decision based on technical analysis principles.
### Fibonacci Support Level
- **Fibonacci Retracement**: This tool is used to identify potential support levels based on key Fibonacci ratios (23.6%, 38.2%, 50%, 61.8%, and 100%) calculated from a prior price move. If NYSE:TGT is currently near a significant Fibonacci level, this could indicate a potential area where the stock might find support and possibly rebound.
- **Confirmation**: Traders often look for additional confirmation signals at these levels, such as candlestick patterns, RSI divergences, or volume changes, to validate the strength of the Fibonacci support.
### Waiting for a Double Bottom at $90.17
- **Double Bottom Formation**: This is a bullish reversal pattern characterized by two distinct lows at a similar price level, with a moderate peak in-between. If NYSE:TGT approaches $90.17 and forms a pattern that resembles a double bottom, it could signal a potential reversal from the downtrend.
- **Confirmation and Breakout**: Confirmation of a double bottom would require a rally above the peak between the two lows. This breakout is often accompanied by increased trading volume.
### Considerations for Investors and Traders
1. **Risk Tolerance and Time Horizon**: Your decision might depend on your risk tolerance and investment time horizon. Fibonacci levels can provide earlier entry points, but with potentially higher risk if the support level does not hold. Waiting for a double bottom formation may offer more confirmation but could result in a higher entry price.
2. **Market Context**: Consider overall market conditions and sector performance. Macro factors and company-specific news can influence the effectiveness of technical patterns.
3. **Additional Indicators**: Utilize other technical indicators and analysis methods to supplement the Fibonacci and double bottom analysis, ensuring a more comprehensive decision-making process.
4. **Active Monitoring**: Both approaches require active monitoring of the stock’s price action, particularly near the critical levels of interest, to make timely decisions based on the evolving technical landscape.
In summary, the choice between relying on Fibonacci support and waiting for a double bottom at $90.17 for NYSE:TGT should be made based on a blend of your trading strategy, risk tolerance, and corroborating signals from other technical indicators and market analysis.

Target should continue to declineCounting Target's Rise as a Super-Cycle Wave 1, the company stock appears to have AT LEAST completed Primary 3 of Cycle 5, and to be currently declining in Primary 4, in alternation with a long, shallow Primary 2, SO I expect 93.77, at least, if not as low as low 60s, by later this year (maybe August/September). It may be worth noting, that in its Minor C of Intermediate A of Primary 4, price extended (NEARLY) to its A-B extension of 1.618. I don't know whether this is meaningful, but maybe someone will.

Pick one or twoThese stocks are clearly in a downtrend and testing the downtrend line resistance. I have puts of TGT that I bought on Friday. If you want to trade one of these I recommend to open a limit order at a better price than it closed on Friday for the puts and pick a strike price close to the current price. You can also buy puts with different strike prices to balance out you risk. My TGT puts expire on 11/10 and strike 113. I may buy more but depends how the week goes. Always think on your risk reward, If price opens with a gap down just move to another trade.

Target: How much will it fall? An important MoB level...There is from my point of view an BnR Pattern in the chart. At 129,9 there is an important resistance level, the highs if Nov/Dec 2019. The first parallel channel as well as a support line cross this resistance mid of June thus this may be a level where we may see an bounce back or if this level breaks much deeper targets (111 $)

Bearish on TGT.
Good evening everybody. I am bearish tomorrow on TGT because we did not close above yesterday's close. Also, we were green but our volume was very low, also we are riding an upward trend line that I drew on the 1 hour chart. I will look for a break of trend-line support and retest to the previous horizontal support. But, if we go up, you can see my scenarios in the picture. Thank you as always for looking at my analysis.

Why is Target doing so bad?Why is Target doing so bad?
Company Analysis
Why is Target doing so bad? They've really fell off a cliff over the past year. I look at their stores and they seem good, and once upon a time not too long ago they were outperforming Walmart. Now their NAV prices have really dropped over the past year and a half. I was once up 80% on these guys and know I'm down 20%. Is it the general market swing over the course of that time or something else? What gives?
Discussions over the price is not my concern but the people arguing why is it?
this idea is for analysis only.
This is not a financial advice.

TGT near cluster support area!I would not rush into puts unless cluster support breaks here, watching for break of 171.17 for long play / break of 134.52 for shorts

Bullish TEST : TGTAfter a quick price action, now is the time to move higher to confirm this strenght on the 15m.
We need a move above the level which would mean bullish crossover

TARGET is over punishedIt's true that economy is deteriorating, so does the Target (TGT) stock. However, the retailer giant TGT stock has been unreasonably undervalued. The current price is no longer reflecting the strength of growing revenue and profit for the company. Market has been overly pessimistic about the future economy and unrealistically dumping the stock. The valuation shows that the company is financially growing after the pandemic fall. But the stock value remained in decline. It is very cheap now to own TGT stock at discounted price.

TGT extremely oversold. can start load shares#TGT extremely oversold on Weekly chart.
#TGT also create double bottom on 1h chart at 105.79$
IF can hold 105.79$, #TGT can back test up to 115-116$
IF can't hold 105.79 next support will be 102.89$
I'm loading shares at 106$

May be close to a bottom, pending dead cat bounce?It could be rough next couple of weeks. Market can rally from middle of October until early January. This can continue to crash next year as showed with my arrows.
This is just a prediction and not an advice.


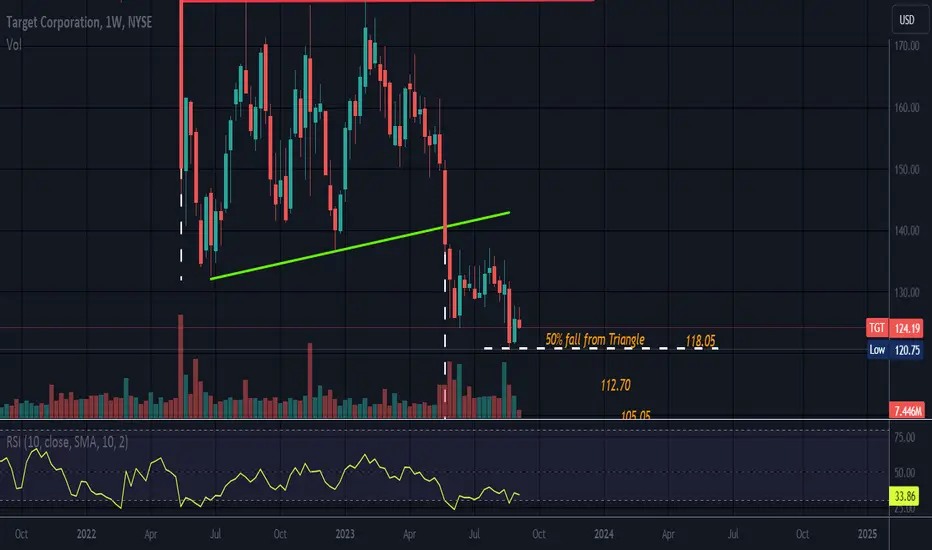
Weekly Chart//TriangleLooks like an Ascending Triangle o the weekly timeframe.
All triangles are neutral until broken. This Ascending Triangle has broken to the downside.
Targets in orange and were calculated using the wide end and fib levels.
Price has hit the 50% mark. The next target is the .618, then the .786 then 100%.
Price can fall less or more than 100%. T1 which was the .382 has been passed.
No recommendation.
If one does not see a pattern on daily, sometimes there is one on weekly.
The green line should be red as prior support is now resistance.
Keeps fallingMultiple bearish patterns. Last week just confirmed a bearish flag and broke an important support at 125. Price may try to test back the broken support now resistance at 125, but I really don't think is going any higher, too much bearish pressure. You can open a small position tomorrow and if it tests back add more. It has a lot of room to go lower. It may also trade sideways for a few days but eventually will fall. Hold it and wait.

Target - Why Is Everyone Desperate To Long Disasters?Target is another example of the so-called "contrarian" trade that circulates on financial social media where, somehow, everyone puts on their VERY SMART PERSON baseball caps and gets long because it MUST BE TIME FOR THE MOTHER OF ALL SHORT SQUEEEEEEEEEEEZES.
And yet time and time again it never works.
Paypal is a really fine example.
Paypal - Going Long In a Bear Market?
I mean cool, if you bought at $59 in May (you didn't) and sold at $77 on the last two days of July (you didn't) then you made $18 a share and are a VERY SMART PERSON.
And then it gave it all back in a day on earnings and people are killing themselves buying the dips again.
Same with T-Mobile, Verizon, and Disney
Disney - Is Your Compass Upside Down?
It's at long time lows. Went up a bit on earnings. And then gave it all back over the span of a few days and people are still "buying teh dip," primarily because some Signal or Discord or picture of a girl on Musk's new Xeeeeeeeter app said "muchwow prize target nao $120 be a winner like me and BUY CALLS."
These are things that you need to stop doing. When something trades like a bag of doorknobs for a long period of time it's because it really is a piece of crap that will eventually go lower, and so instead of buying that dip, sell that rip.
Better yet, ignore this kind of junk and trade what is actually trending, the indexes, or just go outside for a month or two and come back when the chop is over and save your trouble.
Look at the monthly bars on Target. "Zoom out," they always say.
I understand this because in the first two months I wanted to go long on this thing for at least a retrace to $150 too.
But instead the old "support" has become new "resistance."
And this tells you that new lows are most likely coming.
And when Target flirts again with $100 people will go even more bigly long.
The longs trapped from $125 and $130 will double their position.
But this piece of crap probably won't bounce.
Have you actually been on their website and looked at the clothes they sell? Look at stuff like women's intimates (lol). Do you know they have an isle in the stores devoted to fleshlights?
Do you know that they allow people to steal?
That, my friends, is real "fundamental analysis". What's the bull case? That someone told you the EllLioT WaVeS SaId $160 MiniMum?
This is a chain that was bounced out of Canada because it was Zellers 2.0.
These markets, all the equities, all the commodities, the entire world is in for a rough future. The rough future might only last for a few months, but it might last for a few years.
If you don't "paradigm shift" ahead of schedule, by the time you do get your paradigm shifted forcefully, it will be too late for crying.
And so my only wish with these things is to wake you up. China is the world's central stage and what's going on with Xi Jinping, the Chinese Communist Party, and its 24-year persecution against Falun Dafa is the fundamental story that everything else is a slave to.
Time to wake up, my friends.

TGT Target Corporation Options Ahead of EarningsLook at how perfectly this TGT price action was followed:
Now analyzing the options chain and the chart patterns of TGT Target Corporation prior to the earnings report this week,
I would consider purchasing the 136usd strike price Calls with
an expiration date of 2023-8-18,
for a premium of approximately $2.66.
If these options prove to be profitable prior to the earnings release, I would sell at least half of them.
Looking forward to read your opinion about it.

Target long2020 supply turn demand
Higher low
Dollar weakness
Breakout incoming
Gap fulfillments required
