$XRT: Strong Break of 75Looking at AMEX:XRT strongly leading most other growth stocks, we have reason to believe it may continue. AMEX:IWM is holding up well but discretionary stocks in the space are looking a bit stronger than other growth areas of the market like AMEX:KRE and AMEX:ARKK
XRT trade ideas

XRT: Bullish Inverted Head and Shoulders Could Target an 0.886XRT on the hourly has started to form what could be a Bullish head and Shoulders, if it plays out it could result in the XRT making a 0.886 Fibonacci Retrace likely starting before the end of the week. Additionally, the RSI has a Bullish Shark formation which could serve as further confirmation of the low.

XRT - another high and tight flagThis might be my favorite chart of the weekend. Long consolidation into a high and tight flat with a nice break above the bull flag.

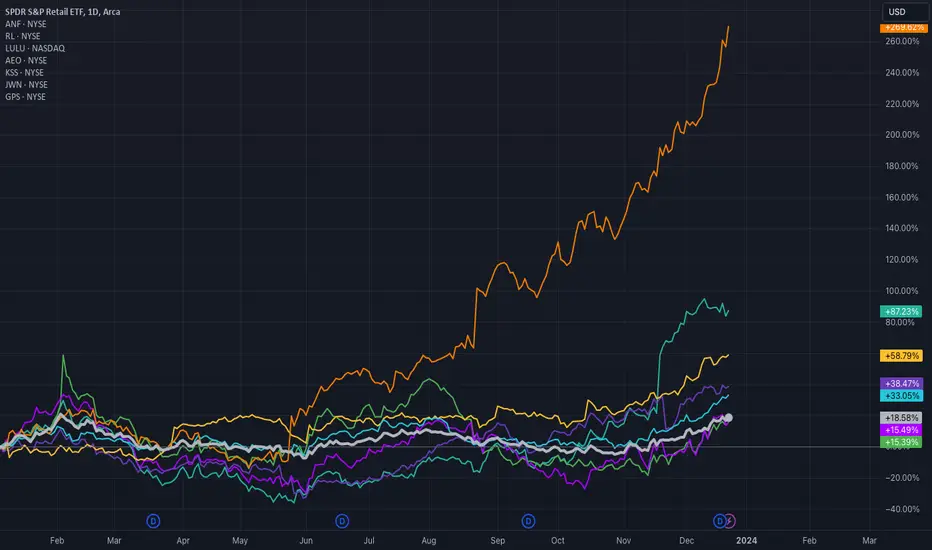
XRT: Ringing the Register on Retail StocksSmall caps have surged to fresh highs dating back to the first quarter of 2022. The Russell 2000 ETF (IWM) has suddenly become a darling among sellside strategists and even buyside macro portfolio managers. Recall it was just two months ago when the group traded around 12 times next year’s earnings estimates. Jump ahead to today, and a 25% rally since October 27 leaves ‘the smalls’ closer to 15 times forward EPS forecasts. Is that a bargain? Maybe not quite as much.
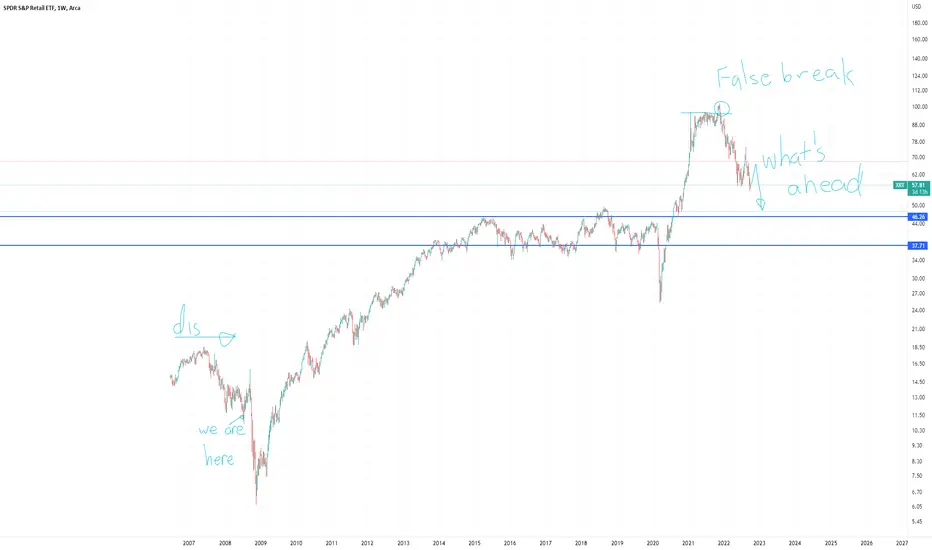
Let’s focus on one key piece of the small-cap story. Retailers. Pull up a chart of the SPDR S&P Retail ETF (XRT), and you will see that the pattern since late 2020 appears remarkably similar to IWM's technical profile. The equal-weight basket of consumer equities peaked above $104 in Q4 2021 before plunging to support about 50% lower. Indeed, the mid- FWB:50S has proven to be support several times in the past 15 months. While XRT holds many large-cap names, its equal-weight construction methodology means it will act like a small or mid-cap ETF.
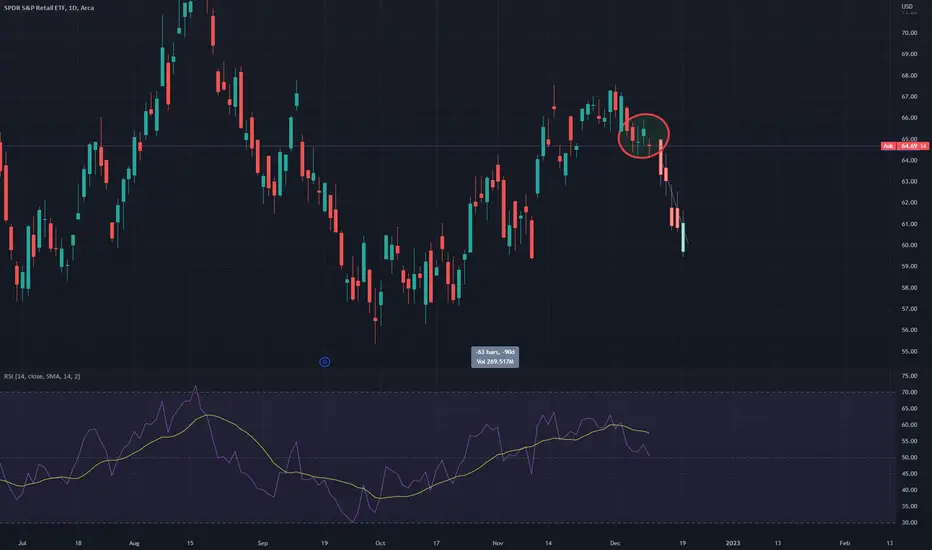
On the chart, I see clear resistance near the $75 mark. A breakout above that would portend a potential measured move price objective to the low to mid-$90s – just under its all-time high. For now, I am cautious on the fund since it has yet to break through the $75 line in the sand. I noticed, though, that in the fund's 18-year history, January has actually been a positive month, averaging a 2.2% total return with more tempered gains in February. March and April are the two best back-to-back months on the calendar.
Price comes first, however. So, I would like to see XRT jump above the $75 level. For now, ringing the register on retail stocks appears as the prudent play heading into 2024.

$XRT Weak Retail....Listening to the last earnings call we heard it over and over again.... weak retail... weak buyers... retail is dying. We need a health contraction. I don't suggest shorting this one... but once the bottom is in, it could be a fun one to ride to the top again.


XRT Is struggling to maintain a 50% ROC trading extension.XRT is on the precipice of breaking down. If it cannot maintain its price above the .5 extension, it looks to try and find support at the .618...

XRT short - below .618 Fib levelRejecting down trendline, below 50 DMA and the option flow ratio for March 17th is 4:1 puts.
Very strong numbers from economy today, which means the FED will have to raise rates again at some point this year.
I have been following the FOMC for 6 years, take every meeting cautiously. We also have CPI numbers on the 14th.
I am holding MArch 24th 61 puts at $1.15
GL!

#XRT - Retailers ETF consolidating for a breakout?Keep an eye on Retailers in the US. Fundamentally it doesn't feel right but technically its telling a different story. Nice consolidation off the 200 weekly ma since may Last year. Level is clear here. A convincing weekly break above $66.50 should see this move higher to at least a target of $77.50

$XRT - One more leg down...Not looking good... there could be another leg down for XRT which would drag stocks like GME to $16.4
An imminent market crash could support this move...


$XRT - Bearish Tri Star Top PatternA composite chart of SPY, SPX, QQQ, TQQQ, VXX, SQQQ, XRT and some other names.
imgur.com
I think the market is going down a lot in the short term and it's starting.
Short idea #9Hey, I think XRT drops, and significantly so. I'm not shorting yet, but I'm posting my idea ahead of time. I WILL short this when SPY hits $390

XRT predictionHey, I think XRT is going to hold up over the next few weeks despite sweeping the lows. I think this looks like it does back in 2008/9 when it is all said and done.
SHORT | XRTAMEX:XRT
Possible Scenario: SHORT
Evidence: Money-Flow, Price Action
PT: 58$
* I opened a short position by PUTS for 10/21/2022, strike 58$, 2.167$ each contract.

XRT Bearish inclined naked calls 16 Sep expiryWhats The Plan/Trade/Thought
I’ve been looking at the retail sector especially since the consumer willingness to spend has been shifting to services/ experiences and entertainment.
Household cleaning, groceries, pets, alcohol, recreational vehicles all have seen drops in spend from Q1 2022 to Q2 2022
Walmart has also started laying off people and have also seen a shift in consumer purchase behaviours due to inflation and pandemic lifestyle changes. I believe retails companies have already started becoming defensive
Risk Mitigation
There is a key S&R line at 73.02 and the final one at 75.72. Once we see break throughs on these we will need to close
Imagine Yourself Taking The Other Side
With the market becoming bullish since Mid May - June (NASDAQ & S&P). I think taking a bullish position is also possible in the short term. However besides market movement and a dropping oil price, I don’t see how the original bear situation has changed.
Look For New Information
What am I rejecting the current bull run, which is does make me uncomfortable
Next week we have earnings from Walmart, Home Depot, Target, Lowe’s, Bath & Body works. If I had remembered this I would not have entered
How Do I Feel Now
Uncomfortable
Trade Specs
Sold 110 Calls @ 0.42
Strike 80
% to Strike 11.94%
BP Used: 83K
Max Gain: 4620

Closing: XRT June 17th 59/67 Short Strangle... for a 2.52 debit.
Comments: Collected a total of 2.74 (See Post Below). Opted to close it out here for a .22 ($22) winner versus rolling it out for duration and credit.

Rolling: XRT June 17th 82 Short Call to June 17th 67... for a .74 credit.
Comments: With the 82 approaching worthless, rolling it in to the strike that cuts position net delta approximately in half. Total credits collected of 2.74.

Opening: XRT June 17th 59/82 Short Strangle... for a 2.00 credit.
Comments: High IVR/IV at 91/52. Selling the 16 delta strikes on both sides. Will look to take profit at 50% max; manage sides on approaching worthless/side test. 2.00 credit on buying power effect of 7.10; 28.2% ROC as a function of buying power effect; 14.1% at 50% max.

Opening: XRT April 14th 61/84 Short Strangle... for a 1.82 credit.
Comments: High IVR/high IV at 99.5/49.9. 1.82 credit on buying power effect of 7.37 (on margin). 24.7% ROC at max; 12.3% at 50% max.

XRT Bullish inclined Naked Puts 26 Nov Expiry (Nov Track 1)Whats The Plan/Trade/Thought
Bullish Stance
XRT are retail discretionary companies and right now there seems to be alot of optimism. Consumers seem to be find paying for the current rising prices of products. I think will continue with the festive period
Sep Consumer Spending has lost momentum but still grew at 1.4%
Sep Personal income was up 0.9%
Current price has broken a key S&R line at 98. My targetted Stike is 86.5 and is below another S&R line 89.
Price to strike is around 14% seems decent especially since the current price movement is very bullish
I Feel
Feel ready to trade, slightly impatient cause I want to lock this in
Imagine Yourself Taking The Other Side
Inflation related concerns might hit anything consumer fronting hard and with the 4 Dec review on the Debt ceiling there might be some concerns and media coverage as we get closer
Bit concern as I was expending to trade in a sideways bearish volatile movement. But the past 2 weeks have made the market very clearly bullish. Trading my original plan seems almost contrarian
Imagine Yourself As A Neutral Observer
There is optimism in this trade, however the long cancel on the 3 Nov seems unnaturally long. This means it might gap back into the range
But the bullish momentum matches the current market sentiment and if we are being pure in trading what is in front of us and not making predictions. This is the right decision
Look For New Information
Top 9 out of the top 10 holdings are all up with AEO the highest at 6.26% (American Eagle Outfitters)
How Do I Feel Now
I think this and my VXX trade is very aligned and while it opposes my early market reading - Sideway Bearish Volatile. Purely trading what is in front of me is a clearly Strong Bullish
Trade Specs
Sold 0.38, 70 Put Contracts @ Strike 86.5
% to Strike 14%
ATR % is around 50%
BP used 60k
Max Gain: est $2660
