AIG Inverse head and shoulders?Will be interesting to see if this turns into a bonafide Inverse head and shoulders. Won't know for a while.
AIGB34 trade ideas


AIG Daily (14.08.2014) Technical Analysis TrainingThe American International Group (NYSE:AIG) Daily Diagram Technical Analysis Training shows the following:
The AIG share has broken the neckline of SHS pattern that we have mentioned in last diagram. Now AIG is trying to breaches the Kijun Sen into the KUMO.
MACD is bullish under the zero line and RSI is 50 to bullish. The volume is moderate.So the first think in mind is the reversal and the breach of Kijun Sen resistance.
There is no special candlestick pattern. The share is into the KUMO and above the Kijun Sen (the bet for today) and Tenkan Sen too.
Long AIG if it positive today for 54.63 first and watch the 2.618 of fib as a level. Otherwise stop loss and short for 53.12 first.

AIG Daily (15.07.2014) Technical Analysis TrainingThe American International Group (NYSE:AIG) Daily Diagram Technical Analysis Training shows the following:
The AIG share has made a long term development with the support of Kijun Sen & Tenkan Sen lines (for 3 months now) (light blue & light green). These support lines are above the KUMO, which means that the AIG is bullish in long term. The weekly and monthly diagrams are both bullish to neutral.
So the first think in mind is the red resistance line. MACD is bearish and RSI is neutral to bull. The volume is moderate.
There is no special candlestick pattern. The share is above the KUMO and above the Kijun Sen and Tenkan Sen too.
There is SHS pattern that has solved downtrend but the KUMO support was very strong.
I make some long thoughts in the case of breaching the red resistance line.

AIG - short on the financial sectorAIG had a very bearish signal a week ago. Because of some news, it went up again with a gap, only to reject the 54 level. A double bearish divergence on the histogram and a triple bearish divergence on the FI, with a false breakout, all on a weak weekly chart. I shorted at 53.36, with a stop at 54.44 targeting the 50$ round level, and maybe even 47$, allthough it's hard to go all the way to 47 without a stock market panic.
Weekly picture here :

AIG - Up or Down?Trying to figure out where this thing is headed. My guess is up as long as they keep executing their plan and improving their matrix.

AIG: Major Top?The Multiple weekly pin bars mark 46.50 area as a major long term support and a key directional level, i mean by directional here a main influence to price action. Holding above that support keeps the overall bullish trend intact. Although we have seen signs of topping in the past few months, as the bullish trend hasn't been as strong as earlier stages.
Price completed a bearish shooting star candle last week, hinting we might see another push and retest of 46.50 support level, which coincides with the main 52-week SMA and just above the main support of the long term rising channel.
Accordingly, I believe this area is technically major, watch out for a break below it as it may signal a strong bearish reversal.
twitter.com
thefxchannel.com Your input is valuable, please visit this page and vote in the provided poll. Appreciated.


That's one bullish weekly candleDaily engulfing at the resistance line as well. Should have continuation. This trades like the SPX with higher beta


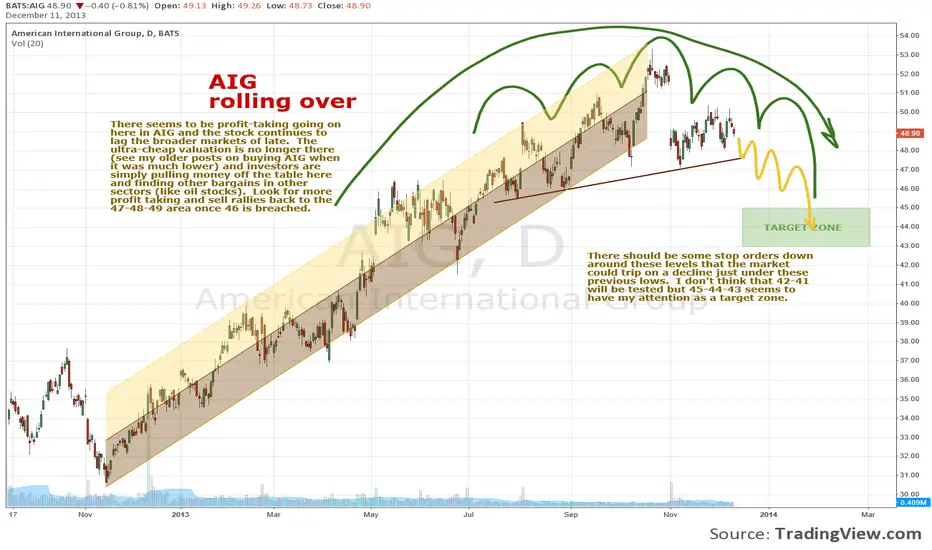
AIG rolling overThere seems to be profit-taking going on here in AIG and the stock continues to lag the broader markets of late. The ultra-cheap valuation is no longer there (see my older posts on buying AIG when it was much lower) and investors are simply pulling money off the table here and finding other bargains in other sectors (like oil stocks). Look for more profit taking and sell rallies back to the 47-48-49 area once 46 is breached. There should be some stop orders down around the 47-46-45 levels that the market could trip on a decline just under these previous lows. I don't think that 42-41 will be tested but 45-44-43 seems to have my attention as a target zone. Long term I am bullish on AIG, just short term it looks vulnerable.
Cheers.
Tim
Wednesday, December 11, 2013 11:10AM EST
PS - I don't know how an ABX chart was published when I published AIG. STRANGE.
AIG...TREND CHANGE IN PROGRESS!Right now is either a good opportunity to go long or almost a good time to go short, depending on how you feel about the financial sector.
Quick overview.
On the rise since May
Recently broke 100 day EMA but bounced back over it.
Recently gapped down below old support line.
Still under old support line.
Short-term on the rise.
Formed a bearish engulfing pattern today touching resistance line.
I am overall bearish for 2 major reasons, the gap down is a major bearish signal and it lost the support line.
If it closes into the blue shaded area close long positions and go short.
I will keep updating as this progresses. Any other thoughts?

AIG Weekly Study 11/17/2013Note on chart.
Disclaimer: No position in AIG. Plan to initiate long position with covered calls.


AIG Weekly 11/1/2013 AnalysisBreak down of weekly support @ $50.34.
Due to the earning report, AIG sustained a large drop today of 6.5%. It broke through the weekly support @ $50.34, and filtered with the 2nd weekly support at $48.33, and finished just south of it ($48.28).
Looking ahead, I think the stock will consolidate around the previously established consolidation zones. In the bullish case, it will be around $48.3-$50.3, and bearish case around $45.5-$48.3. Next week will the be key and will tell us which side it will take. Use RSI as your guide.
No position in AIG (Sold around $49.9 on 10/14), but looking to re-enter.

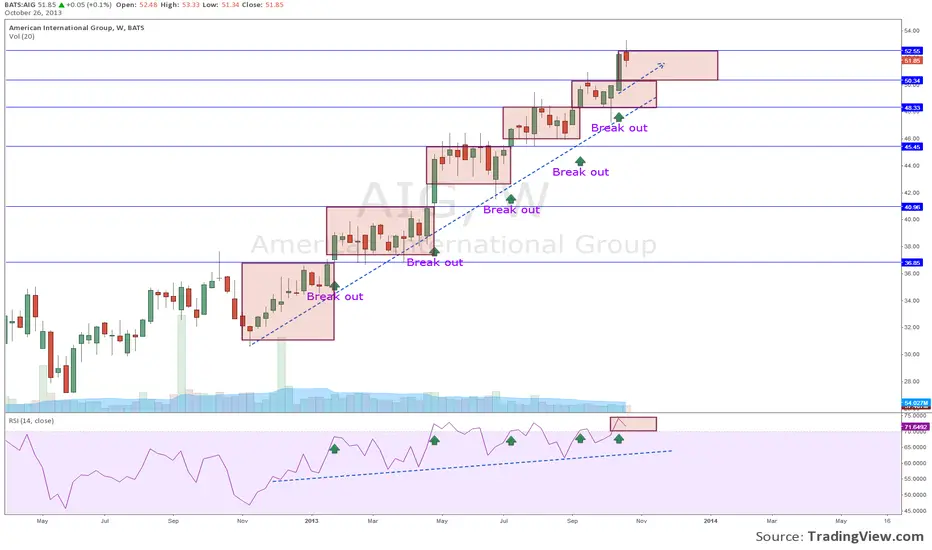
AIG Weekly Analysis 10/26/2013AIG long and strong on the weekly candle.
This is a continuation of a series of previous posted charts .
As show here, on weekly chart AIG now broke the resistance at $50.3, into the next zone of consolidation. I expect the RSI to drop a bit (to around 60-70s) before continuing the next leg up. The bullish trend is certainly up and strong.
Disclosure: No position in AIG at the time of analysis
AIG Weekly Chart 10/12/2013Another break out coming soon?
This is a continuation of a previously published chart. Looking at the weekly chart, what becomes evident is that
#1. AIG is in a bullish trend
#2. AIG moves up in a step-wise fashion
Despite of government shut down, AIG was able to finish the week solidly in the positive territory.
RSI > 70 appears to be associated with progression to the next step. Based on that hypothesis, I expect that AIG to break above $50.3, landing into the next step. This may happen as early as next week or the week after, assuming macro is intact.

AIG Upside PrevailsThe bullish trend remains intact as price rebounds forming a pin bar at support. Bullish trades remain favored.

AIG toppy and weak AIG TOPPING - ROLLING OVER
T-Bonds went down first -
Then Utilities went next -
Then the banks are toppy & have head&shoulders tops -
Now the insurance sector is starting to show divergences -
TRIPLE DIVERGENCE IN CCI WHICH IS PRICE MOMENTUM, REVEALS INTERNAL WEAKNESS
POSSIBLE SELLING PRESSURE AHEAD AS THE BUYERS HAVE SLOWED THEIR MOMENTUM.
Just for balance: It would seem logical for AIG to have a period where some money comes off the table.
Risk = 3 average ranges
Reward = 3-5 average ranges
Tim 5:11PM EST Thursday, October 3, 2013

AIG Mid-week analysis 9/16/2013Breaking out of consolidation $45-$48, looking to establish another zone of consolidation.
This is a follow up the chart that I published 2 weeks ago. ()
Looking at AIG weekly chart, AIG has been moving up along zones of consolidation. Each breakaway is signaled by RSI approach or above 70. Last week, we saw another break out (RSI is above 70). Currently, we are seeing the confirmation of the bullish breakaway. I expect that we will establish another period of consolidation shortly, this will be signaled by peaking of RSI.
Long AIG

AIG 6/20/2013AIG has been in consolidation pattern since May, but now forming a descending triangle with short term support at $44.50 and $43.25. Volume has return to normal. However, I expect a break out from consolidation shortly. If it is unable to hold about these support levels, expect breakdown to fill the gap at $42-$43 range.
