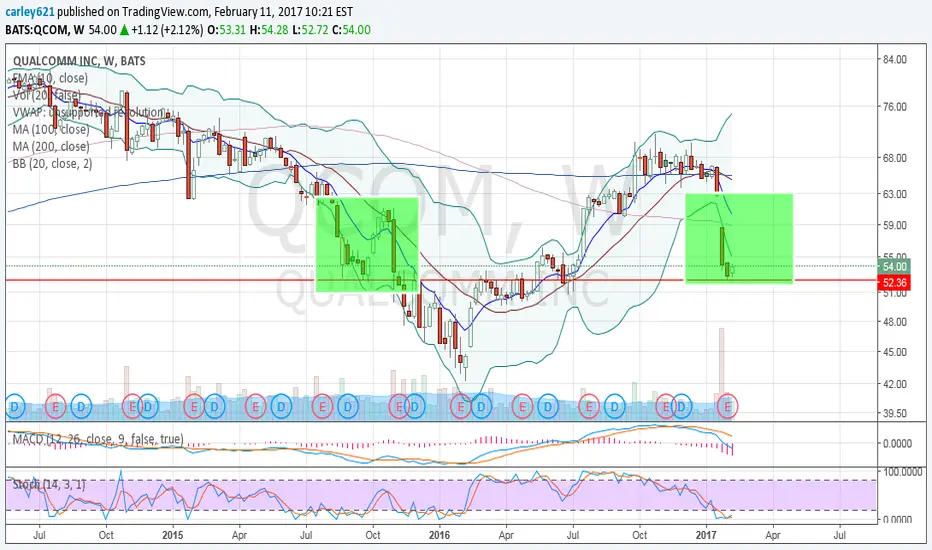
$QCOM Weekly Long Setup: Cup&HandleWe've been making a good habit. Trading Calls on the way up as we fill the gap.
Nice cup and handle formation pattern. Currently trading in the gap.
will add more eow
-TheTradingNinja
QCOM34 trade ideas

Potential Bullish Head and Shoulders, Heading Down FirstQualcomm has been potentially forming a well-known technical trading indicator called a head and shoulders (HnS) pattern. This pattern is basically made up of three peaks or triangles with the middle triangle have a higher top than the ones flanked on each side. A HnS pattern with the peaks on top is bearish as the stock drops upon the final triangle (or shoulder) taking shape. A bullish HnS is the opposite where the peaks are actually valleys. Upon the final shoulder being created, the stock goes up. I have outlined the case below on the currently forming bullish HnS pattern.
When we take a look at other technical indicators, the relative strength index (RSI) is at 75.1524. RSI tends to determine trends, overbought and oversold levels as well as likelihood of price swings. I personally use anything above 75 as overbought and anything under 25 as oversold. Currently the RSI is overbought and due to drop. The stock should drop with this. A drop will begin the formation of the final shoulder in the HnS pattern.
The true strength index (TSI) is currently -0.4758. The TSI determines overbought/oversold levels and/or current trend. I solely use this as an indicator of trend as overbought and oversold levels vary. The TSI is double smoothed in its calculation and is a great indicator of upward and downward movement. The current reading declares the stock has been moving up, but it is near the levels of reversal that occurred at the initial forming of this HnS. This further aids in a potential indicator of near-term downward movement.
The positive vortex indicator (VI) is at 1.3659 and the negative is at 0.5682. When the positive level is higher than 1 and higher than the negative indicator, the overall price action is moving upward. When the negative level is higher than 1 and higher than the positive indicator, the overall price action is moving downward. Currently both indicators are at extreme levels which typically lead to a reversal of the stock. This is the third indication of near-term downward movement for the stock.
The stochastic oscillator K value is 84.6919 and D value is 85.7988. This is a cyclical oscillator that is highly accurate and can be used to identify overbought/oversold levels as well as pending reversals and short-term activity. I personally use anything above 80 as overbought and below 20 as oversold. When the K value is higher than the D value, the stock is trending up. When the D value is higher that the K value the stock is trending down. The stochastic is currently overbought and due to retreat. This is the fourth indication of pending near-term downward movement.
During the possible formation of this current HnS setup, the 200 day moving average (DMA) has acted as a strong level of resistance. This means the stock approaches the 200 DMA (redline across the chart) and then it drops. Currently, the stock is nearing this DMA further signaling a retreat is coming.
I am only focusing on the first leg of the remaining HnS in this article. The chart above does display the movement of this leg that completes the final shoulder top and the green up arrow depicts estimated completion of the shoulder. After the right shoulder is completed, earnings should be reported for QCOM. The results from earnings could be the jolt that fully completes this pattern and finally excels above the 200 DMA.
Considering the RSI, TSI, VI and stochastic levels, the overall direction favors a move to the downside. Based on historical movement compared to current levels and the current position, the stock could drop at least 8% over the next 28 trading days if not sooner.


Pending Bullish Head And Shoulders For QCOMI see this movement potentially setting up. I plan to write on this in a few more days after the stock moves up a little further.
The initial play will be to the downside. The stochastic is overbought and RSI is nearing that area. A drop is coming, but I am anticipating the stock to rise long-term.
Bearish over next month.
Bullish after that


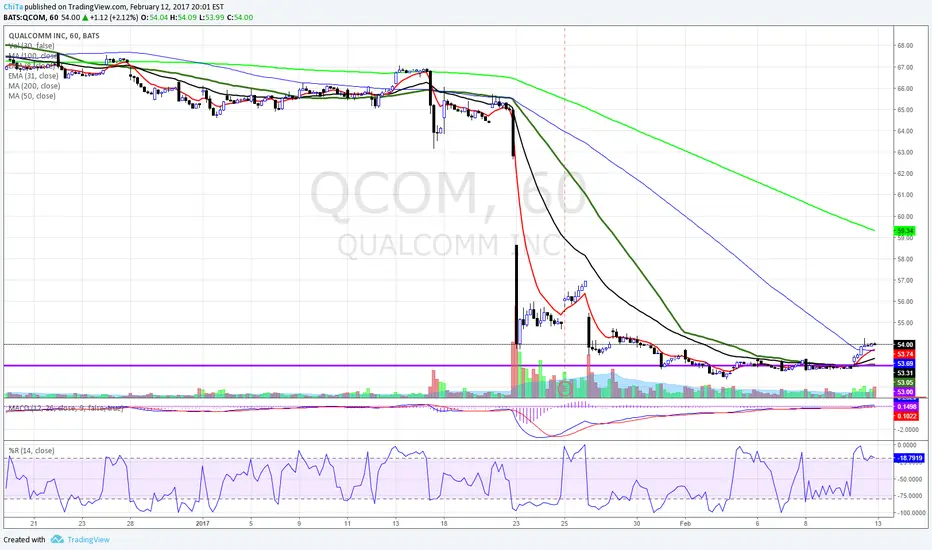
QCOM Bullish Swing? ** I won't be taking this trade ** It's coming down to a very strong longer term support. This is a super aggressive setup. With earnings very near, it's one I would look to exit before. The distance from the EMA's suggests sideways movement if it doesn't in fact bounce off the support. The stop is too tight to take the risk. Honestly, this could possibly be a day trade setup in the next day or two.

buy or sell any close outside box go long or short
buy 57.40
s 54.90
t 62.50
short
54.80
t 50.30
s 57.30


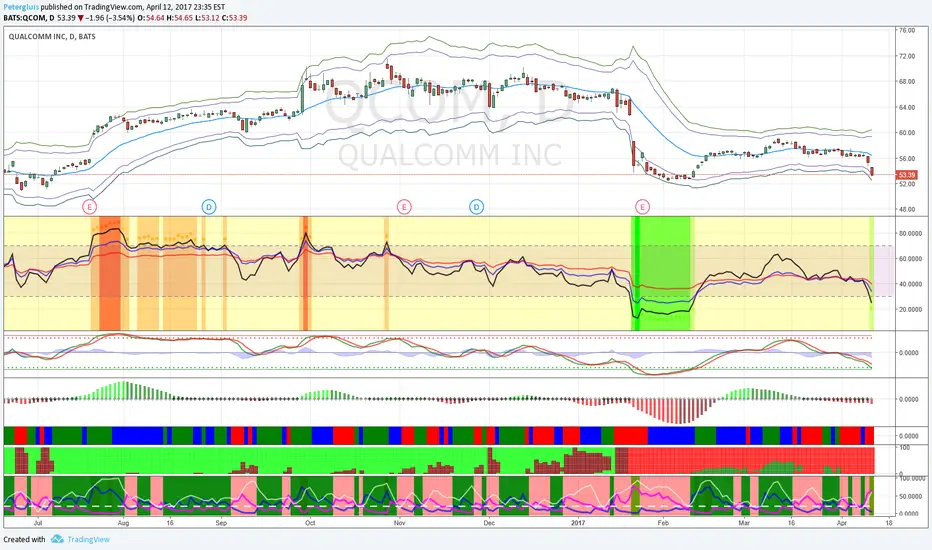
QCOM Treading Water For NowOn March 31, 2017 the Qualcomm Incorporated ( QCOM ) 100 day moving average (MA) crossed below its 200 day MA. Historically this has occurred 19 times and the stock drops at least 0.235%, with a median loss of 3.023% and maximum loss of 16.621 % over the next 10 trading days.
When we take a look at other technical indicators, the relative strength index (RSI) is at 50.3856. RSI tends to determine overbought and oversold levels. I personally use anything above 75 as overbought and anything under 25 as oversold. The current reading declares the stock is neutral.
The true strength index (TSI) is currently -0.0481. The TSI determines overbought/oversold levels and/or current trend. I solely use this as an indicator of trend as overbought and oversold levels vary. The TSI is double smoothed in its calculation and is a great indicator of upward and downward movement. The current reading declares the stock is neutral and has been floating there for almost two weeks.
The negative vortex indicator (VI) is currently 1.1147. The VI determines current trend and direction. When the positive level is higher than 1 and higher than the negative indicator, the overall price action is moving upward. When the negative level is higher than 1 and higher than the positive indicator, the overall price action is moving downward. The current reading declares the stock is trending downward.
The stochastic oscillator K value is 50.5088 and D value is 39.3695. This is a cyclical oscillator that is highly accurate can be used to identify overbought/oversold levels as well as pending reversals. I personally use anything above 80 as overbought and below 20 as oversold. When the K value is higher than the D value, the stock is trending up. When the D value is higher that the K value the stock is trending down. The current reading declares the stock has been trending up but is currently neutral on direction which will not last long.
Considering the moving average crossover, RSI, TSI, VI and stochastic levels, the overall near-term stock direction appears to be indiscernible. Based on historical movement compared to current levels and the current position, the stock could drop 1.5% over the next two weeks. The minimum drop the last five times this MA crossover occurred was around 2%.

Just for LOL's ;-)A trader has two choices in general:
a) leaning and get something out of others knowledge, or
b) leaning on his one ego and...learn later, in another live, maybe? ;-)
Love you all TradingViewers and thanks for your good vibes.
Peace!

$QCOM Fails To Breakout, This Is What It Means To InvestorsOn Monday, shares of QUALCOMM, Inc. (NASDAQ:QCOM) opened above a major breakout level of $58.75. However, by the time the stock market closed, price was back below, failing to hold the breakout. This is a major level for QUALCOMM as it is the pivot between a major move up to $63 or a collapse down to $52.50. Investors should read it super simply. As long as QUALCOMM, Inc. stays below the breakout trend line of $58.75, be negative on the stock and do not be surprised if it falls back to $52.50. If however, QUALCOMM closes any day above $58.75, jump on board for an easy ride to $63.00.

Qualcomm LongNice reaction off of a monthly breaker, market structure has shifted to the upside. Now we have returned to a bullish order block.


QCOM long term buy, collect 3.8% div and wait for NXPI benefitsHaven't checked options. Like the stock and Div at these levels. Expecting NXPI deal to close and huge benefits to accrue to QCOM later this year.

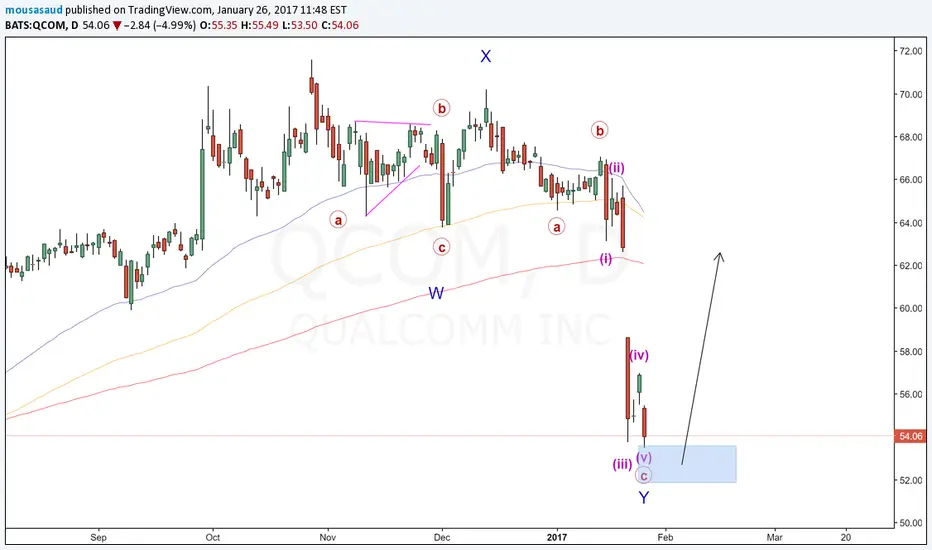
QCOMLooking for $62 area to fill gap...A Double zigzag is completed and wave ((c)) of Y was ending diagonal ... so need to rally monitor this week or nest week
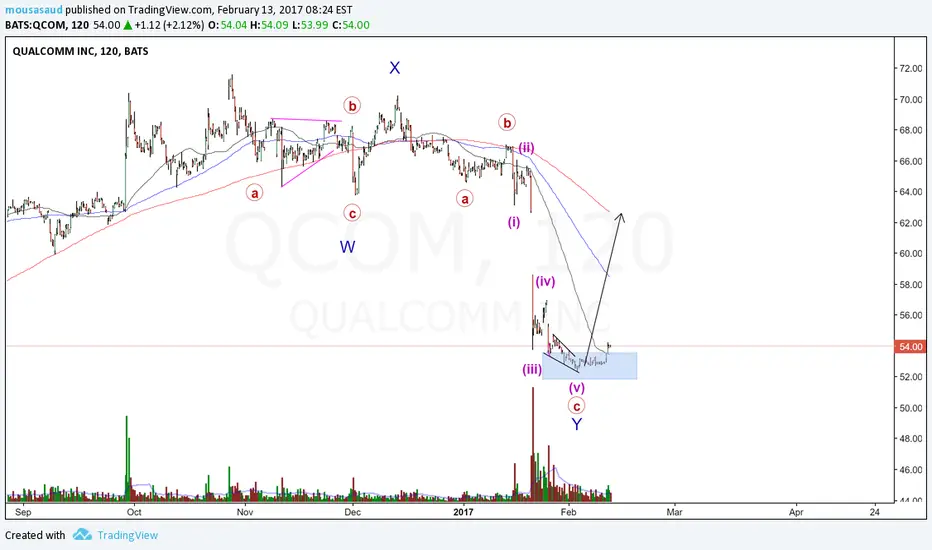
if it happened once? This looks like the same set-up from the past.. Now can we replay this in the future? Nobody knows but if we have a plan we can mitigate risk. Put your stop just below 52.36 and see if this can retest back to 63.
QCOM LongQCOM entrance at $53.4 with a stop at $51.80 and target of $62.81 provides a reward:risk ratio of 5.88 or 17.6% ROI. The large gap down provides a great opportunity since price almost always goes back to close the gap.

QCOM see much rewards over risk QCOM suffered a large sell-off due the lawsuit with AAPL. As we could see, even the sell-off is filling the gap of previous jump-up. Strong support around 51.17. With the upcoming earning, I would say its rewards would be great if considering the relative risk.

Qualcomm: BUY BUY BUY!Hi traders,
We can see that Qualcomm has opened the week with a drop of about 15%. Now would be a good time to buy. The red line is the expected price movement.
Cheers
