Unloosable trade on PINS from here Selling the regular January $28 / $24 collar. Selling the call at $28 Jan and buying the $24 put. This will be for a net credit. FROM HERE, can't lose!!! :_)
PINS trade ideas

Pinterest rallies continue to attract sellers.Pinterest - 30d expiry - We look to Sell at 25.49 (stop at 26.71)
Posted a Treble Top formation.
The primary trend remains bearish.
In our opinion this stock is overvalued.
Intraday rallies continue to attract sellers and there is no clear indication that this sequence for trading is coming to an end.
26.14 has been pivotal.
26 continues to hold back the bulls.
Resistance could prove difficult to breakdown.
Our profit targets will be 22.33 and 21.33
Resistance: 24.00 / 25.00 / 26.00
Support: 22.60 / 22.00 / 20.50
Disclaimer – Saxo Bank Group.
Please be reminded – you alone are responsible for your trading – both gains and losses. There is a very high degree of risk involved in trading. The technical analysis , like any and all indicators, strategies, columns, articles and other features accessible on/though this site (including those from Signal Centre) are for informational purposes only and should not be construed as investment advice by you. Such technical analysis are believed to be obtained from sources believed to be reliable, but not warrant their respective completeness or accuracy, or warrant any results from the use of the information. Your use of the technical analysis , as would also your use of any and all mentioned indicators, strategies, columns, articles and all other features, is entirely at your own risk and it is your sole responsibility to evaluate the accuracy, completeness and usefulness (including suitability) of the information. You should assess the risk of any trade with your financial adviser and make your own independent decision(s) regarding any tradable products which may be the subject matter of the technical analysis or any of the said indicators, strategies, columns, articles and all other features.
Please also be reminded that if despite the above, any of the said technical analysis (or any of the said indicators, strategies, columns, articles and other features accessible on/through this site) is found to be advisory or a recommendation; and not merely informational in nature, the same is in any event provided with the intention of being for general circulation and availability only. As such it is not intended to and does not form part of any offer or recommendation directed at you specifically, or have any regard to the investment objectives, financial situation or needs of yourself or any other specific person. Before committing to a trade or investment therefore, please seek advice from a financial or other professional adviser regarding the suitability of the product for you and (where available) read the relevant product offer/description documents, including the risk disclosures. If you do not wish to seek such financial advice, please still exercise your mind and consider carefully whether the product is suitable for you because you alone remain responsible for your trading – both gains and losses.

Pinterest rallies to be capped.Pinterest - 30d expiry - We look to Sell at 25.49 (stop at 26.71)
Posted a Treble Top formation.
The primary trend remains bearish.
In our opinion this stock is overvalued.
Intraday rallies continue to attract sellers and there is no clear indication that this sequence for trading is coming to an end.
26.14 has been pivotal.
Rallies should be capped by yesterday's high.
Our profit targets will be 22.33 and 21.33
Resistance: 24.00 / 25.00 / 26.00
Support: 22.60 / 22.00 / 20.50
Disclaimer – Saxo Bank Group.
Please be reminded – you alone are responsible for your trading – both gains and losses. There is a very high degree of risk involved in trading. The technical analysis , like any and all indicators, strategies, columns, articles and other features accessible on/though this site (including those from Signal Centre) are for informational purposes only and should not be construed as investment advice by you. Such technical analysis are believed to be obtained from sources believed to be reliable, but not warrant their respective completeness or accuracy, or warrant any results from the use of the information. Your use of the technical analysis , as would also your use of any and all mentioned indicators, strategies, columns, articles and all other features, is entirely at your own risk and it is your sole responsibility to evaluate the accuracy, completeness and usefulness (including suitability) of the information. You should assess the risk of any trade with your financial adviser and make your own independent decision(s) regarding any tradable products which may be the subject matter of the technical analysis or any of the said indicators, strategies, columns, articles and all other features.
Please also be reminded that if despite the above, any of the said technical analysis (or any of the said indicators, strategies, columns, articles and other features accessible on/through this site) is found to be advisory or a recommendation; and not merely informational in nature, the same is in any event provided with the intention of being for general circulation and availability only. As such it is not intended to and does not form part of any offer or recommendation directed at you specifically, or have any regard to the investment objectives, financial situation or needs of yourself or any other specific person. Before committing to a trade or investment therefore, please seek advice from a financial or other professional adviser regarding the suitability of the product for you and (where available) read the relevant product offer/description documents, including the risk disclosures. If you do not wish to seek such financial advice, please still exercise your mind and consider carefully whether the product is suitable for you because you alone remain responsible for your trading – both gains and losses.

Recap : QuickTrade n. 15, PINSThe price hit the entry level and moved higher.
It didn't hit the target for few cents and then started to shake nearby the target.
A failed check, closes the position for me.

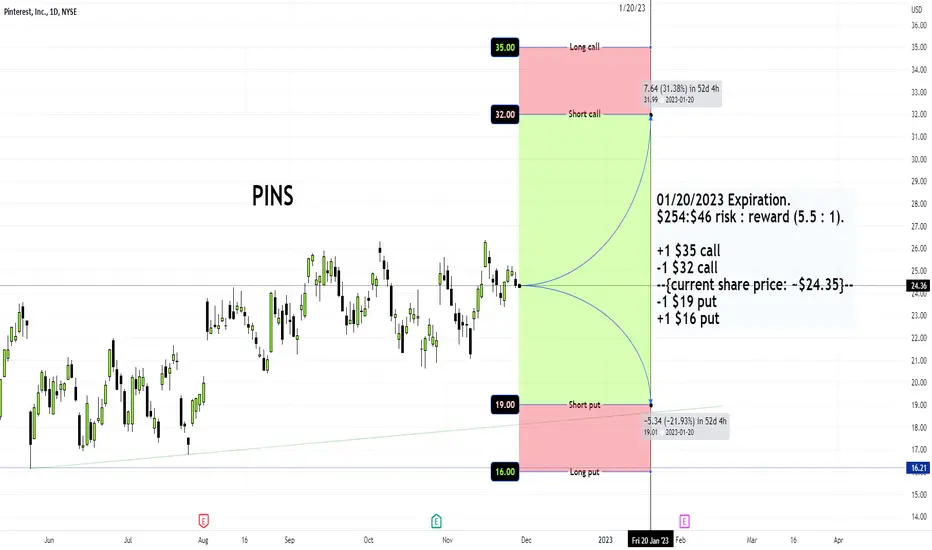
Iron Condor Idea for a Jan 20th 2023 Expiration01/20/2023 Expiration.
$254:$46 risk : reward (5.5 : 1).
+1 $35 call
-1 $32 call
--{current share price: ~$24.35}--
-1 $19 put
+1 $16 put

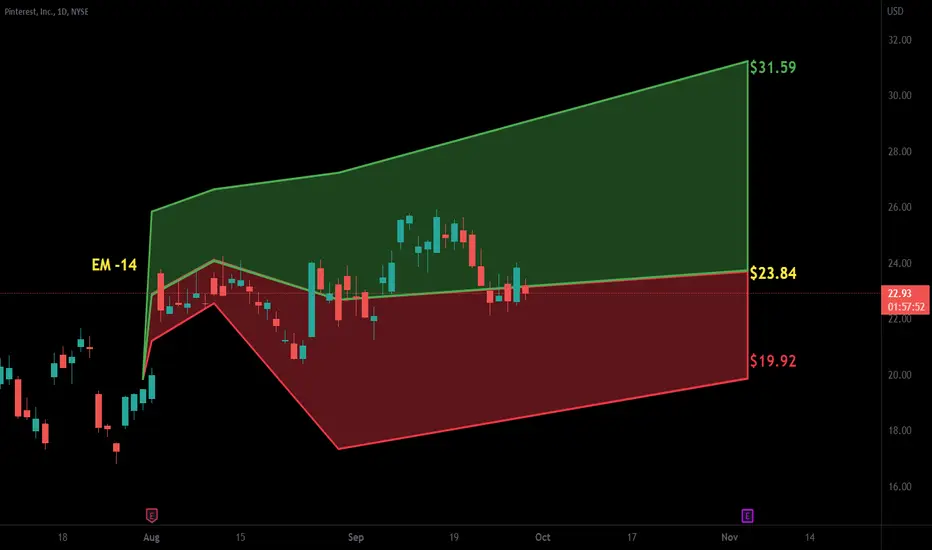
$PINS OutlookDown towards the bottom of the range from $16 - $35. Unsure which direction it heads towards but retesting down on support is likely. Any breakout above $35, will lead to a huge potential gain.


PINS weekly despair bubble cycle stop loss $0Buy Shares of PINS Stop at $26.73 Limit at $26.73 (Good 'til Canceled)
PINS weekly despair bubble cycle stop loss $0 I'll HODL

Looking for a replacement for trading Twitter shares?Now that Elon Musk’s buyout of Twitter has been completed, and the company has been taken off the trading market, what comparable stocks can traders look to trade now?
Of course, there are other social media compatriots that traders could turn to, or even other companies of a similar market capitalisation that are in takeover talks and abiding by a similar volatility. A stock that might just fit the bill could be the social media outlier; Pinterest.
Pinterest sometimes likes to position itself as the antithesis of Twitter and Instagram, where users find inspiration rather than encountering toxicity and developing body-image disorders. While I can't speak to the truthfulness of this claim, Pinterest is still categorised as a social media platform and its stock price can be affected by some of the same micro and macroeconomic events that affect this sub-sector. As such, and as illustrated on the chart, Pinterest and Twitter have followed a very similar stock price trajectory. This parallel in stock prices would have been a lot closer if not for Musk’s bid for Twitter at an inflated price in April 2022, and the subsequent court battles that led to him eventually completing the buyout.
Pinterest, like Twitter, may also start fielding takeover bids, hopefully at a chunky premium.
In October 2021, PayPal offered $45 billion for Pinterest, which would have been the costliest acquisition of social media company since Microsoft bough LinkedIn for $26 billion in 2016. The bid would have represented a premium of 24.5% over PINS share price the day before the announcement. However, PayPal reneged its bid shortly after offering it when investor sentiment proved to be against the deal, and PayPal tanked ~12.0% in the three days after revealing an offer had been made.
As of November 2022, the value of Pinterest has slipped to $16.5 billion and may be a more attractive prices for other suitors to come calling, especially if the value that PayPal’s board saw in Pinterest (and that Paypal’s investors overlooked) has been retained. Perhaps suggesting this is true was Pinterest's third-quarter earnings report in the final week of October 2022. Pinterest reported that its third-quarter revenue increased 8% year-over-year to $685 million. Pinterest shares have surged ~11% in the last five trading days.
What make this remarkable is when you compare it to other social media and tech stocks, particularly Facebook which is down ~29%, and Alphabet (which owns YouTube) which is down ~8% since they reported their respective earnings around the same time last week. The latter has even been rumoured to be exploring an acquisition of Pinterest after Alphabet's CEO Sundar Pichai gave a coy response to a question put to him in September about targets the company was considering for takeover.

11/18 Iron Condor Idea (4:1)11/18 Expiration.
$158:$42 risk:reward (3.8:1).
+1 $30 call
-1 $28 call
--{current share price: ~$24}--
-1 $20 put
+1 $18 put

PIN: Gains will be capped?!Pinterest
Intraday - We look to Sell at 25.99 (stop at 27.91)
We are trading within a Bullish Ascending Triangle formation. Neckline resistance 26.00. Resistance could prove difficult to breakdown. We therefore, prefer to fade into the rally with a tight stop in anticipation of a move back lower.
Our profit targets will be 21.38 and 20.00
Resistance: 26.00 / 38.00 / 50.00
Support: 21.00 / 16.00 / 10
Please be advised that the information presented on TradingView is provided to Vantage (‘Vantage Global Limited’, ‘we’) by a third-party provider (‘Signal Centre’) . Please be reminded that you are solely responsible for the trading decisions on your account. There is a very high degree of risk involved in trading. Any information and/or content is intended entirely for research, educational and informational purposes only and does not constitute investment or consultation advice or investment strategy. The information is not tailored to the investment needs of any specific person and therefore does not involve a consideration of any of the investment objectives, financial situation or needs of any viewer that may receive it. Kindly also note that past performance is not a reliable indicator of future results. Actual results may differ materially from those anticipated in forward-looking or past performance statements. We assume no liability as to the accuracy or completeness of any of the information and/or content provided herein and the Company cannot be held responsible for any omission, mistake nor for any loss or damage including without limitation to any loss of profit which may arise from reliance on any information supplied by Signal Centre

All bullish signals, trying to go bullish, in time for earningsWe can see on the weekly it is trying to rise above the 50 ma line staying above the 10 ma. We see bullish rsi strength about to break above 50 the upper bullish rsi area. The dmi shows a bearish trend changing into a bullish trend. The ADX shows the previous bearish downtrend weakening and changing trends, as the dmi is wanting to cross to become bullish. This is the only other time the stock has had the strength, momentum, or volume as it seems to try to go back onto a bullish path. Right now could be the end of the stage 1 consolidation period, time to accumulate, and entering the breakout stage 2 uptrend, it's rally.. this is all happening the day before earnings, so it might be in good interest to go Long or enter into a call position expiring after earnings.

Pinterest short positionPinterest short position
Entry level: 23.02$
Take profit: 20.44$
Stop loss: 24.14$

PINS: Double top confirmation opens the downsidePinterest
Short Term
We look to Sell at 22.15 (stop at 23.35)
Posted a Double Top formation. Bias is mildly bearish today but we need to see a break of 21.25 to confirm the downward pressure. Further downside is expected although we prefer to set shorts at our bespoke resistance levels at 22.15, resulting in improved risk/reward. The previous swing low is located at 16.78.
Our profit targets will be 17.35 and 16.15
Resistance: 22.78 / 24.00 / 26.30
Support: 21.25 / 20.42 / 16.78
Please be advised that the information presented on TradingView is provided to Vantage (‘Vantage Global Limited’, ‘we’) by a third-party provider (‘Signal Centre’). Please be reminded that you are solely responsible for the trading decisions on your account. There is a very high degree of risk involved in trading. Any information and/or content is intended entirely for research, educational and informational purposes only and does not constitute investment or consultation advice or investment strategy. The information is not tailored to the investment needs of any specific person and therefore does not involve a consideration of any of the investment objectives, financial situation or needs of any viewer that may receive it. Kindly also note that past performance is not a reliable indicator of future results. Actual results may differ materially from those anticipated in forward-looking or past performance statements. We assume no liability as to the accuracy or completeness of any of the information and/or content provided herein and the Company cannot be held responsible for any omission, mistake nor for any loss or damage including without limitation to any loss of profit which may arise from reliance on any information supplied by Signal Centre.

PINS daily bullish hammerOrder BUY PINS NYSE Stop 23.40 LMT 23.40 will be automatically canceled at 20230401 01:00:00 EST
PINS daily bullish hammer 1.2R

PINS - potential golden cross?PINS has been forming a round bottom basing pattern for the past 6mths and is already starting to cross above it's 200 day moving average. There is a good chance that we could have a golden cross (ie 50d MA crossing above the 200d MA) in the near future and WHEN that happens, then a firmer uptrend could be underway.
Meanwhile a retest of it's recent pivot low @ 22 (which is also its 50day MA) is still possible but likely not to breach this level.
Disclaimer: Just my 2 cents and not a trade advice. Kindly do your own due diligence and trade according to your own risk tolerance and don't forget that money management is important! Take care and Good Luck!

PINS monthly put Order SELL PINS JAN 17 '25 12.5 Put Stop 6.50 LMT 6.50 will be automatically canceled at 20230401 01:00:00 EST
Wave 5 of downtrend is around the corner and then at least ABC or 1-5 uptrend.
Be ready to move ask price to something more marketable towards the capitulation event.

$PINS with a Bullish outlook following its earnings #Stocks The PEAD projected a Bullish outlook for $PINS after a Positive over reaction following its earnings release placing the stock in drift B.
PINS: Putting in a rounding bottom or going for a nosedive?PINS has been stuck in a pretty wide trading range for the majority of the year. In September it looked like the stock will make a push for the upper range but last week cold water got poured on it. Now I am looking for a couple of specific things for an entry. Next week or next two weeks I am looking for a retest for $21 - $20 support region (wave 1 area of the diagonal structure) and not a break below $18. If that holds, I would look for a rally into the upper range $27 - $30 area. I will be keeping a close look on RSI for a negative divergence between wave 3 and wave 5 on the daily timeframe. On the weekly timeframe, there might not be a divergence on RSI, but it should retest the resistance area. From there it should be a nice short setup for a minor wave 2 or in the worst-case, wave Z (of wxyxz). In case of wave 2, it should be sharp and violent drop towards $18 after coming out of an expanding leading diagonal. If wave Z, it can drop to previous all-time low area but should be rather slow and steady. in any case, the short entry should be profitable. After that, I'd look for a 5 up and 3 down move for the next long entry, most likely towards the end of year. The chart should paint a cup and handle type pattern. Current market environment is very challenging and thinking about any support holding feels like a pipe dream; when Dow and major indices are breaking support. But some charts are looking rather interesting not to ignore.


PINSstill in a bigger bottom formation.
buying and waiting..
if the breakout of $27 comes - we should see a bigger upwart move.
the longer the formation needs - the bigger is the following move....
