WDAY trade ideas
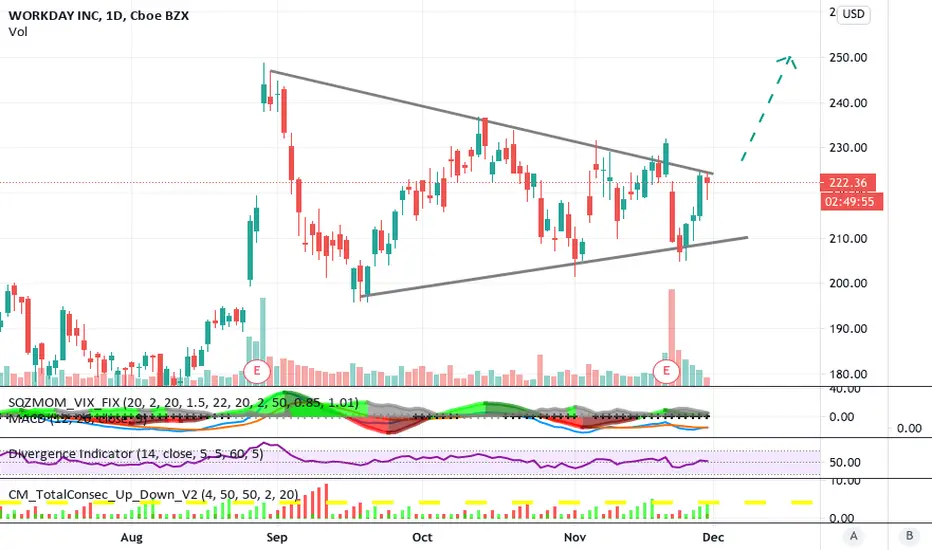
WDAY, enters Uptrend as Momentum ascends above 0 levelThis indicator may be signaling that WDAY's price has momentum to move higher, since its current price exceeds the price logged 14 days ago. Traders may consider buying the stock or exploring call options. Tickeron's A.I.dvisor backtested 88 similar cases where WDAY's Momentum Indicator exceeded 0, and 71 of them led to a successful outcome. Odds of Success: 81%. Current price $221.20 crossed the support line at $224.31 and is trading between $224.31 support and $197.93 resistance lines. Throughout the month of 10/27/20 - 11/27/20, the price experienced a +5% Uptrend, while the week of 11/19/20 - 11/27/20 shows a -3% Downtrend.
Bullish Trend Analysis
The Stochastic Indicator suggests the stock price trend may be in a reversal from a downward trend to an upward trend. Tickeros A.I. detected that in 38 of 51 cases where WDAY's Stochastic Oscillator exited the oversold zone resulted in an increase in price. Tickeron's analysis proposes that the odds of a continued upward trend are 75%.
The Momentum Indicator moved above the 0 level on November 27, 2020. You may want to consider a long position or call options on WDAY as a result. Tickeros A.I. detected that in 71 of 88 past instances where the momentum indicator moved above 0, the stock continued to climb. The odds of a continued upward trend are 81%.
The 10-day Moving Average for WDAY crossed bullishly above the 50-day moving average on November 13, 2020. This indicates that the trend has shifted higher and could be considered a buy signal. Tickeros A.I. detected that in 13 of 16 past instances when the 10-day crossed above the 50-day, the stock continued to move higher over the following month. The odds of a continued upward trend are 81%.
Following a +5.03% 3-day Advance, the price is estimated to grow further. Considering data from situations where WDAY advanced for three days, in 242 of 341 cases, the price rose further within the following month. The odds of a continued upward trend are 71%.
WDAY may jump back above the lower band and head toward the middle band. Traders may consider buying the stock or exploring call options.


WDAY ChannelingWDAY, due to earnings, dropped significantly. On the 4 hr, It crashed through the 100 MA, and hit the 200 MA. 200MA served as good support previously and finished the day as a doji.
Bullish pattern showing.

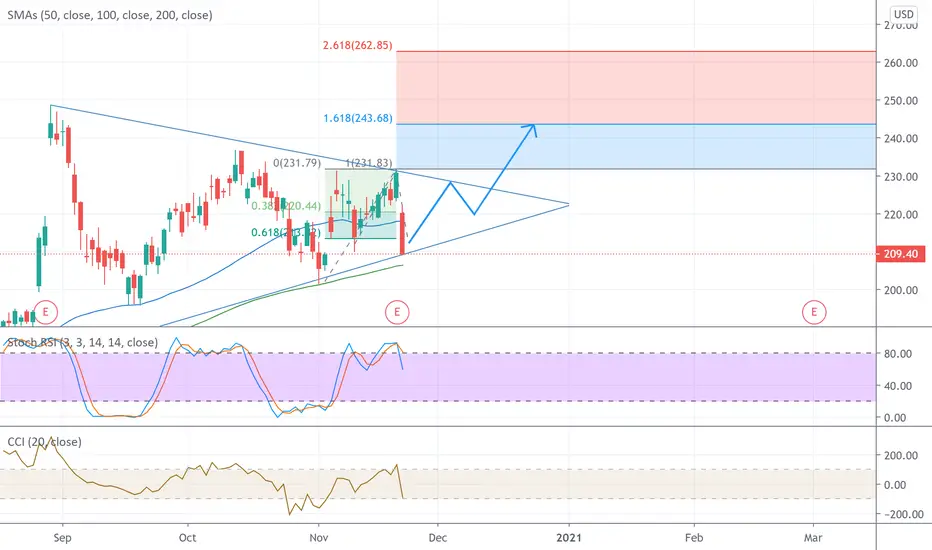
$WDAY Trend Based Fib ExtensionMy analysis: I'm expecting WDAY to bounce. Target at $243 on a wave 3. Could also be bull flag in wave 4 looking at breakout for wave 5.
Thoughts?
"I'm not an expert but I have watched a number of youtube videos"
NASDAQ:WDAY
Symmetrical TriangleA S Triangle can go either way/up or down
WDAY broke up from an ascending Triangle and had quite a rally
Back to where we started from almost. )o:
I have found the market is not to be taken for granted and a strong rally can be followed by a tough decline...moves are not always repeated in the near term
The top trendline of prior A Triangle is at 199.09 and may provide support
There is also a gap there which may provide support
The symmetrical triangle, which can also be referred to as a coil, usually forms during a trend as a continuation pattern. The pattern contains at least two lower highs and two higher lows. When these points are connected, the lines converge as they are extended and the symmetrical triangle takes shape. You could also think of it as a contracting wedge, wide at the beginning and narrowing over time.
While there are instances when symmetrical triangles mark important trend reversals, they more often mark a continuation of the current trend. Regardless of the nature of the pattern, continuation or reversal, the direction of the next major move can only be determined after a valid breakout.
Not a recommendation
$WDAY broke out before earningsMade the breakout just minutes before earnings after the close. Let's see if it holds in tomorrow's trading session.

$WDAY setting up for its next run higher$WDAY is building a very constructive pattern possibly setting the stage for another run higher.
* Decreasing volume within the pattern structure
* 6 small candle stick bodies in the last 7 days indicates contraction in volatility (the calm before the next move)
* 3 higher lows (identified with green lines on the chart) indicates buyers stepping in and seeing value at higher prices
The red dotted line on the chart is the high back from July 2018. A daily close above that level will also break the down trending trend line and trigger a long trade entry.

ascending triangle to retest c&h resistancecup and handle failed to push past resistance on October 13. trying again with earnings coming up this week while forming an ascending tringle.


WDAY Longer term Wave (iii) Bullish Our WDAY longer term holdings is moving in and out of money. We are looking for a wave iii push higher into 275 once this consolidation is complete. The daily count shows we could be in a sideways market here but we will be holding on to our long-term holdings in long WDAY positions.

+30% profit in 14 days ( OLD chance ) in August I TRADED IT .Market is generous for good students and ruthless for bad ones.
It takes years to learn how to spot the best patterns and trade them (CORRECTLY) .
Don't rush your process of learning , stay humble and get a mentor or education .
If you have patience market will reward you always generously .. If you aren't the market gonna beat ur a## and makes you broke with a blink of an eye .
BTW, i don't post all my ideas here . I post only some.

Cup and Handle Ascending TriangleWDAY had a super fast rally and a deep pull back
Support at top of A Triangle would be strong
I am hoping it does not pull back that far but has pulled back further than i thought it would already
Kinda looking like it may pull back to initial gap up (but could be a mirage) (o:
Long entry is higher than the support I see. But we all se something different/don't we?
Long when support is found
Be safe
Not a recommendation

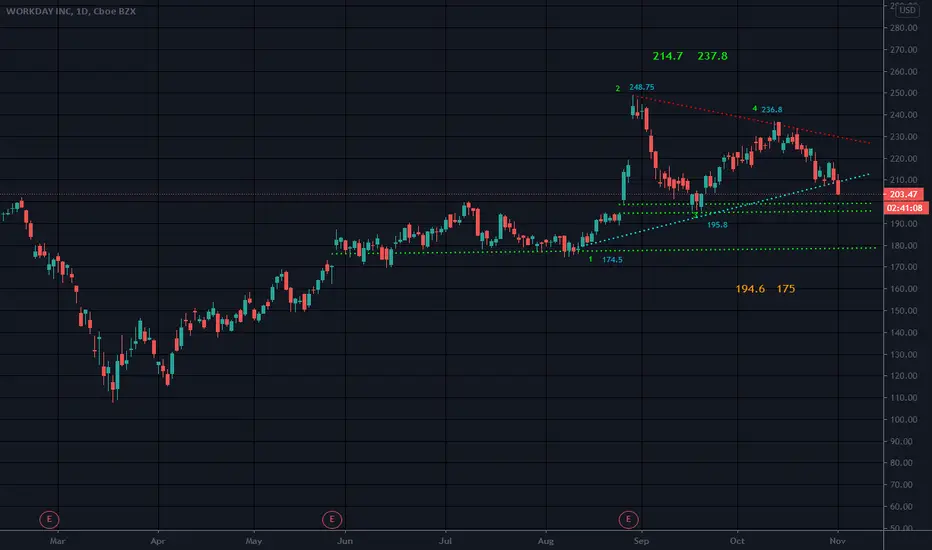
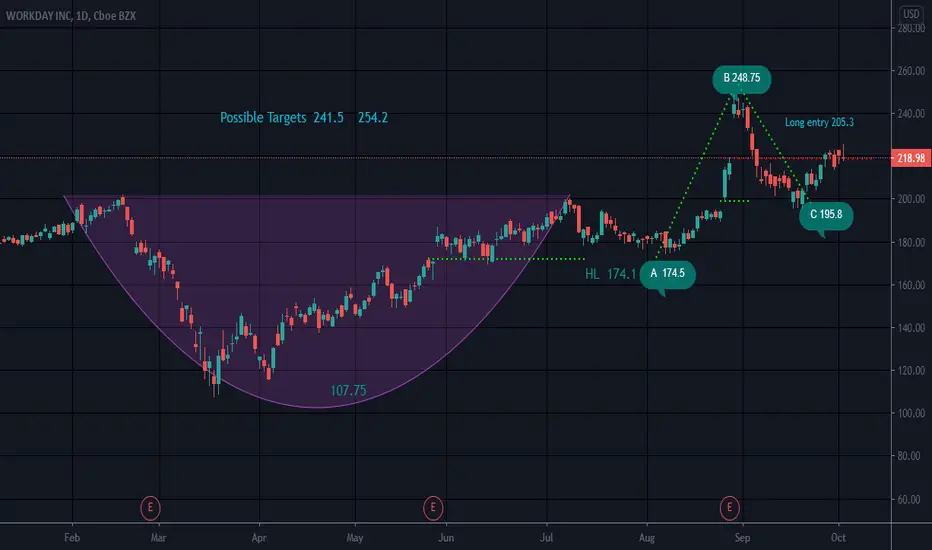
ABC BullishPossible Stop below 195.8
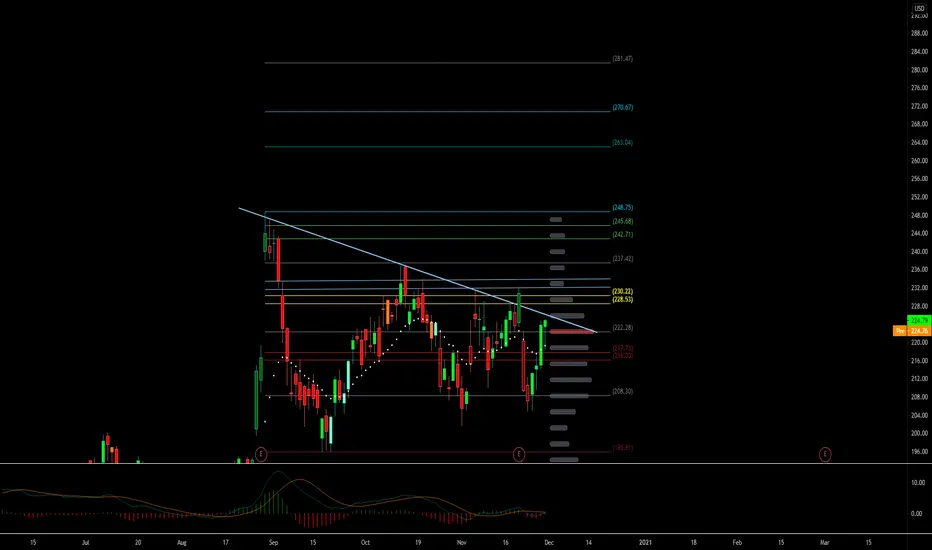
Possible T2: 290 to 316
WDAY also was in an ascending triangle pattern that broke to the upside at 202ish but will also provide support.
Broke from a C&H pattern so the handle low will also serve as support
Seems to be hitting R from prior gap up at 218ish
Catch this if you want it at a price that works for you
Not a recommendation
WDAY: WorkdayProvides cloud based applications for finance and human resources.
Stable company, sales ang growth. Good prospects in the next two years.

WDAY Long Setup, Trade Update Our long entry on WDAY was triggered moving in and out of money but the focus is on larger degree wave (5) move that might target the 290-300 level. Notice a breakout and a minor pullback that is a good zone for additional longs on WDAY. Look to hold on to existing Long position on WDAY into Dec 2020.

WDAY Retest/RemountWDAY had previously broken out from a resistance level of 200 range and had run significantly upward. That 200 range now acts as support. It has come down back from the breakout levels to test support again. It has remounted back over 200 and bounced off 50 simple moving average. I'm looking for bullishness in this name now back to 215 and beyond.


Cup and Handle Gap Ascending triangleHopefully the tail of a red candle has filled the gap up at earnings at 201ish from a few weeks ago. Top of A triangle has provided support. I should add first target may now be 217.6ish due to R at gap that WDAY will encounter
WDAY was flying..then it seems like it says to itself.."I left a gaps down there and I have to go fill them" lol..bummer!
Filled gap at 217ish on way own and made it all the way back to b/o level and looks to have filled it with a tail of a candle
Maybe a classic case of going up too much too fast. Now there will be R at 217ish though
I think it will return to duty now that gaps are filled. At least I hope so. I sold this day after earnings because it was overbought and I missed a big move. But it is back again so watching.
Watch for R overhead and trade safely
Not a recommendation
