WDAY trade ideas


WDAY Breaks Through ResistanceWorkday has been in a trading range since February. It recently broke through the resistance level at the highs. It now must sustain the price gains above the highs to form a new support level.


$WDAY WORKDAY, ITS TIME TO RING THE REGISTERWhat a fabulous stock to have owned, even in December when the market was getting hammered it actually had a strong earnings pop. It is apparent that to us that now is not the time to be buying but maybe wise to take profits.

WDAY put saleBeen looking for a good pullback on this in order to sell some puts. Great earnings and growth company if I do get put shares.


WDAY is heading 230 area within next earning. Buy now 30+ profitLong term best in class ... heading 250in 1 year ..

Long WDAY - target reachedNice breakout and initial target reached. Potential for more upside if market is favourable.
May have some profit taking. Look for good re-entry set up.


WDAY - retracement - shortShort WDAY for the next three days. Believe there will be volatility in the overall market due to FOMC and interest rates on the 18th and 19th.

WorkDay (WDAY) -- Short Call Vertical 8-Day Short Call Vertical Option. 5 Days left until Expiration. Short Call at 180. Long Call at 182.5. As long as price does not get to 180 in 5 days, 18% profit. Current price is 160.
Message me for questions.

$WDAY Bearish Shooting Star$WDAY Bearish shooting star candlestick forming on weekly chart, expecting to close the week within upper channel limit (i.e. <= $165). The stock shot up from Nov 20th low of ~$118 to up over $170 within two weeks (44% gain)...eventually gravity catches up - retracement already underway.
Targeting $140 level by mid-January.
Note: Informational analysis, not investment advice.

$WDAY - After String Earnings, Expect a Pull-Back Off ResistanceNASDAQ:WDAY showing resistance at the top of the trend channel. A good place to short here with a price target at the bottom of the gap. Stop being the new all-time high made today.

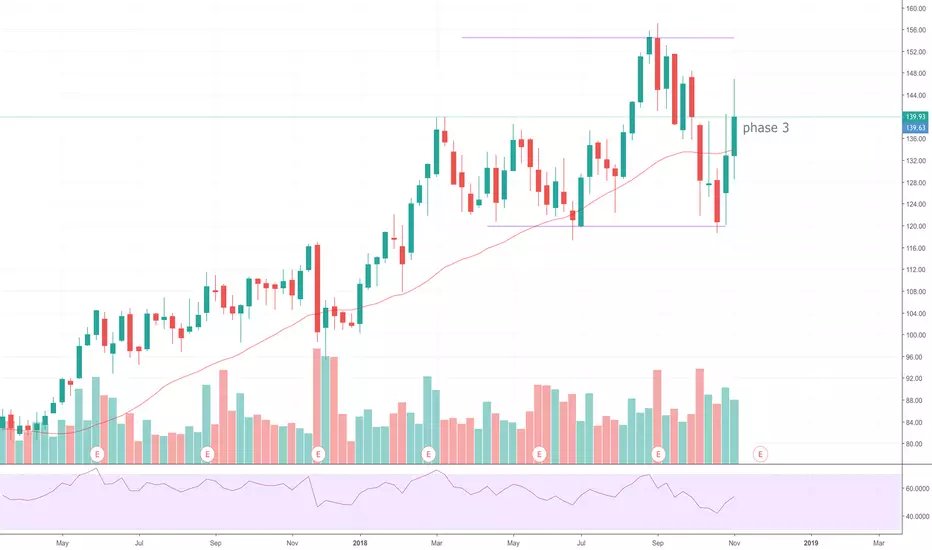
[WDAY] phase 3The price is going up. It's above the 30MM. Speak of 30MM; its slope is positive so, maybe it will continue to phase 2.
WDAY looks like it wants to make a move, but which way?WDAY seems ready to move a move to either side although down seems more likely since it had a big move up in the recent months. Short looks good below $136, or if the level holds long on the break of short term Trend line.
DISCLAIMER: This is not a financial advice, so please do your due diligence.
Also for more in-depth analysis of our trade ideas please check out our YOUTUBE channel @PMT Trading.

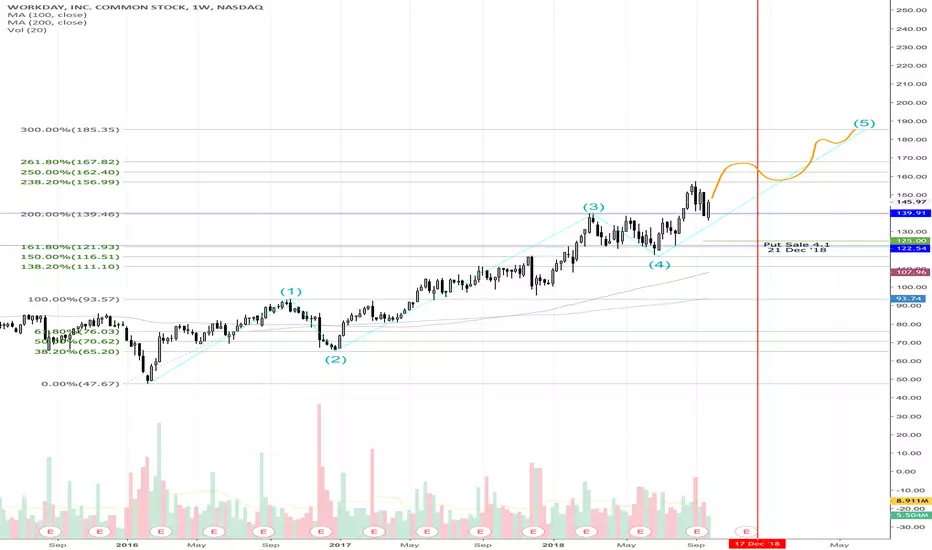
WDAY Fib and S Curveangles for wave 1,2 and 5 are all the same and 5 ends at the 300% Fib line. WHere I sold a Put was a good place to buy based on this analyis, will watch it for a more long term entry.
Solid Trend
$WDAY Overbought at Channel Resistance$WDAY Workday deep into overbought territory now on the daily chart, with an earnings release coming early next week.
For a company still not making any money, it feels like a beat is already priced in. In my opinion, it would require a substantial beat and a positive guidance adjustment next week to get it over $155 in the near term. I'm expecting a correction post-earnings.
Two possible near/medium term targets on chart.
Note: Informational analysis, not investment advice.

$WDAY - Top CalllaaaaaaBeen had this one on watch because the setup is always a reliable one that uses the white curve (55 low MA) as a top caller based on the curve of the lows where 55 low uses 180 WMA as resistance - price drops as the white curve slopes to the most upward point without crossing over the blue 180. I tend to use the red vertical line just as a reference point to where the white curve either A) start of the 55 candle count makes higher lows (hence, white MA slopes upward) or B) start of the 55 candle count makes a few higher lows (white MA slopes upward) but is short lived, & continues making new lows (hence, white curve slopes upward temporarily, but the new lows add to the resistance point not being crossed). This is typically a setup I see with upcoming earnings - but $WDAY doesn't have earnings until Sept. 4th - so I'm kinda going out on a limb with this one, because it's usually a home run short entry regardless of earnings beat/miss. Regardless, as long as I don't see the cross of 55 low MA above the 180 WMA - ideal target price is @ or around $126-$130. I'll leave a few examples
Ex. 1 -
Ex. 2 -

WDAY up against resistanceTwo resistance levels ahead for WDAY to cross. If it can break out, off we go. We'll find out in next couple of days.

WDAY looks interestingRiding that line, earnings coming out tomorrow; which way do you think it'll go?
Long June 15 calls so I'm praying it pops!
