BTC Cheat Sheet FinaleThis is a fresh chart update of BTC's cheat sheet idea and tracking TA, following 2013 to 2017 Bars pattern along with key macro trendlines. April fools edition!
BTCUSD.P trade ideas

History never repeats itself, but it does often rhyme.Max fear this month. If history rhymes good we can see some relief in January. Gonna leave this idea to see how it is going after 2 years. Happy New Year! Cheers!

BTC Consolidation "Schedule" Ok so first, we all know the markets wont follow this "schedule"...but here's my theory on a potential timeline based on an ABCDE count that may play out as a triangle or a falling wedge.
Trade smart & buckle up for the ride!

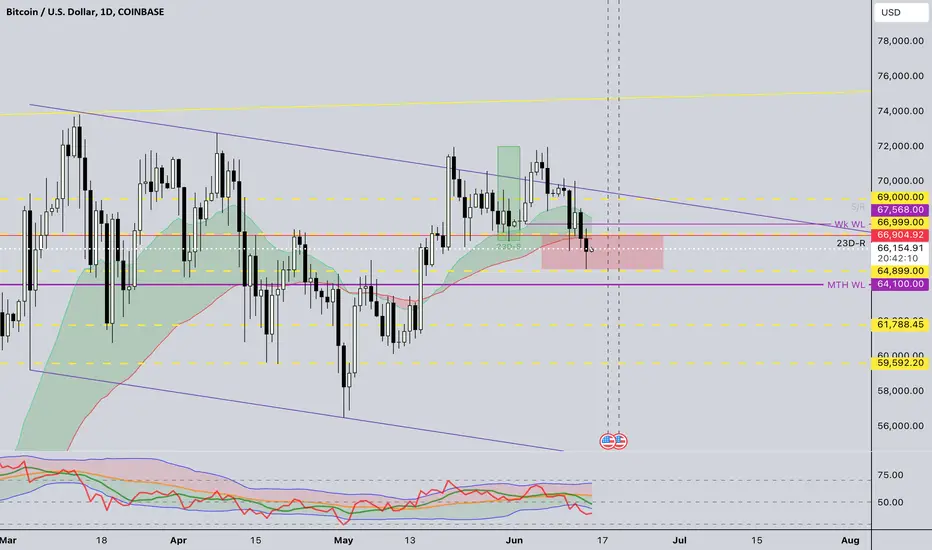
Bitcoin (BTC): Monthly Opening / Pushy Market / Fakeout To 50K?First week of the new month is here and we are seeing some upward momentum here, pushing the upper resistance zone (potentially going for a fakeout).
We are looking at current zones, which are $69-71K which are a huge point of interest for us for a potential fakeout zone right there.
But this is not mandatory, as we are near correction phase where accumulation has already happened and is about to end and now that Bollinger Bands upper and lower lines are tightening, we see a good chance for breakdown to happen soon.
As you all know, we have major target zone, which is $50K, so let's see if June will be the month for it 😉
Swallow Team

Jun.11-Jun.18(BTC)Weekly market recapAfter the CPI data released by the Labor Department last week showed that inflationary pressures further eased in May, BTC and US stocks rebounded significantly, covering the decline caused by the previous employment data.
However, in the subsequent FOMC, the dot plot showed that the median number of interest rate cuts this year was one, which was lower than the market expectation of two. And at a later press conference, Powell said that inflation had further eased, but was still higher than planned. This takes into account the CPI. The markets fell on the news
High market sentiment was cooled. In the next half month, crypto continued to fall as the main trend, and during this period, there may be a rebound due to the listing of the ETH ETF. The trend will maintain until economic data of June is released.
BTC has fallen with fluctuation in the past seven days and missed the opportunity to refresh ATH, but its performance was stronger than most tokens. It can be seen from the WTA indicator that after the CPI data was released, blue columns representing whales participated in transactions. The rate of decline slows down. Trading volume is consistent with the past. The ME indicator continues to maintain a bullish trend, and the wavy area further narrows.
To sum up, we believe that BTC will continue to lead the market correction in the short term and remain fluctuation in the medium term. We maintain our original resistance level 74000 and support level 61000.
Disclaimer: Nothing in the script constitutes investment advice. The script objectively expounded the market situation and should not be construed as an offer to sell or an invitation to buy any cryptocurrencies.

ANALYSIS BITCOIN Bitcoin (BTC/USD) with various technical indicators and levels marked on it. Here’s an analysis based on the chart provided:
Key Observations:
Price Levels:
Current Price: 67,271 USD
Major Support: Around 63,001 USD
Major Resistance: Around 78,900 USD
Fibonacci Levels:
0.618 Retracement: 70,062 USD
1.0 Extension: 78,900 USD
1.618 Extension: 84,315 USD
2.618 Extension: 90,925 USD
VWAP (Volume Weighted Average Price):
Weekly VWAP: 65,772 USD
Liquidity Heatmap:
Shows regions of high buying and selling interest. There are significant liquidity zones around the 63,000 USD (support) and 78,900 USD (resistance) levels.
Trend Lines:
Dashed lines indicate potential future trends or breakout points.
Projected Move:
There is an orange projection indicating a potential sharp upward movement targeting the 78,900 USD level.
Analysis:
Support and Resistance:
The current price is hovering just above the weekly VWAP, which is a crucial support level.
If the price breaks below the 65,772 USD level, it might find support at 63,001 USD, which aligns with the Fibonacci retracement and the liquidity heatmap.
On the upside, significant resistance is expected around 78,900 USD, which is a confluence of the 1.0 Fibonacci extension and liquidity heatmap.
Fibonacci Retracement and Extension:
The price needs to break above the 0.618 Fibonacci retracement level (70,062 USD) convincingly to confirm a bullish trend towards the 1.0 extension at 78,900 USD.
Beyond that, the 1.618 (84,315 USD) and 2.618 (90,925 USD) extensions indicate potential longer-term targets.
VWAP Analysis:
Trading above the weekly VWAP suggests a bullish bias. The price is currently consolidating above this level.
Liquidity Zones:
The heatmap indicates heavy liquidity around the 63,000 USD level (support) and the 78,900 USD level (resistance). These zones can act as potential reversal points.
Projected Move:
The sharp upward projection suggests that if the price holds above the current support levels and gains momentum, a rapid move towards the 78,900 USD resistance is possible.
Strategy:
For Bulls:
Look for long entries around the current VWAP (65,772 USD) with a tight stop loss below 63,000 USD.
Target the 70,062 USD level initially, with a potential extension towards 78,900 USD.
Monitor price action around key resistance levels for potential profit-taking or further continuation.
For Bears:
Watch for a breakdown below 63,000 USD for potential short entries, targeting lower support levels.
Alternatively, consider short positions around the 78,900 USD resistance if the price shows signs of reversal.
Conclusion:
The chart indicates a potential bullish scenario if the current support levels hold, with targets towards 78,900 USD and beyond. Traders should watch key levels and liquidity zones for confirmation and manage risk accordingly.

Buyers Defending BTC at $65000Buyers are defending BTC at $65000 levels after a break of HS at $67000 levels. $65000 level was tested ones on 16 May 24 and recently 15 Jun 24. It was also 1 Apr 21 ATH. If broken, more to the downside.
Bullish BTC TargetsDear Friends,
Welcome Back. Like I said before, I am feeling bullish because charts say it all. I plan to buy on each dip as we are in bull market. Will inform if I have a change of mind. Till ten Have a wonderful days
Not a Financial advice. Please trade responsibly and spend only that you can loose without disturbing your normal life. You know your financial limits better then me:)

BTCUSD will remain downIn bigger picture I am seeing BTCUSD to come upto 50k in coming days but it will take 2-3 month, however in short term my target is 60-61k

BTC / USD Monthly ChartHello traders. We had another nice 10% dip, where I bought some more sats to add to the Bitcoin coffers. We could have a few more months of this sideways, ranging, pre parabolic reaccumulation phase before we take off. We are in a time where leveraged traders may be getting smoked as well as a normal post halving range. Most people do not realize that even at this price, buy Any bitcoin would be a step in the right direction. This is the last chance for regular people to get in before the supply / demand shock set in and makes Bitcoin go insane. BIg G gets all my thanks. Patience is key, as is being thankful for what we have. Be well and trade the trend. This post was a pep talk for anyone getting nervous or starting to freak out a bit. Just hit some dabs, relax and enjoy this ride.

#BTC / USD - 2024-2027Following my previous post we are on a track to the final goal.
P.S I am working on my prediction algorithms that based on real time BIG orders fulfilment to predict short tern price prediction just for a speculations trading :-) I would like to invite everybody who are interesting.

BITCOIN BULLS ARE BACK !Referencing my chart, its imperative for bitcoin to make new highs. 75000 is the next price for TP. The price has the answers


BTCUSD - 1H another fallOn the BTC/USD 1-hour chart, Bitcoin faces resistance around $70,200 and may pull back to hunt stops below the recent low of $68,300. This suggests a potential short-term decline before any further upward movement.

Potential bullish rise?Bitcoin (BTC/USD) is falling towards the pivot which has been identified as a pullback support and could bounce to the overlap resistance.
Pivot: 65,972,81
1st Support: 64,589.11
1st Resistance: 70,123.94
Risk Warning:
Trading Forex and CFDs carries a high level of risk to your capital and you should only trade with money you can afford to lose. Trading Forex and CFDs may not be suitable for all investors, so please ensure that you fully understand the risks involved and seek independent advice if necessary.
Disclaimer:
The above opinions given constitute general market commentary, and do not constitute the opinion or advice of IC Markets or any form of personal or investment advice.
Any opinions, news, research, analyses, prices, other information, or links to third-party sites contained on this website are provided on an "as-is" basis, are intended only to be informative, is not an advice nor a recommendation, nor research, or a record of our trading prices, or an offer of, or solicitation for a transaction in any financial instrument and thus should not be treated as such. The information provided does not involve any specific investment objectives, financial situation and needs of any specific person who may receive it. Please be aware, that past performance is not a reliable indicator of future performance and/or results. Past Performance or Forward-looking scenarios based upon the reasonable beliefs of the third-party provider are not a guarantee of future performance. Actual results may differ materially from those anticipated in forward-looking or past performance statements. IC Markets makes no representation or warranty and assumes no liability as to the accuracy or completeness of the information provided, nor any loss arising from any investment based on a recommendation, forecast or any information supplied by any third-party.

Slowing Inflation Data Brings Positive Price Action to Bitcoin
The US CPI remained flat in May, beating forecasts and lifting bitcoin prices by nearly 4% on Wednesday: But bitcoin prices quickly retreated on Thursday as traders grappled with the possibility of just one rate cut by the Federal Reserve by the end of the year.
Trump voices support for Bitcoin mining at Mar-a-Lago: President Biden’s campaign also consulted the crypto industry on his digital asset policy.
Gensler confirms spot ether ETFs are coming soon: In a Senate Banking hearing on Thursday, SEC chairman Gary Gensler said he expects spot ether ETFs will begin trading this summer.
GameStop's stock drops 12%, impacting related meme tokens: The dip comes after recent highs and announcements of new share sales and declining quarterly sales.
HSBC Bank's China branch begins offering e-CNY services to corporate clients: It’s the first foreign bank to support the digital yuan to facilitate transactions and asset management.
The ZKsync Association will airdrop 3.675 billion ZK tokens next week: Early users and contributors will receive the distributions, with claims available until January 2025.
🗝️ Topic of the Week: Crypto and Retirement Accounts: 401ks and IRAs
👉 Read more here

57 ???? The movement of Bitcoin was represented by the late copy in yellow.... The copy was extracted from the bottom of 15 thousand, and it is still valid and correct. Now, will he follow the copy? As is the subject...look at the drawing and know the details

Bitcoin's Path to $90,000: Analyzing the Head and Shoulders PattIn the daily timeframe, Bitcoin is forming a significant head and shoulders pattern, suggesting a potential target of $90,000. Historical analysis highlights a seasonal trend that typically initiates bullish momentum for the leading cryptocurrency during this period of the year, a trend observed consistently over the past decade.
Moreover, historical data from previous halving events indicates that Bitcoin's price tends to surge by approximately 125% in the year following a halving. Given Bitcoin's starting price of $44,000 at the beginning of 2024, a similar increase would propel its value to around $99,000. Should this halving event mirror past impacts, Bitcoin could approach the $100,000 milestone by the end of 2024.
However, an additional factor influencing Bitcoin's potential upward trajectory is the potential introduction of spot Bitcoin exchange-traded funds (ETFs). These financial products could attract significant institutional investment, further bolstering Bitcoin's market value beyond current expectations.
Overall, with the combination of technical patterns like the head and shoulders formation and historical trends from halving cycles, coupled with potential catalysts like Bitcoin ETFs, the outlook for Bitcoin in 2024 appears promising for investors eyeing substantial price appreciation.

Market Crash - BTC Rejection BTC had a hard rejection after rallying on the CPI print, but failed on a retest of it's previous trendline support. Now it's sitting back at demand, bulls need to defend here or it's likely headed towards $50-$60k. Not looking great for inflation assets in this overnight session, but we'll see what the morning brings.

ALERT: BTC GOES TO ZERO AND THE MARKET COLLAPSE BEGINSI saw the warning signs and thought it was going to be a good opportunity to buy but the big money has already exited. You can't even get your money off the exchanges anymore. BTC is going to zero and I the Global economic crisis begins. A trillion dollar industry will be wiped in the next 48 hours. The chain of events that are going to follow will be nothing less than biblical. I'm praying for you all. Best wishes in the days to come ya'll. We got a hard road ahead of us

BITCOIN Retesting the 1D MA50. Is it alarming?Bitcoin (BTCUSD) has been practically consolidating since the May 21 High and the recent pull-back of the past 5 days is starting to inflict a certain degree of fear in the market again. So far the effect is only on the short-term as yesterday, the 1D MA50 (blue trend-line) was tested (first time since May 17) and held.
This is something we have seen before on February 06 2024 and October 14 2023. All 1D MA50 re-testings have taken place after the price broke below the 1D MA50 (blue arc) and formed the bottom of the Bearish Leg. The pattern can be easily classified into phases, with BTC trading within the Mayer Multiple Bands (MMB) Mean and the MMB 2SD below. A Channel Up follows after each 1D MA50 test that approaches the MMB.
The only parameter that's left to confirm the start of this (blue) Channel Up that will test the MMB is the 1W RSI to break above its MA level (yellow trend-line). As you can see 100k following that, is a rather conservative technical Target within this pattern.
Do you think that critical psychological level will get hit following this pattern? Feel free to let us know in the comments section below!
-------------------------------------------------------------------------------
** Please LIKE 👍, FOLLOW ✅, SHARE 🙌 and COMMENT ✍ if you enjoy this idea! Also share your ideas and charts in the comments section below! This is best way to keep it relevant, support us, keep the content here free and allow the idea to reach as many people as possible. **
-------------------------------------------------------------------------------
💸💸💸💸💸💸
👇 👇 👇 👇 👇 👇

🅱️ Expert Confirms: Bitcoin Set To Crash Below 30KSignals are available everywhere... And new data is coming in all of the timing.
The market is great.
Even though we get confirmation after confirmation, doubts still creeps in.
Even though we see the market moving just as we would expect it to move based on the cycle, sentiment and chart signals; confirmation after confirmation, for real.
Somehow, each time there is a small rise in price doubt creeps in.
➖ Will Bitcoin move to hit a new All-Time High next?
➖ Is the correction over?
➖ How can I be certain prices will not continue higher?
➖ How can I be certain prices will continue lower?
"Bitcoin is trading above $60,000 after all and that's pretty strong."
Well, actually, below 70K is ultra-bearish after a new ATH at 74K, but this is not the topic for this update.
In early 2022 we were discussing here on TradingView the bear-market that was developing for Crypto and how far down Bitcoin would go.
We were dead set on finding the target and as you know, we shared hundreds and hundreds of charts. All of us, the different players.
After a while, we decided that Bitcoin was going to settle around 20K because that was the 2017 ATH. We concluded that the bottom would happen in June or November 2021 and reach several others and varied conclusions.
We all agreed and everything was clear; it was early 2022, we still had a long way to go before reaching 20K; Bitcoin crashed below 20K and yes, even 15K was tested as support.
A certain public figure, I won't name any names, said in early 2022 that Bitcoin would move lower but stay above 30K. It doesn't matter what happens it would never go below 30K... Bitcoin was trading in the 40Ks at the time.
Sure enough, that was the signal...
Bitcoin crashed and did not move below 30K but went even lower and hit below 16K.
The same character is now saying that "Bitcoin will stay in $55K to $75K zone for now" ... This means that the crash is confirmed and it is going below 30K.
Namaste.

BTCUSD new update
Hi, Today is a good moment to enter long at BTC, because we already reach fibonacci support zone at 64K-66K.
This is a strong support area, since BTC stuck at 1 month consolidation.
If fibonacci support able to hold bearish, Our target at $71.933
sorry for late update, coz I have a heavy schedule with my student. But I will try to update this analysis if I found a new key level.
Thanks, Happy trading
