Short term SHORT Downtrend market structure in confluence with 61.8% fib levels and downtrend line support
Wait for double top on the M15 timeframe
#enjoytheprocess
BTCUSD.P trade ideas

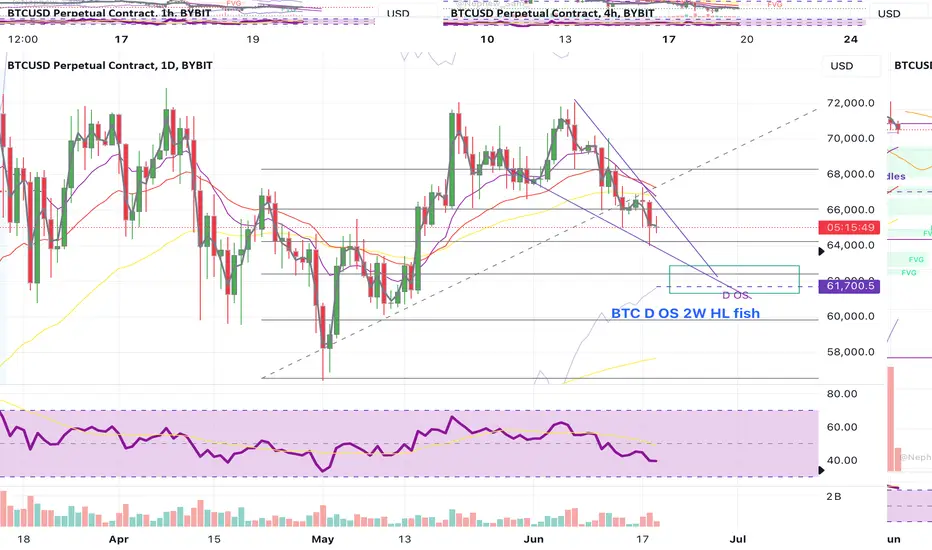
BTC keep it simple - play RSI Daily Oversold for the 2 week HLThis is the trade to focus on . B TC is currently grinding down the D and 4 H ema 12.
Wedge trading can be fun but a lot of work.
Better wait for clarity and buy some fear into Daily OS.
2 Week Higher low is the most likely scenario .
Also make a List of the strongest ALTS that you wanna play for the bounce.
mine is :
ETH ; PENDLE , UNI; MKR
Simple Bitcoin analysis (Long Term) Higher no matter what?Let's keep things simple on a daily since the chart patterns seem to make the most sense here. As you can see when Bitcoin formed a double top on the daily it was all downhill from there. Now it is forming a cup and handle pattern on the daily time frame - So it will most likely just be massively up from here. Don't say I didn't warn you that the TA should be kept simple when trying to guess long-term moving averages. Pay attention to the support line I drew. BTC will never go below this line. If it does I will delete my account.

LONG X 50 HIGH PRECISION ODER FLOW TRADINGBTC futures leverage x 50 LONG ✅
Entry Point : USD 65300
Target : USD 68500
Stop Loss : USD 64700
Stall Brake : ??? USD
Leverage is extremely risky and must be executed with money that we are willing to lose or hit the stop loss.
Trading is the only profession in which the only person responsible for our actions is ourselves, our worst enemy is ourselves, here there is no one to blame, this is not a collective work, the only one who presses the sell button buy and know how much you invest and where to put a stop to losses, it is you, and only you, so always remember that.
Important note: THE LEVEL OF LEVERAGE OR LEVERAGE, the alert for taking early profits, loss stop adjustment and forced operation closure are not done by this means.
And also remember to always have control over your losses, focus on this and you will last.
Comment: WARNING!!!!
I AM NOT A FUTUROLOGIST, I DO NOT MAKE PREDICTIONS, I DO NOT DO ANALYSIS,
I AM 100% A MARKET OPERATOR, I WORK BASED ON MY EXPERIENCE, CONSISTENCY AND MY PLANNING IN TRADING.
Leave a comment that is helpful or encouraging. Together we can dominate the markets.

#202425 - a weekly price action market recap and outlook - btcGood Evening and I hope you are well.
bitcoin
Quote from last week:
bear case: Bears are doing the minimum required and rejecting bulls above 70000/71000. So they keep selling the highs but their current follow through is just not there. Last time we were above 70000 in March, market tried 3 times to stay above 70000 before breaking down to 56537. If bears do not break below the small bull trend line and the daily ema soon, I don’t think they will prevent the bulls from getting a new ath. If they get a big bear breakout below 68000, we could see bulls finally giving up and we could be in a W1 of the new bigger bear trend down to 50000 or lower. My preferred short term path is the red ABC correction.
comment: Currently my favorite market to trade and comment on because I’m hittin dem swings big time. And because btc permabullz are entertaining and salty af. Market is clearly trading down again and they shout from the rooftops that we will print 80/100k soon. In all seriousness. Clear trading range 65000 - 72000. Currently in a smaller down trend probably to touch the bull trend line around 65000 and then maybe back up to test the upper triangle trend line around 67000 again. Bear channel and triangle, both patterns are in play currently. 66000 continues to be big support so it will take something to break through. If we do break below, 61000 is next.
current market cycle: trading range
key levels: 66000 - 69000 small range / 56000 - 74000 (big range)
bull case: Bulls failed at the spike on Wednesday and that’s bad for them. What’s good was the fact that they produced tails below all daily bars and stayed above 66000. The pattern shows 3 clear pushes down and the third could not touch either the bull trend line or the lower bear channel line. Bulls want a reversal anyhow and their first target is the daily ema around 67700 which is also close enough to the upper bear channel line.
Invalidation is below 64000.
bear case: Bear targets are not met until they touch the bear channel or the bull trend line. So do we get a pullback to ema here or another push down before a pullback? I have absolutely no idea and neither does anyone else on twitter. So wait, look for signs of strength or weakness and ride the wave when it comes up. Right now bears need to break below 65000 again for lower prices. And yes, bears are in control as long as that bear channel is alive.
Invalidation is above 69000.
short term: If bulls break above 67000 that would be a breakout above two consecutive inside bars and that’s a but I do think everything below daily 20ema is bearish. So I’m neutral and look for shorts against the ema or on strong selling.
medium-long term: Down to 50000 (could take 3-6 months). Longer term than that time frame, I don’t know. Could also drop to 30000 again but let’s make 40000 first and see how many want to buy there. —Adjusted 40000 to 50000 and 40000 to 30000 because we are staying so long up here above 60000.
current swing trade: None
chart update: Pullback was too high for a clear wave series so it’s more a trading range trending down. So update the bearish two-legged correction and added a bullish pullback to the ema before a stronger push down to 60000/61000.

BTC - Weekly Forecast - 17 June 2024I have a bearish bias on BTC for the weeks ahead.
My potential entries and targets are shown within the video


SUMMERTIME SADNESS - SHORT CRYPTO - SHORT BTCI was caught off guard when everything started going up. The old saying sell in May and go away wasn't the perfect play this year in 2024.
May served as a trap, the way it was done is kinda crazy. Sometimes it seems as if these algorithms are at the perfect equilibrium all the times.
With that being said:
After the summer things will start heating up for CRYPTOCAP:BTC , COINBASE:ETHUSD & CRYPTOCAP:OTHERS other cryptocurrencies. Big big bull run incoming.
Buckle up because it will be fun.

BTC Bitcoin targeting 62000Hello traders
I am short on BTC based on this chart with expected wave 🌊 shape
stop-loss close 4H above 67000
CRYPTO:BTCUSD

BTC to 75K then 80KBULL FLAG launch of Bitcoin should see a fast leg up to 75K then I see it coming back and testing ATH then going higher to 80K. I expect this move to be coming very soon. Using Channels, Fibs, And Elliot waves I show how I expect Bitcoin to launch here shortly.

Bull Flag or Bart SimpsonThis is a Bearish perspective.
Some might see a bull flag IF this price action plays out like this, however, it's possible that we could see lower lows in the form of a "Bart Simpson" pattern.
Complete Speculation, but saving this idea in case the scenario plays out.

BTC HALVING - What will happen? Historically, Bitcoin halvings have been associated with price increases in the past.
Supply Reduction: Bitcoin halvings reduce the rate at which new Bitcoins are created, effectively reducing the supply. Historically, this reduction in supply has led to upward pressure on the price as demand remains relatively constant or increases.
Halving Anticipation: Many investors and traders anticipate Bitcoin halvings, and this anticipation can lead to increased interest and buying activity leading up to the event. The "buy the rumor, sell the news" phenomenon can contribute to price increases before the actual halving takes place.
Historical Patterns: In the past, Bitcoin has experienced price increases in the months leading up to and following a halving event. While this historical pattern doesn't guarantee future gains, some investors may use it as a basis for their investment decisions.

2024-06-18 - a daily price action after hour update - btcGood Evening and I hope you are well.
bitcoin
comment: Laid out my plan in my weekly post, so check that out if anything is unclear here. Market is forming another bear wedge which could break above again for another pullback. I expect the pullback to be weaker than the one to 67000 and it could stay below 65000 if this is uber bearish. If bulls are tough, we could see 66000/66300 again. In any case, I expect this to continue downwards to at least 61000 in the near term. Decent chance we wont see 70000 for couple of years.
current market cycle: Trading Range / on shorter tf it’s a weak bear trend, see channel on chart
key levels: small range 63000 - 67000 / big range 56000 - 74000
bull case: Bulls trying but it’s a STR market and bears mostly staying below the 1h 20ema. Bulls want another pullback like Monday for 2000 points but they would need follow through afterwards. Bears used it to sell even more aggressively for new lows. First bull target is 65000 and then 66000.
Invalidation is below 63500.
bear case: Bears in full control here. Their main goal is to break below all lower bear trend lines and below 63500 for a freefall to 60000/61000. I expect bears to continue to sell every rip. That has been working for 8 days now.
Invalidation is above 66000.
short term: bearish and sell the rips. 61000 soon.
medium-long term: down to 40000 (could take 3-6 months). Could also drop to 20000 again but let’s make 40000 first and see how many want to buy there. —unchanged
current swing trade: None.
trade of the day: Only good if you trade the asia session or shorted yesterday’s high. 67000 was resistance since late Thursday so shorting there was decent. Was good for 3000 points but if you were asleep or not short, second best trade was a short near the 1h ema at bar 11.

$BTC Daily UpdateCRYPTOCAP:BTC #BTC Broke below $66,323 key support as expected, currently testing $65,073-$65,521 area. RSi on 1D dropping, $64,344 next key support from here to watch as of now, Previous daily close showed some strength, $68,546 support much needed. Watch Given S/R

Btcusd Btcusd am expecting a bearish movement cause price broke and retest so we expecting price to move down

Week 25 Analysis (17Jun) + Week 24 ReviewWelcome Fellow Traders!
Tech Analysis for the coming week + review of the current!
Usually takes about 15-20 mins, sharing as much as possible, Stay Tuned!
If you find the content useful to you, do follow me on trading view and give me a Rocket BOOST!

$BTCBitcoin sits at a trendline/support. An ascending triangle is typically a bullish pattern. If PA breaks below look for it to drop to $60500. If it bounces here look for a retest to $71K. If bullish sentiments continue I see FWB:83K

If BTC breaks below 65,200 again, we might see a short downtrendIf BTC breaks below 65,200 again, we might see a short downtrend.

BITCOIN BULLS WILL DOMINATE THE MARKET|LONG
Hello,Friends!
BITCOIN is making a bearish pullback on the 1D TF and is nearing the support line below while we are generally bullish biased on the pair due to our previous 1W candle analysis, thus making a trend-following long a good option for us with the target being the 70453 level.
✅LIKE AND COMMENT MY IDEAS✅

An Interesting Trendline Rejection (BTC)I pulled up my old Bitstamp chart, which I used during the previous bull market and the 2018 bear market to make some speculations and estimations. One of the most concerning technical developments in the 2021-2022 bear market was that Bitcoin lost its long term trendline (lower orange line). Bitstamp is useful because it stretches all the way back to 2012. To get back above that trendline and resume a more aggressive rate of increase, it would need to explode above $200k within the next few weeks. That seems pretty unrealistic.
What caught my eye was that Bitcoin's recent top perfectly touched a trendline I drew in 2022. It's not that this necessarily means anything, but I found it interesting and wanted to make a short post about it. If nothing else, this retest and rejection illustrates Bitcoin's slowing of momentum over time. I suppose it also serves as an important hurdle - I think if Bitcoin can break above it and retest it, that would be a huge sign of strength for bulls.
Volume continues to decline overall, and active addresses have also started to disappear. A decline of this magnitude in active addresses is often seen at cycle peaks. But this time it's different - it almost appears to be plateauing, meaning there is a significant chance everything Bitcoin has peaked. To put it bluntly, Bitcoin has not seen a significant increase in "adoption" since 2017. This has generally been my stance since 2022.
I drew a new line (blue) supporting price since the 2022 bottom, to show where price can reasonably fall from here and remain in an uptrend. The trendline support is currently around $45k. If that trendline breaks down, I think a retest of 2022 lows are in order, at least, if not the elusive $13.8k level (2019 high).
That's it for now! Thanks for reading. Of course, this is meant for speculative purposes only and should not be taken as financial advice.
-Victor Cobra


BTC Short ideaNon financial advice.
Think the last support for BTC its between 62.5-61.5k.
Then the only way its up. Small rejection around 68k, biggest one arhound 72-73k. If we go through those zones, we will reach 80k soon.
Best,

BTCUSD BUY (80k soon!!)Hi fellow traders, BTCUSD will be ready to make a move higher from the blue box after it completes the flat correction. Target the 79219.46 level. Good luck and trade safe!
