Low Volume -> False BreakoutI find it hard to be bullish on bitcoin when volume has been so low for so long. If volume continues to mean something like it always used to, it's likely that prices will go lower, before they climb again to newer highs.
BTCUSD.P trade ideas

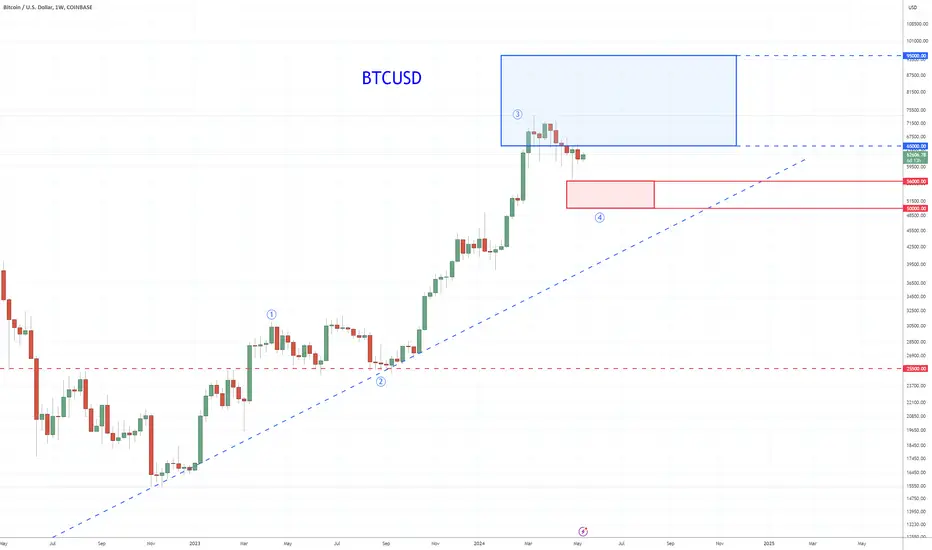
🔥BTC might be ready to target 75k: Update and multitimeframe🔥Please see previous ideas for more context
☝️Do not act based on my analysis, do your own research!!
The main purpose of my resources is free, actionable education for anyone who wants to learn trading and improve mental and technical trading skills. Learn from hundreds of videos and the real story of a particular trader, with all the mistakes and pain on the way to consistency. I'm always glad to discuss and answer questions. 🙌
☝️ALL ideas and videos here are for sharing my experience purposes only, not financial advice, NOT A SIGNAL. YOUR TRADES ARE YOUR COMPLETE RESPONSIBILITY. Everything here should be treated as a simulated, educational environment. Important disclaimer - this idea is just a possibility and my extremely subjective opinion. Do not act based on my analysis, do your own research!!

Spot Bitcoin ETFs Rebound with $1.3B Inflows in May |BTC LONG...Bitcoin price fluctuations have directed significant attention from investors towards meme coins. The primary reason for this shift is the higher volatility exhibited by meme coins, attracting many new participants into the market through notable success stories. This pattern frequently leads to speculative price movements when Bitcoin prices surge. So, what’s the current status of prominent meme coins aside from Dogecoin? COINBASE:BTCUSD

BITCOIN is going to 'attack' $150k next. Confirmed!Bitcoin (BTCUSD) is starting the next rally phase after the pre and post-Halving 2-month consolidation, a development that is consistent with both of its previous Cycles.
In fact, if traded around and above the Mayer Multiple Band (MMB) of 1 Standard Deviation (SD) above (gray trend-line), which is the exact same consolidation phase it had (blue ellipse) after every time the Bollinger Bands Width (BBW) bottomed (blue trend-line).
The astonishing symmetry among BTC's Cycles is evident also when using the Vortex Indicator (VI)- and the CCI both on the 2M time-frame. As you can see, every timr the VI- topped was when the CCI made hits 1st Higher Low following its own bottom. The distance between that point in time (vertical orange line) and the bottom of the BBW (vertical green line) has been around 180 days on each of the past 3 Cycles.
On the last two, Bitcoin topped within 560 - 595 days from the vertical orange line. As a result, we can expect the price to top by the week of March 17 2025 the earliest.
The most important part perhaps is that after each consolidation after the BBW bottom (blue ellipse), Bitcoin's immediate target was the MMB 3SD, which is the orange trend-line. That is currently at $125k but by the time the rally reaches it, it could be closer to $150k.
But what do you think? Do you feel that BTC is about to 'attack' $150k as its next target? Feel free to let us know in the comments section below!
-------------------------------------------------------------------------------
** Please LIKE 👍, FOLLOW ✅, SHARE 🙌 and COMMENT ✍ if you enjoy this idea! Also share your ideas and charts in the comments section below! This is best way to keep it relevant, support us, keep the content here free and allow the idea to reach as many people as possible. **
-------------------------------------------------------------------------------
💸💸💸💸💸💸
👇 👇 👇 👇 👇 👇

BTC Scenario 2023-2025Q3-Q4 2023 wont be so nice for BTC/Stocks if you ask me.
So I'm thinking about a bottom around 17k.
Then just buy and hold.

Moon is near 🚀Hello, everyone! 🩷Have we finally made it? Is Bitcoin really about to surpass all previous highs? 🙏We’ll find out very soon, and I think it’s quite possible! Fingers crossed! 🤞
Bitcoin is rapidly gaining momentum, and this is a great signal that we are on the right track!
Many of you have seen my chart where I analyzed some price movement algorithms, and we are currently continuing the growth phase. For those who haven’t seen it yet, make sure to check it out by clicking on the post.👇
As for the current situation, what do we see on the chart?
The price broke out of the triangle upwards and tested it, indicating an organic movement, followed by further growth.
What can we expect next? We anticipate continued growth to levels of 🟢 74,000 - 78,000 in the short term, and in the medium term, 🟢 82,000 - 87,000!
If You’re also interested in learning how to trade the triangle pattern, You can find a detailed description in my post below. Learn and trade smart! 👇
Thanks for Your attention🫶
Always sincerely Yours, Kateryna💙💛

I'm Back - Bitcoin - Long for the 90'sBitcoin continues to hold the 60k levels, and by the weekly candles, any and all dips are being bought up.
However the market does not feel over exuberant and so in my opinion there is room to run here.
The next level of importance is around 92-95k, so for me I am slowly stepping in for the next move to the 90's.
Any move into the mid to low 50's is an area for me to add another position. I am not buying BTC outright anymore, just too much complications with taxes, I am buying BITO through my brokerage account.
My overall target in this run is around 130k, so I really like the low 50's for a potential 3 bagger. That does not imply I am holding for 130k as I do ever big rally I will be shaving off into the last leg when everyone is banging the table for higher prices.
Keep in mind this is not a day or swing trade, this is clearly a position trade. I am looking at the weekly candles, not following a 15 minute chart and screaming at everyone.
I play the long slow game and if you have been following me for the last 8 years I have proven it works!
Good to be back, will be posting more
BTCUSD Long Run target 89,000$1. Bullish Flag continuation pattern which support Bulls if Day closing end at 67,000$ and above.
2. ABCD pattern formation where exact retracement occurred at Fib 0.50 point which also support Bulls.
3. Harmonic ABCD pattern Point D expected to be completed at 89,000$ in coming days if price remain above 67,000$.
4. Fundamentally war and war like activities boost market prices.
Bullish ABCD Pattern Summary.
AB Leg: The initial move starts from point A (low) to point B (high).
BC Leg: The price then retraces from point B to point C. This retracement typically aligns with a Fibonacci level, such as 0.618 or 0.786 of the AB leg.
CD Leg: After reaching point C, the price moves in the direction of the original AB leg, extending to point D. The length of the CD leg is typically equal to the length of the AB leg.
Entry Point: Traders often look to enter a long position near point D, expecting a reversal.
Confirmation: Fibonacci extensions, previous support/resistance levels, and other technical indicators are used to confirm the validity of the pattern.

BTCUSD A Fall Expected! SELL!
My dear friends,
Please, find my technical outlook for BTCUSD below:
The instrument tests an important psychological level 66930
Bias - Bearish
Technical Indicators: Supper Trend gives a precise Bearish signal, while Pivot Point HL predicts price changes and potential reversals in the market.
Target - 64056
Recommended Stop Loss - 69001
About Used Indicators:
Super-trend indicator is more useful in trending markets where there are clear uptrends and downtrends in price.
———————————
WISH YOU ALL LUCK

Other said Bullish.. But let me SHORT it nowBTCUSD is on the edge, it is on the upper trendline, on the fibo levels, and from EW perspective, it's on the end of wave B, get ready for wave C, to 50,000ish.
Cheers!

BTC on 9 h vs 1h charts💥Hello, friends! 🩷 Bitcoin is once again hovering and teasing us with its movement. 😏You might think it's stuck just like it was a few months ago, when we anticipated a price drop, but in my view, there are some differences that I'll try to describe in this post.👇
For clarity, I divided our chart into two parts - the left side showing the 9-hour timeframe, and the right side showing the hourly timeframe.
👐On the longer timeframe - the left side - we see that the price has broken out of the triangle upwards. Many of You, seeing a fake breakout from the same triangle before, might rightfully ask,<< could this be another fakeout?>> In my opinion - no, because the price has already consolidated sufficiently above. So, we have a breakout of the triangle.
👐Now, let's move to the chart on the left - the hourly one! There we see our breakout with the price formed in more detail! We can observe impulsive movements and the formation of a short-term channel, looking at which we can expect the price to rise to the 67,500 level. Then, we may either continue forming this channel by lowering the price to 66,100 and then rising again to 67+.
I think this will be the accumulation period before the moon flight:))
What do You think?😎Write Your thoughts in the comments.
Also, here's my educational post on trading channels, by the way, take a look😘
👇👇👇
Thanks for Your attention💋
Always sincerely Yours, Kateryna💙💛

Bitcoin (BTC): $68K Has Been Reached!!!!Bitcoin Has reached its first point of interest, which is $68K, the price is now finding it hard to breakout from there!
As we are slowly pushing there, we are waiting for some kind of weakness to kick in or a rejection to happen (even a fakeout is option here).
As there is still some liquidity to be taken near the current zone, we might see a fakeout, which would act as liquidation hunting....so eyes open!
Swallow Team

BREAK ALL THE RULES: SPYING smart money trend lines Traced over smart money trend movements. Two circles represent hidden secret smart money double bottoms. Not revealed to the public. They must meet an algorithm.
How high, for now it’s questionable.
Breaking all the rules: whales break rules, so will I.
Stay tuned for buying and selling updates. Once I can confirm BULL-SHARKS BUYING entry, I’ll update.
I’m working on whales buying and selling algo.

Bitcoin - Possible 80k Range Top Before Decline... Based on decline in percentage increases across the past 12 years or so, BTC is actually showing to be at the top of where it can go. This part is scary.
2012-2014 = around 50,000%
2015-2017 = around 10000% (one fifth of increase during previous cycle)
2018-2021 = around 2000% (one fifth of increase during previous cycle)
2022-2024 = around 375% (almost one fifth). 80k would be the top in that case if we take 400%.
And this is the part where it gets trickier.
BTC does not fall down but stays there within the red and green bands.
But we have ETH take over BTC. Institutional money starts to shift from BTC to ETH. Just a theory. ETH goes parabolic and becomes the dominant coin. BTC retains legacy status.
No trading advice, just observation....

Trade identification: Using bitcoin as an exampleHello,
Trade identification is the process through which you are able to identify setups that can be actioned on in the markets. For this example, I shall be using the BTCUSD chart to chant my path as I look for tradeable setups.
1: Structure drawing
Identifying the structure of trades is very key since it creates a sense of knowing where the market is at from a greater point of view.
The structure on a 2 weeks chart shows that the crypto is at the top of the chart. This shows that it might not be a good time to buy since it is advisable to buy at the bottom and sell at the top. However, we can always look for smaller trades using lower timeframes and get better setups.
2: Move to lower time frames & identify patterns.
Patterns are very key in helping you identify tradeable assets. For my asset I moved to the 6h timeframe to zone in and identify tradeable opportunities. This helped me identify the Expanding triangle setup on a bigger scale.
This is a sideways move that will help me trade on the asset for the short term. In the expanding triangle I was able to identify other smaller correction patterns that guide me on how the market is moving.
3: Entry identification
After you have determined where you are at in the eco cycle, very key is now to identify the next causes of action. You must never trade at the top (buying overpriced assets). Very important is to always note that there will always be more opportunities in the future and never to chase trades that have already gone. The ideal situation is to look for corrections as entry points and buy/sell with them.
Next now will be to look for areas where you can enter on an even lower timeframe.
The chart shows that a correction is happening on a lower timeframe (1hour). Now have an alert at the bottom of the correction also coupled with indicators.
Thats the entry point of the trade.
4: Target setting
The exit target shall be set using the 6 hour chart and will be at the top. A stop loss will be just behind the trendline as shown below. This is very key for risk management.
Now wait for the price to come close to your entry points and good luck. We shall follow this trade to end.

BTC USD(Elliott Waves)Hello friends
In Bitcoin digital currency, we see the formation of multiple waves in the shape of ABC (zigzag).
This pattern only appears in triangles.
Triangles appear in wave B of a zigzag or wave 4, but considering that before these zigzags we see a wave that consists of 5 parts, so the theory that this triangle of wave B is a zigzag seems very strong. arrive
In any case, considering that currently the price has reached the trend number of $68,000 and this number is a static resistance and wave C consists of 5 micro-waves, the price must be corrected and according to our considered theory This correction should continue up to the range of $60,000 or $58,500.
In case of failure and pullback to the price range of $68,000, this theory is invalid and the chart should be re-examined and analyzed.
To support me, I recommend that you install Trading View software on your phone and see my analysis and support me with your comments and Boost.
Be successful and profitable.

Keep going up! You think?The general trend is upward, but according to the structure of a TB position

BTC nears all-time highsBitcoin exploded past $71,000 and, in the process, broke above the upper bound of the descending channel. This price action was accompanied by a rise in RSI, Stochastic, and MACD on the daily chart, all of which are bullish signs. However, with a recent slowdown in Bitcoin ETF inflows, it is in question how much upside potential is left before Bitcoin starts giving up some of the gains. Therefore, much attention will be paid to Bitcoin’s ability to stay above the channel’s upper bound. If Bitcoin closes above the channel for multiple consecutive days, it will bolster a bullish case in the short term. Conversely, a failure will be slightly concerning. Besides technicals, the performance of the U.S. stock market, particularly the tech sector, also remains a significant factor due to its high correlation with the cryptocurrency market. If the stock market begins forming a double top, Bitcoin will be negatively affected.
Illustration 1.01
The daily chart of Bitcoin (BTCUSD) shows a bullish breakout above the upper bound of the descending channel.
Illustration 1.02
The chart illustrates the daily MACD and its successful breakout into the bullish zone.
Illustration 1.03
The illustration above displays simple support and resistance levels derived from peaks and troughs.
Bitcoin addresses
Since our last update, the number of Bitcoin addresses with balances exceeding 1,000 BTC has continued to tick higher. The same applies to the addresses with holdings exceeding 100 BTC. These are positive signs, but the rate of increase is negligible.
Technical conditions
Daily time frame = Bullish
Weekly time frame = Bullish
Monthly time frame = Bullish
Please feel free to express your ideas and thoughts in the comment section.
DISCLAIMER: This analysis is not intended to encourage any buying or selling of any particular securities. Furthermore, it should not serve as a basis for taking any trade action by an individual investor or any other entity. Your own due diligence is highly advised before entering a trade.

Bitcoin continues to rise, how far from the resistance level?Bitcoin managed to break out of the $67,000 daily range, showing strong upward momentum. This breakout is also confirmed by the RSI indicator, which has broken the downtrend line on the daily chart.
Given the time frame after the halving and the current market trend, the price of bitcoin seems poised to rise further.
Key resistance levels to watch:
First resistance: $69,500
The next resistance level is $71,600
Major drag: $80,000
Keep an eye on these levels as Bitcoin continues to move higher.

BTC simple analysis: box retestChart finished a bearish Elliot Wave and now can u-turn. Since it didn't complete full volume correction, it can go directly to 338% of E.W. fibonacci.
Fibonacci is between 2 and 4 of E.W.
The boxes are from an hour that was five times repited from a previous HH (or LL).
Retest can finish without hitting the box.
Sidenote: I have two boxes and don't know which on chart will go, but it will still go up so there shouldn't be any problem.

Bitcoin: mixed tradingThe minute that traders started to call the BTC market as “boring”, BTC decided to show them some action. Price moves as seen during the previous week the market participants were waiting for some time in the past. The price of BTC finally moved from the $60K support and it was pushed toward the highest close at $67.500 in midweek. However, it encountered resistance at this level and saw some retracement, closing the week around $66.5K. The market sentiment for BTC remains long-term bullish, however, some retracements are possible during the time. This is what charts showed during the previous week.
The RSI reached the level of 57, which is close to the overbought market side. It shows that there is still space for the price of BTC to move to the higher grounds, until the clear overbought market is reached. At the same time, the moving average of 50 days slowed down its divergence from its MA200 counterpart and is currently looking to start a clear convergence, which will be an indication of a potential cross in the future period. However, it should be noted that the potential for a trend reversal is on a long stick.
A strong price push toward one side usually implies a potential for a short term reversal in the coming period. As per current charts, a short reversal is possible, but the price will not return to levels from two weeks before. It seems rather like a short retracement toward the $ 65K level. There is also potential for the upside in the coming period, with relatively smaller probability that $70K resistance might be tested.

Bull flag on BTCBTC is forming a bull flag on the daily chart after this nice 12% pump. The projection here is 78k, with multiple ETF discussions, election year, the halving, and NVDA earnings being strong the market is generally macro bullish here. The downside move here is around 66k even but the trend remains up. The weekly stochastic RSI also just started to point upwards as well. A cool off for a few days makes sense here. I expect a break by late Monday.

BTC $ 255 000 this BULL RUN?Hello, everyone!💥
Today, let's talk about Bitcoin and its prospects for the coming years. What should we expect? Let's compare the two previous bull runs.
To start with, every four years, the reward for Bitcoin miners decreases, a phenomenon known as halving.
Why is everyone so waiting for halving? Well, when the next halving occurs, miners receive half the rewards, reducing the speed of new Bitcoin mining and consequently lowering its inflation rate (devaluation).
No one knows for sure what will happen next time, but it's worth making predictions based on the history of previous years. Especially since it's very transparent and repeats itself time and time again.
Let's take a look at the chart I've prepared for You.🧐
On the chart, I've marked two wedges, which I've colored white. The blue arrows indicate the regularity of three-year cycles. This is the time it takes for these channels to form and the regular way they break out.
After the breakout, the growth percentage is approximately the same ~550%.🚀
Assuming that the breakout occurred last year, from the $40,000 mark (the price has already corrected as it has done every time before - orange circles), and the growth will be like previous times, theoretically, the price in this bull run could reach the $255,000 mark.😱
🧐Do you believe in such growth? Are you concerned about the situation in the world? Share your thoughts in the comments.
💡I also wanted to share my previous chart with you. Perhaps you'll find it interesting.
Thanks for Your attention!
Always sincere with You,
Your Kateryna🫶
