Short BTCUSD Now ! Bitcoin has already reached a resistance that is suitable for whales to sell. I am waiting for it to drop from 67000 to 63000 and because I think it will drop to 50000, so I have no idea about the right price for Long position.
BTCUSD trade ideas

correction It is expected that the upward trend will change in the resistance range and the resistance trend line and continue the downward trend.
If the price crosses the 127% level, the downward trend will be canceled

$BTC Daily UpdateCRYPTOCAP:BTC #BTC broke below $68,546 support down to $66,323 support which tested and held on last dip, $67,716 being tested as of now, RSI on 4H and 1D getting better, $68,546 support to be regained to reattempt at $71,379-$72,162 resistance area. Watch given s/r


Bitcoin ETF are strong, but the price Bitcoin remained below $70,000 despite news of substantial holdings by the BlackRock ETF. While ETF inflows continued last week, they failed to drive the price up. The presence of willing sellers, miners, and a lack of short liquidations have kept BTC within a narrow trading range. The Bitcoin ETF narrative has once again taken center stage, overshadowing altcoins and other protocols. In 2024, there were high hopes for new all-time highs driven by demand for physical coins. The introduction of various Bitcoin-based spot products sparked optimism for increased direct demand. However, despite indications of buying and holding, the BTC market price remains stagnant.

BTCUSDThis Weekly FORECAST
Opportunity for BTCUSD. This setup trading idea is for swing. >> TAYOR
Risk Factors:
1. Market conditions, unexpected news, or external events could impact the trade.
2. Always use risk management strategies to protect your capital.

Short BitcoinBitcoin failed to break above the resistance area at 70-72k area and is currently in a descending channel with a possible target to the lower channel and the major support demand zone at area 50-52K.

BTC/USD Under Pressure After Failing to Test April HighBTC/USD trades to a fresh monthly low ($66561) following the failed attempt to test the April high ($72727).
BTC/USD Outlook
BTC/USD fails to defend the opening range for June as it extends the decline from last week, with a break/close below the $62780 (100% Fibonacci extension) to $64850 (23.6% Fibonacci extension) region raising the scope for a move towards $57590 (78.6% Fibonacci extension).
Next area of interest comes in around the May low ($56,525), but BTC/USD may face range bound conditions amid the flattening slope in the 50-Day SMA ($65954), with a move above $70000 (38.2% Fibonacci extension) bringing the April high ($72727) back on the radar.
--- Written by David Song, Strategist at FOREX.com

Short Bitcoin on Wave X Pullback
Bitcoin appears to be forming a combination with one zigzag already complete. There exists a good shorting opportunity with the wave X pullback.

Cup and handle BTC USDwe can see a pattern that confirms a positive healthy grow trend which is known as cup and handle.

BitcoinSeems we completed this correction phase with the Weekly oversold at the bottom. Looking for the cloud recovery to hold as we impulse higher.
Prevailingnine 5/25/23

BTC to retest support at 67kAfter the completion of the 5th EW and then the immediate dump off of 72k resistance, I expect the pattern to continue and complete the final c off of 67k support. If it breaks this support I expect it to fall back down to the next support of 65k with a strong bounce

probably nothing...Short time !
Je pense que nous sommes en train d'aller vers les 54000$ avant de repartir à la longue hausse !

BTCBTC and potencial Bearish Retracement into D Discount / W FVG from there price can react and make All Time High


BTC near term downsideI expect CRYPTOCAP:BTC to touch $68,300 before resuming uptrend and retesting $73K.

BTC forecast for JulyMost likely, a weak downward movement will continue to the border of the formed flag/wedge. And it makes sense to buy at its lower limit. If before this time its upper limit of 72-74 is broken, of course you can also buy BTC

Jun.4-Jun.10(BTC)Weekly market recapEmployment data was released last Friday. Although the unemployment rate rose to 4%, the number of NFP exceeded expectations, reaching 272,000. The data performed average, but due to market expectations were too high, there was a correction after the data was released. Not only in crypto, gold has also seen a obvious correction.
The market currently predicts that the number of interest rate cuts in 2024 will be reduced to two times, in September and December. The CPI and FOMC for May will be announced on Wednesday and Thursday this week. We believe this will determine the medium-term trend. Regardless, we are heading towards a rate cut.
BTC is as we predicted last time, after rising and falling. It is slightly lower than last week’s price. Although the price has corrected, there has been no continuous decline for the time being. Trading volume is low. From the WTA indicator, after the last analysis released, a small number of blue columns representing whales appeared, but they quickly disappeared. The ME indicator continues to maintain a bullish trend.
To sum up, we believe that the volatility of BTC will increase this week and continue to fluctuate, with the probability of rising higher than falling. We maintain our original resistance level 74000 and support level 61000.
Disclaimer: Nothing in the script constitutes investment advice. The script objectively expounded the market situation and should not be construed as an offer to sell or an invitation to buy any cryptocurrencies.
Any decisions made based on the information contained in the script are your sole responsibility. Any investments made or to be made shall be with your independent analyses based on your financial situation and objectives.

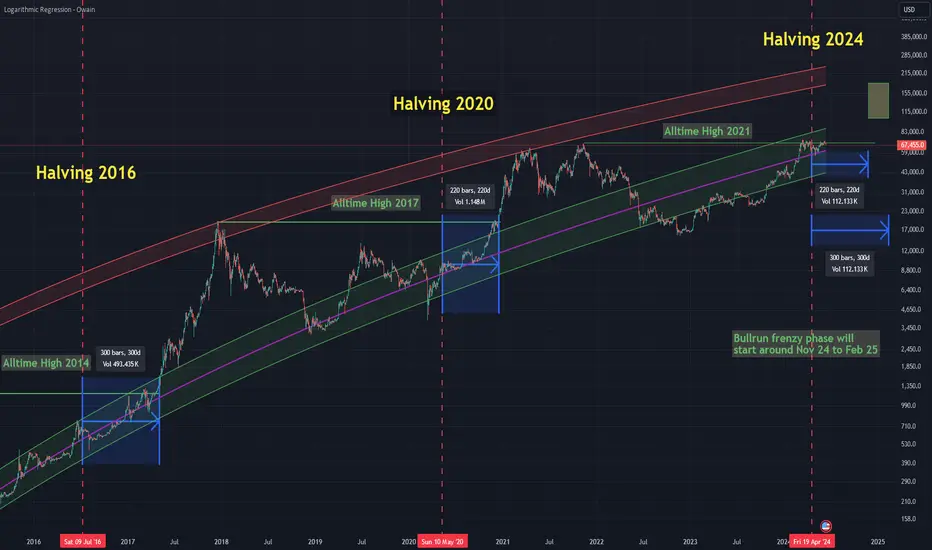
Bitcoin not due yet to go into full degen bull market modeIf history repeats itself - and so far history has repeated itself for Bitcoin every 4 years, we have not seen the true face of the Bitcoin bull market yet.
Let's have a closer look at where and when things could really go ballistic to the upside by analysing its so-called logarithmic regression:
You will see 3 different areas of importance on this chart:
1. A purple line showing the current "fair" price of Bitcoin according to the regression
2. A green channel marking the price area where Bitcoin should spend most of its time
3. A red channel marking the projected blow off tops for each bull run
The pattern we usually see is that after a top somewhere within the red channel Bitcoin eventually falls back to the green channel (and sometimes below it) to then settle roughly around the purple line at the time of the halvings.
What do these findings tell us about the current state of the bull market?
Let's look at the price behaviour after the halving of 2016 and 2020.... It took Bitcoin around 300 days after the 2016 halving and 220 days after the 2020 halving to finally breach the green channel to the upside and go into, what I call, full degen frenzy bull market mode. This is the area between the green and red channel, where prices go ballistic and influencers on social media will talk about the how everything will be different this time and how everything is only going up from now on.
As you can see Bitcoin currently is still quite far away from leaving the green channel to the upside. In fact if it would go into full frenzy bull market mode right now we would need to see prices well above 90,000 USD. If history repeats itself again and we can expect the price to leave the green channel to the north sometime 220 to 300 days after the halving. That would be sometime between November 2024 and February 2025 - the top of the green channel will then be around 100,000 USD.
Price will then probably rise rather quickly to the red channel again where it will eventually top out and, once again, enter a bear market. Top prices should be somewhere between 200,000 USD and 300,000 USD in 2025. It is then time to get out of the market and go into hibernation once again to come back once the lower green band of the logarithmic regression is reached.
The good news is....with prices currently around 67,500 USD there is still plenty of money to earn even until reaching the phase where the price of Bitcoin will really go ballistic. The bad news is... most people will be left behind and will probably fomo into Bitcoin (or the worse alternative: Altcoins) at prices between 150,000 USD and 200,000 USD.
This, of course, is just my own opinion and no financial advise!
Volume is back ... BTC heading toward 67k supoort Volume on BTC has finally returned. Heading into FOMC on Wed, will we see a bounce off of 67k, or will we test lower ...
RSI on the 4hr is tapping 30. On the daily its pushing below 50. Heat maps suggest a liquidation cascade below 67k. Bulls will need to wake up soon and put up a serious fight in order to retest the 72k level.
As the saying goes, this will be the most important CPI and FOMC of our lives, until the next one

Bitcoin facing a dangerous rejection- follow up analysis on this:
- looking pretty clear that I was wrong and Bitcoin is not ready to move to the upside
- with another rejection at the 72k level however odds of a substantial reversal have increased heavily
- clear trend present for the last 2 months: Mondays have either been the low (green) or, more commonly, the high of the week (meaning price did not trade above the Monday high for the rest of the week)
- we got another high of the week print yesterday

RIP listen to youtuber lolWill BTC go 100k? for sure, it could but looking at all the charts do you want to take the risk?
You have missed the boat, it is alright. They are taking profit and you are buying the top.
What if you missed the boat? Why do you bother? Money will go from the patient hand to the impatient hand.
Why can't you just wait till indicators long-term are showing oversold?
Do you know what I am doing right now? Buy some good projects that are undervalued and it drop about 80 to 90% and stake it. ( Remember only risk 20% )
And staked your stable coin to earn APR. When indicators weekly and monthly show oversold, this is the time you need to start deploying your 80% cash.
That time BTC bottom may be 100k or 150k, you don't have to bother coz you just need to respect the charts and indicators and you know that you don't buy the top. Don't FOMO in.
Imagine you staked a stable coin and earned 5% APR. By the time, indicators show a market bottom, you have a large some of cash to deploy. Anyway, your money your decision. hahah

Bitcoin BTC to $250K - BUY & HODLBitcoin went to the Moon with Dec '17 top.
Then it corrected 88.6% on the Fibonacci Retracement with Dec '18 bottom.
After that it went to Mars and hit the tops again in Nov '21.
It was a 2000% gain.
What can you tell from this?
Percentage-wise, Correction is lower than the gain.
So, the Dominant Trend for BTCUSD is UP!
OK, back to Earth.
Let's gather fuel and power-up the rocket.
Time to go Interstellar.
Before I go into the technical stuff, allow me to keep things simple for you.
I took the liberty and measured the BTC Cycles.
But you don't need to worry about that, just follow my lead!
I used a fancy tool called Fibonacci Time Zones.
This tells me roughly when the next Bullish Cycle for Bitcoin will start.
We are on the 5th Fibonacci Summation milestone, and another 2000% gain is destined to commence.
When?
Early '23 , like all other Cryptocurrencies.
What's the level?
My ultimate levels are: 10K & 7.5K .
I will buy more there.
I will HODL for the long-term because I know it's a waiting game.
Now you have what you came for: when & where.
You can go ahead and open the next idea. :)
Thank you and you're welcome.
But if you capable of digesting what's to come below, then I put my hat down...
Bitcoin ( BTCUSD , BTCUSDT , BTCBUSD ) Technical Analysis:
* Elliott Wave Cycle: Complete V Cycle Degree (white)
* A-B-C Elliott Wave Correction (red)
* Ending Diagonal in Cycle C (red)
* Harmonic Pattern: Cypher
* 88.6% Fibonacci Retracement
* 161.8% (Golden Ratio) Fibonacci Extension
* Bullish Divergence
* Dominant Trend Line (turquoise dotted)
* Demand Zone
* Fractal Pattern
If you get all this without a headache then you're a legend!
The Aug '15 to Dec '17 is what I'm expecting, and it's a BIG one.
Good luck my fellow HODLer..
Thanks for the like,
Richard, the Wave Jedi.
