AMBER ALERT; BULL RUN is READY! Two vertical green lines represent a BULLISH HARAMI PATTERN.
Red vertical line represents the waterfall where some could have thought, BITCOIN is doomed.
Indicator
Yellow is the RSI and blue are three indicators combined into threefold:
1. TRIX
2. Ultimate Oscillator
3. Rate of Change
Let’s go to the red vertical line where the BTC falling started. As some might have thought the worst of BTC, TRIX, Ultimate Oscillator, and ROC painted a completely different story.
Their pointing was up and still is.
RSI follows in the directions of TRIX, Ultimate Oscillator, and ROC. When this three becomes open. It’s great guidance.
Ichimoku is bullish in the coming days. The 4 hour TF candlesticks are inside the BULLISH CLOUD.
ATR AUTO DETECTOR idea will be for tomorrow. We still have time. I got stuck getting an indicator coded out.
BTCUSD trade ideas

Bitcoin Predictions for 2025 & Beyond: Who’s Eyeing $1 Million?If one thing is certain on this earth, it’s that Bitcoin BTC/USD predictions are as volatile as the coin’s price. In this Idea, we’ve gathered some notable Bitcoin price predictions with their respective time stamps.
Teaser: it’s a diverse set of characters ranging from bullish Wall Street pros and tech visionaries to some (permabear) economists and professors. Let’s check it out!
Cathie Wood (ARK Invest) : $1 million
Cathie Wood is no stranger to making waves with her predictions. The risk-taking tech investor has said Bitcoin could reach a jaw-dropping $1 million by 2030, offering the stereotype attributes of Bitcoin as a hedge against inflation and increasing institutional adoption. Wood's more optimistic projection sees it soaring as high as $1.5 million in the same timeframe.
Michael Saylor (MicroStrategy CEO) : $1 million
Michael Saylor, the ultimate Bitcoin maxi (borderline Bitcoin fanatic) who believes in total Bitcoin dominance , has been accumulating Bitcoin for his coin-hoarding company’s reserves and predicts it will eventually hit $1 million, emphasizing its superiority as a store of value compared to fiat currencies and gold.
Chamath Palihapitiya (Venture Capitalist) : $1 million
Chamath Palihapitiya has previously suggested Bitcoin could eventually hit $1 million, driven by macroeconomic instability and as a hedge against traditional financial systems.
Robert Kiyosaki (Author of Rich Dad Poor Dad) : $500,000
Kiyosaki predicts Bitcoin could hit $500,000 by 2025 due to the collapse of fiat currencies and increasing inflation.
Mike Novogratz (Galaxy Digital) : $500,000
Mike Novogratz is riding the bullish wave as well, predicting Bitcoin will hit $500,000 within the next three years. He believes this surge will be driven by Bitcoin's fixed amount of tokens (21 million) and growing adoption.
Tyler and Cameron Winklevoss (Gemini Exchange Co-Founders) : $500,000
These crypto twins reiterate that Bitcoin could eventually reach $500,000 due to its potential to replace gold as a store of value.
Tim Draper (Venture Capitalist) : $250,000
Tim Draper has long maintained a prediction that Bitcoin could hit $250,000 by 2024, citing broader acceptance and institutional adoption not just of Bitcoin but the broader crypto market .
🏢 Institutional Investors and Their BTC Targets
Pantera Capital : $148,000
Crypto hedge fund Pantera Capital expects Bitcoin to rise to around $148,000 during the next four-year halving cycle (ending April 2028), based on historical trends.
JPMorgan : $45,000
Taking a more conservative stance, investment banking giant JPMorgan JPM projects a price target of $45,000, provided Bitcoin continues to gain acceptance as a risk-adjusted alternative to gold XAU/USD .
Standard Chartered : $120,000
Recently, UK-based bank Standard Chartered updated its forecast, predicting Bitcoin will rise to $120,000 by the end of 2024.
Bernstein Research : $150,000
Research firm Bernstein Research predicts Bitcoin could hit $150,000, largely due to ETF demand and supply reductions following the 2024 halving .
🎢 Other Bitcoin Believers and Their BTC Targets
Tom Lee (Fundstrat) : $180,000
Luke Broyles (Bitcoin advocate) : $3 million
Raoul Pal (Real Vision CEO) : $1 million
Adam Back (Blockstream CEO) : $500,000
Anthony Pompliano (Crypto Investor and Influencer) : $500,000
John McAfee (Programmer, Businessman) : $1 million
Mark Yusko (Morgan Creek Capital) : $250,000
🚀 Bitcoin Maxis with No Price Targets
Bill Miller (Billionaire Investor)
Miller has stated that Bitcoin could go much higher, without a precise target. He supports the belief that it will outperform traditional financial assets over the long term.
Paul Tudor Jones (Hedge Fund Manager)
Jones has likened Bitcoin to an early investment in tech stocks like Apple AAPL , implying that it has significant potential for value increase.
Stanley Druckenmiller (Billionaire Investor)
Druckenmiller has suggested that Bitcoin could be a "store of value" better than gold and expects its price to rise dramatically.
Jack Dorsey (CEO of Block, Co-Founder of Twitter)
Dorsey, another devoted Bitcoin proponent, hasn’t given an exact price prediction but has expressed strong belief that Bitcoin will become the currency of the internet, suggesting a massive increase in value.
🧸 The Permabears: Those Who Want to See Bitcoin Burn
Joseph Stiglitz - In contrast to the bullish predictions, Nobel Prize-winning Economist Stiglitz has argued that Bitcoin could be “worth just $100 by 2028.”
Kenneth Rogoff - Harvard professor and former chief economist at the IMF, Rogoff claims Bitcoin is more likely to be worth $100 than $100,000 by 2028.
Nouriel Roubini - An economist known for predicting the 2008 financial crisis, Roubini has harshly criticized Bitcoin as a bubble and a "scam."
Bill Gates - The co-founder of Microsoft has expressed skepticism about Bitcoin and its ability to provide real value to the economy.
Warren Buffett - The legendary investor has famously referred to Bitcoin as "rat poison squared," expressing concerns about its lack of intrinsic value and speculative bubble characteristics.
Jamie Dimon - The CEO of JPMorgan Chase has repeatedly criticized Bitcoin, calling it a fraud and stating that it has no value.
Peter Schiff - An outspoken critic of Bitcoin and a proponent of gold, Schiff argues that Bitcoin is a bubble and that it will eventually collapse in value.
Larry Fink - The CEO of BlackRock has indicated he's no fan of Bitcoin, viewing it more as a speculative asset than a legitimate currency. More recently, after BlackRock launched the biggest spot Bitcoin ETF , Fink has warmed up to Bitcoin saying it’s a “legit financial instrument.”
Now, over to you: What’s your take? Is Bitcoin on a rocket ship to $1 million, or are the critics right to be cautious? Drop your thoughts—and favorite Bitcoin predictions—in the comments below!

Bitcoin Double-Top: A Repeat Of 2021?Back in 2021, Bitcoin hit a major high in April. 210 days later a slight higher high, and a technical double-top, was hit in November.
The first high toward April 2021 was preceded by rising volume.
The second high toward November 2021 was preceded by decreasing volume.
In 2024, the first high reaching March was preceded by rising volume.
The second high toward October 2024 was preceded by decreasing volume.
➢ The November 2021 higher high/double-top ended in a major crash (the decreasing volume was a strong revealing signal).
➢ The October 2024 lower/higher high/double-top has very low volume and also very, very low market participation, only whales are playing right now (no retail).
Will the second high of 2024 lead to a major crash?
This is a high probability scenario.
Bearish at resistance.
Bullish at support.
Q: What is the difference between December/November 2022 and October/November 2024?
A: The price... One was a bottom and the latter is a top.
Patience is key.
Thanks a lot for your continued support.
Namaste.

Bitcoin - 100 Billion $ Historical Liquidations | ALL TIME HIGH!Bitcoin is only a very small step away from reaching a new all-time high. On the following chart, we can see high leverage liquidity from traders around the world.
The most liquidity is around 70k - 73k. Over 100 billion dollars are ready to be liquidated! How is this possible? Most people have their liquidation price exactly around this level on their short positions on futures. They believe the market will go down, but as you know, liquidity can be a very sweet spot for whales; of course they want all orders.
From a technical perspective, bitcoin is forming a bullish pennant, and we have a strong bullish Elliott Wave combo (impulse wave + zigzag wave (1+2)). Wave 3 is in progress.
Bitcoin will most likely experience a massive flash pump, now it depends on whales - will they take the liquidity for their sell orders or let it be to push the price higher? What do you think? Let me know in the comment section. Write a comment with your altcoin, and I will make an analysis for you in response. Also, please hit boost and follow for more ideas. Trading is not hard if you have a good coach! This is not a trade setup, as there is no stop-loss or profit target. I share my trades privately. Thank you, and I wish you successful trades!

DXY Descending Triangle predicts Bitcoin RallyIntroduction
The simplest and most powerful long term relationship or indicator we have for the price of bitcoin is the DXY (the dollar index against a basket of other main currencies comprised of US trade partners). Therefore long term chart formations in the DXY can help crypto traders or investors make very profitable long term moves. Those that ignore this inverse relationship do so at their peril.
Current analysis
A pain view of the top chart shows two fat pairs of arrows that show when bitcoin went down and DXY went up. It also has two skinny arrows that show when DXY falls Bitcoin rises. Clear and irrefutable. What is up for debate right now is if the descending triangle I note is valid. There are several good DXY ideas out there right now but none seem to have taken this wider view: www.tradingview.com
DXY Zoom In
Everything is basically on the daily chart. DXY is actually at its 4th lower high and this current high is stalling right at the previous support of the double top of April to June, 2024. The indicators show clear hidden bearish divergence. For those that need a review, here is the simple divergence primer:
Normal Divergence (Trend Reversal)
Bearish: Higher highs on price action but lower highs on the indicator
Bullish: Lower lows on price action but higher lows on the indicator
Hidden (Trend Continuation)
Bearish: Lower high on the price action and higher highs on the indicator
Bullish: Higher low on the price action and a lower low on the indicator
Hidden bearish divergence suggests the downtrend will continue and DXY will continue to fall.
Weekly DXY
Guess what? The weekly DXY looks like hell as well. This rising trend line was previously acting as support and is now acting as resistance.
Conclusion
I see no reason why the powerful and clear inverse relationship between dxy and bitcoin should not continue. Basically everything in the “anti-fiat” or “weak dollar” categories should act predictably while this descending triangle plays itself out. This trade or posture doesn’t require fancy indicators or complex theory. Just basic charting supported by some minimalistic indicators to add a bit of richness to the technical analysis and fundamental relationship between Bitcoin and the DXY.
I am long crypto in one form or another. I have a coupe of rotations planed out for the next year. Wish me luck. Please see linked ideas for some other ideas that inform my current thinking.

Uptober Will End As Downtober | Bitcoin MonthlyI would like to call your attention to the sessions/candles of April and November 2021, both followed the same pattern we are witnessing now, in October 2024.
➖ April 2021 started green, we saw prices moving higher and by the end of the month a bearish bias developed and the session ended red. A strong correction followed and this signaled the orthodox end of the bull-market.
➖ November 2021 started green, we saw prices moving higher and by the end of the month everything was red. This was the end of the bull-market and the start of a major bear-market.
Bitcoin peaked March 2024 producing a new all-time high.
➖ October 2024 started green, we saw prices moving higher and things are turning red now. We have the same Doji that showed up in April and November 2021 but still green, it can end up red. Ending red confirms a major long-term lower high (more than six months old) and potentially the start of a major correction.
I say here the start but this would be the start of a bearish impulse that will end an already ongoing major correction.
👉 The main support levels are 55K, 44K and 36K.
It is possible that Bitcoin moves even lower but we have to wait and see how it all ends.
👉 Bitcoin is bearish and the major Altcoins are also bearish.
👉 Ethereum's weakness reveals a major bearish bias across the Cryptocurrency market giants.
👉 Many of the medium-sized and smaller Altcoins are ultra-bullish and breaking 2-3 digits up while the giants are moving down.
➢ Conclusion
Money flowing out of Bitcoin and the big Altcoin projects will move to the smaller Altcoins.
Thanks a lot for your support.
Namaste.

THE WOLF on TradingView PIVOT POINTS; low and high which show to have a breakout above the blue MA. Simple strategy just like WAVE PHASE 2. Same pattern for phase 4.
I drew a $69K blue horizontal line which I don't see happening but in case it does. Here we know what to expect. for a later PULLBACK.
The phases I'm more concerned about, are the TSUNAMI WAVES.

BITCOIN All indicators aligned for an incredible 12-month rallyBitcoin (BTCUSD) broke last week above its 7-month Bearish Megaphone pattern, which was essentially the pattern that absorbed via a relief pull-back the incredible rally that the market had since October 2023, fueled at large by the ETF speculation and then launch.
** Bearish Megaphones inside 7-year Channel Up **
This pattern is, as you can see, part of a greater 7-year Channel Up that encompasses the last two Cycles of BTC. Halfway through the 2018 - 2021 Cycle, the market also had a Bearish Megaphone, a little larger, lasting for 12 months before the price broke above it.
** The importance of the 1W MA50 **
That bullish break-out came when the price regained the 1W MA50 (blue trend-line) as Support and until the Cycle Top, it was never compromised again. In an amazing display of Cycle symmetry, Bitcoin is also being supported by the 1W MA50 right now (has been since the March 13 2023 weekly candle), in fact it was successfully tested and held 3 times since August 05 2024.
** MACD Bullish Cross **
The Megaphone break-out and the 1W MA50 support aren't the only bullish indicators that point to a heavy price increase next. Perhaps the most important of all is the (L) MACD Bullish Cross on, also on the 1W time-frame, the first such formation in a whole year (since October 23 2023). This is a huge development as it comes after 7 months of non-bullish price action, indicating a shift in trend.
** Can the top be at $200k or above? **
When all those indicators were aligned in mid 2020, BTC kick started the 2nd, final and most aggressive Rally of its Cycle. It was +65% stronger than the 1st Rally. As a result, we may experience in the next 12 months a rally of +615% (65% greater than the +373% 1st Rally).
But if this seems too great without a catalyst like the ETF launch was in January, even if BTC replicates the bullish price action of November 2022 - March 2024, it will still hit the $200k mark. What history has shown at least, is that we can stay bullish, until a 1W candle closes below the 1W MA50, whether that's at 100k, 150k or 200k and above.
So what do you think about this triple bullish combo? Is it enough to initiate a 12-month rally? And if so, what is your target? Feel free to let us know in the comments section below!
-------------------------------------------------------------------------------
** Please LIKE 👍, FOLLOW ✅, SHARE 🙌 and COMMENT ✍ if you enjoy this idea! Also share your ideas and charts in the comments section below! This is best way to keep it relevant, support us, keep the content here free and allow the idea to reach as many people as possible. **
-------------------------------------------------------------------------------
💸💸💸💸💸💸
👇 👇 👇 👇 👇 👇

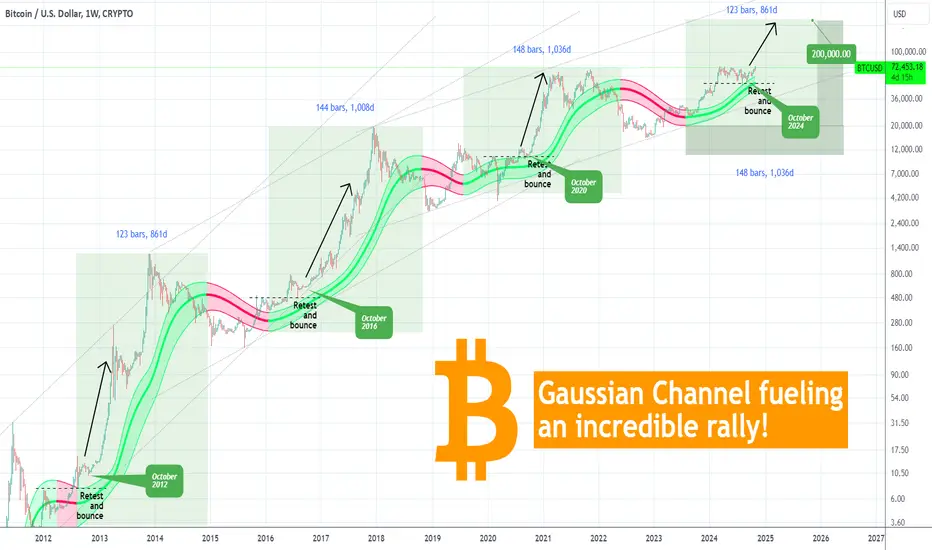
BITCOIN Gaussian Channel telling you the rally has already begunBitcoin (BTCUSD) is illustrated here on the 1W time-frame from the 2011 Cycle until today. We've used the Gaussian Channel (GC) after a long time and the reason is simple. Since the August 05 2024 Low, it has been supporting the uptrend up to today's test of the All Time High (ATH).
** Gaussian October support every 4 years **
This continuous support is a critical feature moving forward as every time the GC held at this stage of the previous Cycles (October 2020, 2016 and 2012), BTC started its final (and most aggressive) Parabolic Rally of the Cycle.
** Resistance turned Support **
What's equally interesting is that during those stages, the price also re-tested and held the former Resistance (of the previous Higher High), turned it into a Support (while the GC held) and bounced to the Parabolic Rally. This is a remarkably consistent feature taking place every 4 years!
** The green GC length matters **
Now as to the GC in more detail. What we want you to keep from it, is that the green part of the GC has lasted in the previous Cycles 123, 144 and 148 weeks respectively, which translates to 861, 1008 and 1036 days, until it turned red. As a result, we can expect the current green phase to last until December 08 2025 (minimum) and June 01 2026 (maximum). It is more reasonable to expect the longer case as the recent Cycles tend to have stabilized most of their common time patterns.
The Bear Cycle tends to start when a 1W candle is closed below the GC. Until then, based on the parallel Channel Up patterns that encompass 3 Cycles each time, we can even expect a price as high as $200000 for this Cycle Top.
Do you think that's realistic? And if so, do you also expect the GC wave to support a parabolic rally all the way to the top? Feel free to let us know in the comments section below!
-------------------------------------------------------------------------------
** Please LIKE 👍, FOLLOW ✅, SHARE 🙌 and COMMENT ✍ if you enjoy this idea! Also share your ideas and charts in the comments section below! This is best way to keep it relevant, support us, keep the content here free and allow the idea to reach as many people as possible. **
-------------------------------------------------------------------------------
💸💸💸💸💸💸
👇 👇 👇 👇 👇 👇
Bitcoin: Hasn't Reached Optimal Price.Bitcoin showing a higher low consolidation just above the 64K area support. Relative to the previous bullish structure, this signifies a higher likelihood that a higher high will follow, it's just a matter of catalyst. In the mean time, price can fluctuate either way from the current point (random). While the trend may be obvious in this situation, timing it effectively has everything to do with recognizing high probability price locations, setups etc. Otherwise you can make the mistake of assuming greater risk than you realize. In this article, I will describe the high probability, lower risk scenario that the market MAY OR MAY NOT present in the coming week.
One thing I recognize is that price continues to flirt with a resistance zone which makes this a tricky play for swing trades (at the time of writing current candle is inside bar). The 67K to 70K area is still a resistance zone (blue rectangle) and a higher risk location for long swing trades. In such scenarios when location is high risk but buy signals appear (break of inside bar high for example), it is more effective to assume risk on smaller time frames like 4H or 1H, and attempting to participate for a smaller bite. The risk that you are minimizing in this situation is the possibility that the 65K minor support is tested again and/or broken (see arrow).
The higher probability and lower risk scenario would be IF price can test the 64K support, followed by a reversal confirmation. The location is much more attractive since the potential profit is greater (3K+ points) coupled with much lower RISK (1 to 1.5 max) compared to 3K+ points of risk at the moment relative to this time frame. The illustration on the chart summarizes the ideal scenario that IF the market shows, would be a high probability swing trade long opportunity (which requires entry confirmation).
These scenarios that I present are dependent on the price action confirmation otherwise risk cannot be justified. Even having a confirmation process (like the Trade Scanner Pro) does NOT guarantee the trade idea will produce a positive outcome. After all, markets are HIGHLY random and outcomes are often the result of unexpected information being priced in. This is why technical analysis cannot be relied upon over longer time horizons, but can be helpful for quantifying risk.
Managing a position effectively no matter the time frame has everything to do with having properly aligned market expectations. First you uncover an idea, LET the market confirm the idea, from there it goes the right way or the wrong way. Your expectations will then shape how you manage the position as it fluctuates. The key to effective management is having an open enough mind to let the market pay you more when IT wants to, while being decisive enough to get out the moment you recognize what "wrong" looks like (or using other risk control methods like a stop). All of this information can be acquired from price charts or tools developed to simplify this process. Without any "process" you are most susceptible to relying on intuition and "hope" which will result in the typical retail trader experience: win sometimes but the account never grows for some reason.
Thank you for considering my analysis and perspective.

FORExX_WHALE VOLUME SNIPER! What do you see? Here is a quick glance. Despite other confirmations, here is my WHALE VOLUME SNIPER: what do you see?
This is why I said, this is a FAKE-OUT. BITCOIN will move up positive over +1%.
NOW DO YOU BELIEVE ME?

FOREXX ATR AUTO DETECTOR Here is a perfectly coded ATR. I had said before; that I would be using a 1-hour timeframe, registered on a 4-hour timeframe.
ATR MULTIPLIER is at 1.5
ATR LENGTH 14
Entry reads: $66,715
Profit reads: $68,085
Stop reads: $65,337
The above prices is my long position. If you look at my idea, my long position isn't aligned with my ATR green blue, and red horizontal lines, they were before but that's because my ATR horizontal lines are auto. As the trend moves, the lines move meaning take profit can be greater.
This ATR works wonders but I must know where to enter and for that, I have my algo. This ATR is far better than anyone out there sold in the market trading industry.
I can stick to my long position or I can follow the ATR horizontal lines because eventually, the price will get met. Now I would say as the lines move over my long position, then anything above my target is extra as I follow the blue ATR WAVE.
If in case the trend begins to fall then it will adjust back to my long position or if the trend falls any deeper, the stop line will move downwards to a much lower price when your actual stop price is much higher.
I'm also showing you the spoofing done by whales. How is my spoofing evaluated?
Spoofing: refers to attempts to manipulate the market by placing fake orders to deceive other traders.
- The script detects spoofing by checking if there is an **unusual volume spike**, meaning the volume is significantly higher than usual (# times the ##-period moving average).
- It also checks for **price stability**, where the price change is less than #.#%.
- If both conditions are met (volume spike + stable price), a spoofing event is detected, marked with an orange triangle on the chart labeled "SPOOF."
I've completed this idea to show our next simple price. My next idea I going BRUTAL. I will use a much higher timeframe for a higher price target.

Bitcoin Prints the First Golden Cross in Almost Exactly One YearWe'll have to see if it sticks but BTC has just printed a golden cross. The crazy thing is, the last golden cross occurred on October 29th 2023! This golden cross was 2 days short of exactly hitting the 1 year mark. We all know what happened after the last golden cross, over the next 4.5 months the price increased by over 116%.
If you take the time to study Bitcoin's price history, it is very clear that Bitcoin has been running in 4-year market cycles. This is especially true for the last two market cycles. From bear market bottom to the next bear market bottom, the 2015 to 2018 market cycle was 1432 days in length, and the length of the 2018 to 2022 market cycle was 1438 days. Even the elapsed times between events (bottom to halving, halving to peak, and peak to bottom) during each of these cycles is very consistent.
Obviously, this market cycle trend doesn't have to continue, but I believe that it will, at least for this cycle. If that is the case then I wouldn't expect the post halving bull market to begin until late October or November of this year. Looking back at the previous two cycles, the 2016 bull market started 259 days after the halving, and the 2020 bull market started 149 days after the halving. We are now 192 days past the halving that occurred on April 19th.
There is always a chance that I am totally wrong and the peak in March was the peak for this market cycle and it will be all down hill from here. But, I believe the probability of that is very low. But this is just how I am approaching this market cycle, every investor needs to do their own research and make their own decisions. I also make my decisions based on my long-term view and long time horizon.

Enhanced ATR Predicting Targets of $72,238-$74,119ATR setup is on a 1DAY TF while the chart reads 23HR TF.
Please view the long position ATR calculated targets.
Entry: $68,412
Stop: $65,668
Profit targets: $72,238-$74,119
TA setup:
ForexX Radar includes RSI, MA, and Stoch
ForexX Rate of Change, Trix, and Ultimate Oscillator are all combined.
ForexX Risk management helps understand the future
As prices change, ATR AUTO DETECTOR moves along with prices but the long position stays in place.
Who's ready for a new ATH?
Here is this other idea: $85K, The Real Deal since 6/24/24. This was calculated by using PIPS.

BTCUSD Analysis Today: Technical, Order Flow and On-Chain !In this video I will be sharing my BTCUSD analysis today, by providing my complete technical and order flow analysis, so you can watch it to possibly improve your crypto trading skillset. The video is structured in 4 parts, first I will be performing my complete technical analysis, then I will be moving to the COT data analysis, so how the big payers in market are moving their orders, and to do this I will be using my customized proprietary software, then I will be moving to the on-chain analysis and lastly I will be putting together these 3 different types of analysis.

The last bullish chance of Bitcoin in mid-term !!Currently, it can be said that Bitcoin has completed its fourth corrective wave and from now on, the price can be expected to rise to the top of the triangle.
If the triangle breaks, we expect a new ATH to occur, but in new year.
✨We spend hours finding potential opportunities and writing useful ideas, we would be happy if you support us.
Best regards CobraVanguard .💚
_ _ _ _ __ _ _ _ _ _ _ _ _ _ _ _ _ _ _ _ _ _ _ _ _ _ _ _ _ _ _ _
✅Thank you, and for more ideas, hit ❤️Like❤️ and 🌟Follow🌟!
⚠️Things can change...
The markets are always changing and even with all these signals, the market changes tend to be strong and fast!!

UPDATE: Quite clear! The Biggest Crypto Trap! BTC to the $3169,-UPDATE: Quite clear! The Biggest Crypto Trap! BTC to the $3169,- based on 100% Fib Extension. Worst case 123.60% Fib Extension. Then this could become $1528,-.

BITCOIN TIME TO EXIT IS NOW I EXITED 71,100 The chart posted is that of Bitcoin . We have now broke Above the down trendline and are now in the Blowoff phase I have exited for Good reason even though we could see it reach 81,400 . it is the timing that makes me exit while someone else wants to hold the bag. The fear greed models are in the high end and that the bonds in TLT are breaking to lows we saw my target 91.42 hit But I can make a strong case of a washout in TLT from 90.54 to 89.43 We are seeing the MOVE aka BOND VIX near Bell ringing BUY I will post this morning .Best of Trades WAVETIMER

Look at this chart and tell me we don't dump this week...So much on this chart says dump time. Very similar weekly candle pattern a couple months ago resulted in a dump week. Closing below resistance yet again. Declining volume. RSI is declining.
Help me see the pump guys, just not seeing it.
Support levels are way way lower.

Be careful with Bitcoin !!!Now we can anticipate the biggest rally in Bitcoin's history. That's it!!!
Untill Bitcoin Holds This Area Wil Keep Looking For Setups In Altcoins.
✨We spend hours finding potential opportunities and writing useful ideas, we would be happy if you support us.
Best regards CobraVanguard.💚
_ _ _ _ __ _ _ _ _ _ _ _ _ _ _ _ _ _ _ _ _ _ _ _ _ _ _ _ _ _ _ _
✅Thank you, and for more ideas, hit ❤️Like❤️ and 🌟Follow🌟!
⚠️Things can change...
The markets are always changing and even with all these signals, the market changes tend to be strong and fast!!

Bitcoin - Now Is The Time For A Breakout!Bitcoin ( BITSTAMP:BTCUSD ) will exit the consolidation now:
Click chart above to see the detailed analysis👆🏻
The only factor which is really driving the price of Bitcoin is technical analysis. And everything is pointing towards a bullish breakout above the preivous all time high and significant follow through. Make sure you somehow participate in the bullrun, either with altcoins or Bitcoin.
Levels to watch: $70.000, $100.000
Keep your long term vision,
Philip (BasicTrading)

Bitcoin: Support Levels (Main Support Is...)Since we are expecting a drop, let's look at Bitcoin's different support levels based on different high and lows and extraction methods.
➢ In relation to the up-move between 5-August and 21-October, the following levels show up as the most relevant:
1) $56,879
2) $44,311
3) $36,542
➢ Considering the move starting the 17-August 2023 low, all the way to the high hit in March 2024, this is what we get:
1) $55,041
2) $43,492
3) $35,271
Basically the same numbers...
➢ Moving averages Daily (D) & Weekly (W) timeframes:
EMA377 Daily reads —$55,282
EMA55 Weekly reads —$55,567
EMA144 Weekly reads —$43,479
MA200 Weekly reads —$40,402
EMA233 Weekly reads —$36,731
EMA377 Weekly reads —$28,903
➢ Considering the entire bullish cycle from November 2022 through March 2024, we get the following support levels:
1) $51,477
2) $44,602
3) $37,727
4) $27,938
➢ Conclusion
👉 The main three support levels are set around 55K, 43K and 36K.
These are the main support levels based on several extraction methods.
Do you agree?
What do you make of these numbers?
How far down do you think Bitcoin will go?
Leave us a boost and a comment.
Thanks a lot for your support.
Namaste.

BTC - Finally a Trade Worth TakingSo in our group the other day I posted a trade with a potential target of 95k. Yes we have been patient and patient and even more patient waiting for the right setup. Finally I there was a setup I liked and so we took it.
This was a broad seven (7) month consolidation which is often indicative of 4th waves. Look at Gold for example, broad consolidation before the next leg higher. Well same here for Bitcoin.
Now why Goldie do you take a trade at "the high"? I know you will hear many so called Furu's talk about not wanting to take a trade at a high. Well the philosophy on this is equities making new highs, make higher highs, and after a broad consolidation, a breakout is generally bullish for the equity.
This is exactly what we have here is a pretty broad breakout. So where was the signal?
Pretty simple here, nice inside bullish pinbar on the weekly with two closes above the upper boundary. I like that, shows selling is likely exhausted. Continuations occur after selling is exhausted and often when shorts get stuck trading the boundary. Here we are.
Though I have added some Bitcoin during the consolidation, (I sold my BITO and bought BTC outright, I didn't like the speed of decay) I am also taking a trade here.
Now who knows what happens, it is not uncommon to get a retest of the boundary before the move happens, and if so, and we get tapped out, I will just look for another trade. The key here is we are getting 3:1 or better on our RR so if I am right 50% of the time, I am making money!
There are a couple other coins I am looking at for this next bull run, and as I shared with the group today I have bought another coin in anticipation for a bull run. I am looking at always adding some more because once my buds that don't trade anything start talking about buying ELO I already want to be positioned.
Markets are still bull and I am going to follow up with a silver report. BULLL on silver baby!!
