$BTC Short Term PlayThis is my idea about CRYPTOCAP:BTC short term, please be cautious as we approach the halving date.
I didn't enter in this trade, this is just an idea.
* This is not FA and please DYOR.
BULLUSD trade ideas

Sharpe Ratio of DCA strategies are significantly better. The indicator in blue represents the Sharpe Ratio of a DCA strategy. In this case, as can be seen on the chart, the DCA Sharpe ratio is 6, while the "regular" Sharpe ratio is 3.
This shows that Dollar Cost Averaging strategies can significantly improve risk-adjusted returns.

Bearish Bitcoin at the end of May - the latest signalHello everyone: The graph shows successive Wyckoff accumulation and allocation cycles linked together. Any trader can check the level and agree. If this trend continues, Bitcoin could reach the 50,000-52,000 level by the end of May 2024.
But the pattern has actually been going on since early March. Accumulation and distribution.... Now it could be a downtrend or the start of a three-month bearish trend, and I will continue to provide you with reliable signals

Bitcoin- Signs of a bottom formation?Hey everyone,
what a crazy time to be in this space right now! Hope you all are fine out there! No matter if you made it through this mess or not, money comes back, always remeber that!
There will be tons of new opportunities out there in the future, this space is just evolving more and more. As scammers get revealed, people will be much more cautious, as it should be.
The one sector which I think will rise much stronger from the ashes of this whole situation will be the defi sector.
Don't trust, verify!
I don't want to talk more about this topic, so lets get right to the charts:
RSI is clearly in the buttoming territory, which has always marked the buttom relatively accurate.
More and more folks out there are shouting again "this time it's different", and they will always shout it out while sitting at or near the buttom.
That's the way market psychology works. Buttoms are created when there are no sellers left at these prices. People like these already sold and are waiting for much lower prices.
The next chart shows that we are sitting right at strong support of the total crypto marketcap:
Moreover I always like to compare price fluctuation of Ethereum relative to Bitcoin (orange line).
As you can see, imbalances in the relation of the Altcoin market to BTC often showed prominent turning points, or an imbalance in the otherwise highly correlated assets:
Let's look at the volume, shall we:
As always said in my previous posts, volume and price action are the two main factors everybody should watch.
The volume spikes we can see right now can mark the buttom, as it always did. And again, I stick to what is most likely, not to the exception!
Technically, ETH and a lot of Altcoins did not make a lower low like BTC did. So what do we need for confirmation, that this could really mark the buttom?
Reclaiming and pushing though the area of 19k - 19,5k (orange box in the image above) and also holding above 19,5k.
I could also point out that we are again in the territory where the costs of mining BTC is not profitable anymore for a lot of miners around the globe, which has also marked the buttom territory everytime.
As Satoshi said: the price will always come back to the cost of production.
It will fluctuate around this price level and eventually come back to test it from time to time. As most of you know I guess, these will rise constantly due to the halving.
There are a lot more things I could show here but I guess it's enough, these are the most important facts in the Charts in my personal view.
But I will not end this post without pointing out the current market sentiment: It is crazy bearish, as it always will be in buttom territories.
Right now everyone looks into the same direction, lower prices. Ask yourself the question: when was the last time nearly everybody was convinced that prices HAVE TO be heading in one direction?
The crowd is never right, and right now we are at the extreme end of that bearish sentiment.
Timing the REAL buttom exactly to the tip is not what I strive for and also not a realistic thought.
Finding the right range which should be a good spot for buying and holding for a longer period of time is the key element in my strategy. This is what I aim for.
*** Keep in mind that this is NOT A FINANCIAL ADVICE, just my own thoughts about the market! ***

Bitcoin, is it ready for a RUN ?!A bull flag is forming here in 1 Day TF. It is a very basic technical analysis pattern that traders use to identify potential continuations of an existing bullish trend. It is characterized by a sharp upward price movement (the flagpole), followed by a period of consolidation with downward-sloping or horizontal price action (the flag). The consolidation typically occurs on lower volume, and the pattern is complete when the price breaks out above the upper trendline of the flag with higher volume, signaling a potential resumption of the uptrend.
Here are the key components of a bull flag:
Flagpole: A significant upward price movement that forms the initial part of the pattern.
Flag: A rectangular consolidation phase where the price moves sideways or slightly downward, usually on lighter volume.
Breakout: The price movement above the upper trendline of the flag, ideally on increased volume, indicating the continuation of the bullish trend
Here, the Bull scenario will be invalidated if it breaks out in the downward direction.

Inverted Head and Shoulders Pattern for BTC/USD, Anyone?BTC/USD bulls have been making a comeback since forming a low of $56,478 and recently completed an inverted head and shoulders pattern (left shoulder: $59,559; head: $56,478; right shoulder: $60,165). Yesterday’s rally ventured through the pattern’s neckline, a descending line extended from the high of $67,273.
What is interesting from a technical standpoint is that the pattern’s profit objective – taken from the value between the head and the neckline and extended from the breakout point – merges with the all-time high of $73,845 at $73,756.

Price reaches 71 resistance then drops to the predicted level Price is in a range and will tend to go down to the predicted level today at around 19h

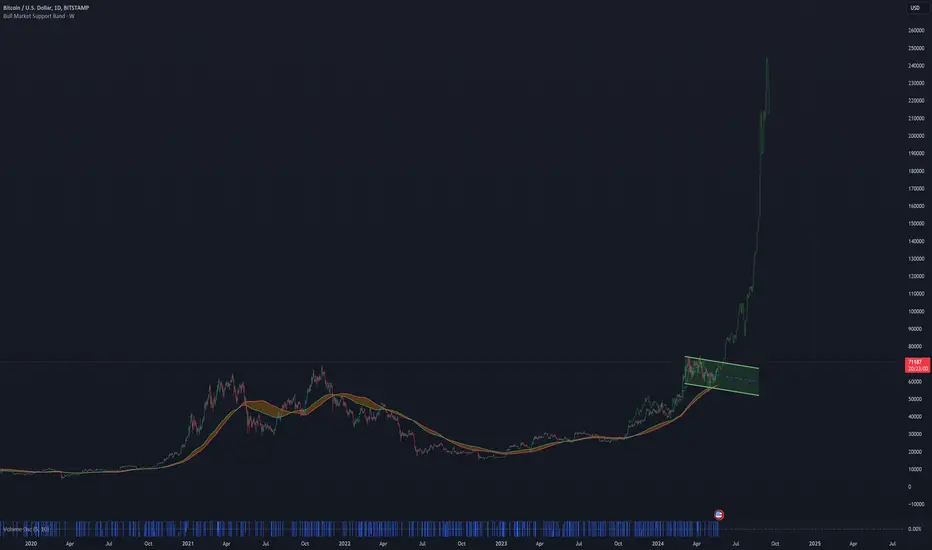
The cyclical nature of Bitcoin by RB
Hello, dear friends!😊 I present to Your attention a weekly chart of Bitcoin, which includes price action since 2016, helping us to see a more complete picture and forecast further price behavior.👍
Today, let's focus our attention on the cyclical nature of Bitcoin .
The cyclical nature of Bitcoin is a concept based on observing repetitive patterns and phases in its price dynamics.
On the chart, You can see a huge ascending broadening wedge, which I marked in white 🤍. The price has been within it since 2016. 😳 At the moment, it can be assumed that the price is aiming for the upper boundary of this wedge. 🚀
Inside this wedge, I noticed a very interesting regularity, which I'm eager to share with You.❤️
For the THIRD time, every three years, after the distribution phase (marked in orange), the price follows a significant rise of 550 percent, followed by the formation of a descending wedge, which ends with the same distribution phase and subsequent rise.
If we assume that this cyclicality is true and will repeat more, then by the end of this year or the beginning of the next, Bitcoin could reach $160,000.😱
🧐What do You think about this? Is this scenario realistic? What are You waiting for and what are You counting on?
Share Your thoughts with me in the comments!🙏
Thanks for Your attention🫶
Always sincerely Yours, Kateryna💙💛

Could Bitcoin be worth $600,000?😱Hello, friends!🫶 Could Bitcoin be worth $600,000?😱
🧐Today, let's take a look at the weekly logarithmic chart of Bitcoin and try to identify similarities and patterns in its movement to discuss the future price development.
I've highlighted support levels with green 🟢 lines (looking at the overall chart, these levels represented accumulation zones for future growth), and resistance levels with red 🔴 lines (where bullish trends typically ended).
💡 Pay attention! The lower support line was touched twice in 2015-2016, and the next time this happened was in 2023-2024! Looking at the chart, it strongly resembles an accumulation zone!🔋
Could there be a longer cycle?🤩 Let's say, not a 4-year cycle (from halving to halving), but a cycle lasting 10 years? Could Bitcoin be worth $600,000?😱
I'm so interested to hear your opinions and expectations for the upcoming halving and the following year.😏
The world situation is worrisome and doesn't inspire optimism.😔 But if we remember the times of the coronavirus pandemic, then similar sentiments prevailed.🤪
What are your expectations? Let's discuss!😇
Thanks for Your attention!
Sincerely yours, Kateryna💙💛

$BTCUSD - Is this the right Head and Shoulders?Hi guys! 👋🏻
🔔 Bitcoin is back up after a slide to supports at $60500
🔔 There's a possility of a continuation of an uptrend up to $70100, where CRYPTOCAP:BTC will hit the dynamic resistance and upper band of the flag.
✊🏻 Good luck with your trades! ✊🏻
If you like the idea hit the 👍🏻 button, follow me for more ideas.

BTC updateIs this where we are headed, hopefully but the fear is more what happens after guess we will only know when it happens, but like I always say it can change its mind and go south hard just be focussed and careful...

Tentative top on $BTC ATH by end of MayGann Square on CRYPTOCAP:BTC indicating a decisive movement over this Wedge
There is a region of several confluence trendlines marked in the orange circle
That region will be reached by end of this month according to this analysis

3 Different Bull Scenarios for BTC Apr-May 2024 🍃🌻🥵I should preface and say that these 3 different predictions are based off a similar price action that occurred between June and July 2017, where the sentiment for BTC was very similar to the current sentiment we face here in April and May 2024. I believe that a lot of the run up of this bull market for the next year or so will be similar to 2017 where positive news for BTC keeps coming. I know some argue the ETFs don't play a big role in price action, but I strongly disagree long term. If BTC has taught me anything throughout the years it's that information and knowledge of the asset has only strengthened its fundamentals and allowed it to prosper to what it is today. When individuals truly understand the benefit of having BTC in their portfolio (or even retirement), it's a notion/idea that can't be easily shaken off. Given that interest rates are likely to be cut later this year and inflation showing no signs of slowing down, I think it's impossible for me to be bearish on BTC. The largest asset managers in the world will not stop hyping up BTC and their ETFs. This all being said, I was very wrong about the short term price action and am re-evaluating possible scenarios that may play out in the next 2 months.
June-July 2017 was a moment in time where BTC just pressed up against $3,000, got rejected, and it took an entire month for it to eventually blow straight through. While the overall sentiment seems very positive for BTC right now, the one thing we cannot mentally get past is that $70k barrier. And while we have passed it, it was not held convincingly. Maybe we got too ahead of ourselves thinking this could keep running up with no pullback- I know I definitely did.
I'm more bullish than I ever have been, but I think recognizing that the market does not move as fast as we always want it to is important. For ETFs, these products take time to prosper in markets. Luckily for us, the crypto markets move quick (relative to other markets).
So here are 3 bullish scenarios. If anyone watched, that dump last night was aggressive. This is trader's territory now. If there is no bounce within the coming days (I don't expect there to be a big one), then we will continue bleeding out to $61-59K. I think it's going to take some real FOMO to be witnessed if we want this bounce to be grand. These bull market cycles have taught me that just one strong bounce alongside ongoing positive news can completely switch the narrative and price action. Because the truth is, there has been almost no bad news for BTC since January. If there has been, please enlighten me. Because most of the negative Crypto news I read is related to other coins (worth noting I hold ETH as well).
So breathe in, hold it.... and breathe out. We will be okay. This bull market is just getting started. The positive sentiment, good news, and true value of BTC are all very real. Honestly I hope I'm wrong and we shoot up ASAP. Unfortunately, price action I don't think is always necessarily timed out accordingly with factors such as sentiment and news. Let the short term traders do their thing, and HODLers will still end up rewarded in the longer term.
But as always, BTC has humbled and continues to humble me. Good luck traders and HODLers!


BITCOIN/U.S DOLLAR TO 84300$ IN THE NEXT FEW WEEKSHello Everyone,
Based on my technical analysis, Bitcoin is expected to continue its uptrend towards $84,300 with a high probability and a favorable risk-to-reward ratio.
There are two main reasons to consider this investment:
1. Elliott Wave theory on Weekly Chart: As mentioned on the chart, there is a clear Elliott Wave configuration that indicates the possibility of the final impulsive wave (the fifth wave) occurring.
2. Volume Indicator: The significant volume that appeared last week shows the strength of buyers entering the market.
Given these reasons, there is a high probability and a favorable risk-to-reward ratio of over 2.5 to 1 that Bitcoin could reach $84,300 within a few weeks.
IBROURI


Bitcoin bearish fractal Jan 2018This is another top signal for Bitcoin that occurred in January 2018, similar to the bearish pattern found in July 2019 below.
The bounce over the last few days could be just a three-wave ABC retracement pattern back to the Fibonacci 0.7 level. This fractal suggests that Bitcoin will start going down from here until the halving. If it cannot surpass 73K USD in the next few days, the chance of this fractal playing out will increase as traders will treat it as a lower high.

Bitcoin with mixed signals showing indecision Bitcoin is showing signs of weakness near its recent high of 63444 . Bearish signals and RSI divergence is seen. However, still not very convincing given increase in volume today and increasing bullish signals on higher TF, it is still too early to enter market.

Bitcoin A New HopeIf you listen to the Galactic Republic, you might think that the entire banking system was going to come to an end, and the only way out of it is to deliver more control/freedom to the Republic so they can "guarantee" you'll be taken care of, and don't worry, it wont cost you a dime, we'll make the bad guys pay for it. But in a glimmer of hope the Confederacy of Independent Systems has slowly been regaining their ranks and position since the 2022 Great Bear Attack.
The Galactic Republic swooped in to gain control of the system in 2020, by gaining total control of the universal news system, they experimented and molded the next generation of keyboard warriors to insure that the Internet Galaxy remained cluttered with their informational trash, making it near impossible to navigate through the system unabated from the Republics reach/influence. Many of the Confederates forces were forced off grid and underground to recuperate from the onslaught they suffered by the reprogramming of their drone peers, easily confused and influenced to accept even the most repressive of measures against themselves.
Confederacy of Independent Systems seems to have gained substantial ground since the start of 2023, rehabilitating drones with proper programming to understand their CPUs were compromised and they were harming not only themselves, but those they were programmed to pretend to care about with stupid likes, upvotes, and retwats.
The future is bright, stay strong.
"It is an honor to stand before you, for you represent the freedom and the future of our galaxy. The once-great Republic and Jedi Order have become victims of their own ambitions, and the Supreme Chancellor is no more than a pawn of corporate monopolies. As a people you called out for change, you called out for leadership, and I humbly answered that call."
―Count Fabooku

BTC long Bitcoin has come a long way since its first recorded price of less than a cent. In December 2023, one Bitcoin was worth roughly $42,000. By March 2024, BTC set a new all-time intraday trading high by breaking through the $69,000 level. The idea that Bitcoin could one day be worth a million dollars per unit, as Sciberras points out, “really shows how far we’ve come”.
Bitcoin’s performance in 2024 depends on a variety of potential bullish and bearish catalysts. Numerous factors, such as institutional adoption, the halving, regulatory changes and macroeconomic trends will influence the price of Bitcoin in 2024.
During 2023, the crypto industry was rocked by a series of enforcements that shook confidence in the sector. The U.S. Commodity Futures Trading Commission filed civil enforcement action against crypto exchange, Binance, and its founder and CEO Changpeng “CZ” Zhao.
However, in November, Binance settled with the U.S. Treasury and Department of Justice, with CZ agreeing to step down and hand over the reins as part of the deal.
Sciberras notes that, most importantly Binance was not accused of misusing customer funds and “did not see a bank run on the exchange.”
“This was one of the best outcomes the market could’ve hoped for, and crypto prices rallied as a result,” he says.
“Binance was a massive gray cloud hovering over crypto, and the settlement is a huge green flag heading into 2024.”
Interest Rates and Bitcoin
Chair of the U.S. Federal Reserve, Jerome Powell, has indicated that the central bank may have reached the peak of its rate hike cycle, which Sciberras thinks could be a catalyst for a Bitcoin rally in 2024.
When interest rates stabilize or fall, cryptocurrencies such as Bitcoin can offer an attractive place for investors to park capital due to its perceived hedge against traditional financial systems and increasing scarcity—especially as the halving approaches in May.
“Estimates forecast three 25-basis-point rate cuts in 2024, a more aggressive outlook than what they have previously signaled,” Sciberras says.
Sciberras recommends investors keep an eye on inflation from the personal consumption expenditures (PCE) price index, as Powell has left the door open for further rate rises if it begins to creep back up.

Macro Bitcoin ThesisThis will not be appreciated and who knows if it's right but here's my last macro prediction for the distribution of risk assets.
Curtesy of x/ki_young_ju we have what looks like to be miner selling beginning. ETF inflows are still increasing, though.
x.com
We have what looks like Bitfinex exiting stage left.
Easy to see when exchanges deviate from the Bitcoin average price we get tops.
Bitcoin Dominance is topping as well. This will be the best time to predict where you are selling your altcoins as they are already popping off, and have much more room to grow from here while Bitcoin stalls.
My idea for the flows of liquidity will be US firms will still want exposure to their Bitcoin through the ETFs but the rest of the world hasn't had the regulatory hurdles the US had, so they will be selling their Bitcoin to the US at top tier prices, causing a top, in my opinion.
The price discovery periods for Bitcoin, although higher in price, will average less in magnitude.

