BTCUSD 1D UpdatedBTC ~ Updated
#BTC The $80,000 gate was just a matter of time. tell me if the price of BITSTAMP:BTCUSD is already $80,000
BULLUSD trade ideas

BTCUSD Mid Week AnalysisI'm tapped into something oh so special. Come Get Some!!!!
_SnipeGoat_
_TheeCandleReadingGURU_
#Like #Share #Subscribe #PriceAction #MarketStructure #TechnicalAnalysis #Bearish #Bullish #Bitcoin #Crypto #BTCUSD #Forex #DayTrader #SwingTrader #PositionalTrader

Looking for wave 4 on BitcoinWatching for wave 4 here on Bitcoin.
Could pull back to 50k
Stay safe and stay profitable.
- Dalin Anderson

Bitcoin (Hold your Breath) detailed comparison:
GOLD VS BITCOIN
### 1. **Nature and Function**
#### Gold:
- **Physical Asset:** Tangible, with a long history as a store of value and medium of exchange.
- **Utility:** Used in jewelry, electronics, and various industries.
- **Historical Value:** Recognized for thousands of years as a reliable store of value and hedge against inflation.
#### Bitcoin:
- **Digital Asset:** Intangible, created in 2009 as a decentralized digital currency.
- **Utility:** Used for digital transactions and as a speculative investment.
- **Modern Value:** Seen as "digital gold" due to its limited supply and role as a store of value.
### 2. **Supply and Scarcity**
#### Gold:
- **Finite Supply:** Limited by natural availability and mining capacity.
- **Production:** Mining can increase supply, but at a relatively slow and steady rate.
#### Bitcoin:
- **Capped Supply:** Maximum of 21 million BTC, controlled by its underlying protocol.
- **Production:** New bitcoins are created through mining, with rewards halving approximately every four years, reducing the rate of new supply.
### 3. **Market Characteristics**
#### Gold:
- **Market Size:** Large, established market with significant global liquidity.
- **Price Stability:** Generally more stable, with price movements influenced by macroeconomic factors, industrial demand, and investor sentiment.
#### Bitcoin:
- **Market Size:** Smaller but rapidly growing market.
- **Price Volatility:** Highly volatile, with prices influenced by market sentiment, regulatory news, technological developments, and macroeconomic factors.
### 4. **Investment Profile**
#### Gold:
- **Risk Profile:** Considered a safe-haven asset, low to moderate risk.
- **Returns:** Historically steady, long-term appreciation with lower short-term gains.
#### Bitcoin:
- **Risk Profile:** High risk, with potential for high rewards and significant losses.
- **Returns:** Has delivered substantial returns over the past decade but with considerable volatility.
### 5. **Role in a Portfolio**
#### Gold:
- **Diversification:** Used to diversify portfolios and hedge against economic downturns and inflation.
- **Liquidity:** Highly liquid, with a well-established global market.
#### Bitcoin:
- **Diversification:** Increasingly used to diversify portfolios, particularly in the context of digital assets and technology investments.
- **Liquidity:** Growing liquidity, but still more limited compared to gold, with risks of regulatory changes affecting access.
### 6. **Regulatory Environment**
#### Gold:
- **Regulation:** Generally well-regulated across the globe, with established markets and trading norms.
- **Ownership:** Easily transferable, with well-defined legal frameworks for ownership and trade.
#### Bitcoin:
- **Regulation:** Varied regulatory landscape, with some countries embracing it and others imposing restrictions or bans.
- **Ownership:** Can be transferred digitally across borders, but subject to changing regulatory environments.
### 7. **Future Potential**
#### Gold:
- **Stable Demand:** Likely to remain a valuable asset for investors seeking stability and a hedge against inflation.
- **Limited Upside:** Potential for steady appreciation, but dramatic price increases are less likely compared to riskier assets.
#### Bitcoin:
- **High Growth Potential:** Could see significant price appreciation if adoption increases and it becomes more integrated into the financial system.
- **High Risk:** Faces regulatory uncertainties and competition from other cryptocurrencies and digital assets.
### Conclusion
Both gold and Bitcoin serve as stores of value but differ significantly in their characteristics, risks, and roles within an investment portfolio. Gold offers stability and a long track record, making it a safe-haven asset. Bitcoin, with its high volatility and potential for significant returns, appeals to those willing to accept higher risk for the possibility of substantial gains. Investors might choose to include both in their portfolios for diversification, leveraging gold's stability and Bitcoin's growth potential.

Bitcoin 300% more.Bitcoin bull markets have historically seen significant price increases, but the percentage gain can vary widely between different bull markets. Here’s a summary of the percentage increases during major Bitcoin bull markets:
1. **2011 Bull Market**:
- Start: Around $0.30 (January 2011)
- Peak: Around $32 (June 2011)
- Percentage Increase: Approximately 10,500%
2. **2013 Bull Market**:
- Start: Around $13 (January 2013)
- Peak: Around $1,100 (December 2013)
- Percentage Increase: Approximately 8,300%
3. **2017 Bull Market**:
- Start: Around $1,000 (January 2017)
- Peak: Around $20,000 (December 2017)
- Percentage Increase: Approximately 1,900%
4. **2020-2021 Bull Market**:
- Start: Around $10,000 (October 2020)
- Peak: Around $64,000 (April 2021)
- Percentage Increase: Approximately 540%
### Average Percentage Increase
To find the average percentage increase of these bull markets, we can calculate the mean of the individual percentage increases.
\
Let's compute that:
\
So, the average percentage increase during Bitcoin bull markets is approximately **5,310%**.
Note that this is a rough average and the actual performance in future bull markets can vary significantly due to a wide range of factors including market maturity, regulatory changes, macroeconomic conditions, and technological developments.

Bitcoin Google Trends Lagging Behind Price as a Bullish SignAccording to my analysis, there’s a significant correlation between Google trends (the frequency of Google searches) and the price of Bitcoin.
Coincidentally, lower volumes of Google searches signify quiet times in the market from the retail perspective.
Since March 2024 there’s been a decline in Google searches for Bitcoin. This can be interpreted as a lower interest from retail. However, the retail interest trails the price, meaning that we expect Google trends to grow next month.
This can be seen as positive as a low volume of searches mean that the retail is waiting on the sidelines and will "FOMO" soon.

Cup and handle pattern + Rounded Bottom PatternCup and Handle is an continuation pattern.
Rounded Bottom Patern are also too.
they can be very accurate, on average 50% in the first and 68% in the second reach the targets at 30% and 29% respectively according to studies on normal targets.
In normal markets the charts used are weekly.
I do not have studies to present with bitcoin, but I bring a technical analysis based on capital market studies.
Source: Technical analysis of financial markets, LEMOS, Flávio.

BTC Weekly Short Idea -75K Liquidity ZoneAccording to #BTC weekly chart we have weeks left until we start to retrace again (If we trade similar to last breakout)
- Take profits in the 73-75K zone
- Trade Alts
- Return on the dip or if btc males it to 80K and the idea fails

BTC Cup and Handle - Target $84kBTC is forming a beautiful looking cup and handle pattern on the Daily chart. In addition we have bullish hidden divergence on the combined all exchange volume accumulation distribution indicator. All of this of course with the background of the post halving bull run widely predicted to be kicking off any time now and this is looking like an excellent opportunity.
Buy on a strong breakout of $71k level.
Stop Loss: Below handle at $66k
Target: $84.2k

BTCUSD LONGSBTC Idea from a week or two ago is playing out. Buy side liquidity resting at the highs giving great confluence for longs.

BTC BULL CYCLE FORENISCSBTC BULL CYCLE FORENSICS
Dissecting previous BTC cycles to develop a roadmap for what is to come
-- Chart originally prepared February 2024

Bitcoin | BTC | BTCUSDT | BTCUSD | BTCUSDC key levelsBitcoin | BTC | BTCUSDT | BTCUSD | BTCUSDC key levels
A falling wedge (fw) pattern forming in BTC daily chart on closing basis , FW brkout on upper side will make btc bullish

$BTCUSD BEARISHA rejection at this resistance zone will activate my sell order.
I still believe that Bitcoin is not ready for bullish re-run.
Entry 73000
sl 73600
tp1 66000
tp2 62000
tp3 60000
least.
note: Wait for rejection on a daily frame.
****************************************
Use a stop order and do your own research before trade

Bitcoin - Upside potential of 22% to 38%I'm looking at the Elliott Wave structure here and using the Fibonacci retracement and projection tools to determine the most likely resistance zones.
Why? Because it's clear by now that price is consolidating and a new move higher is about to come (depending on your trading style, the rise has already started).
So, I don't think the question here is IF bitcoin will go higher but rather WHEN.
Chances that this will collapse before we see a new high first are low in my humble opinion.
(low =/= zero, so always use a Stop loss!)
(Personally I bought BNB yesterday which in hindsight was not a bad idea, 🍀! ).
So, back to our upside targets.
First off though,
The measures shown here are valid ONLY IF my minuette (blue) wave count is correct!
I'm being cautiously bullish and assuming the blue wave count being an impulse with an extended wave (i) of 96% increase and a wave (iii) being 78%.
For those that don't know, the Elliott Wave theory has some very simple rules and guidelines and one of them is that wave 3 can never be the shortest, meaning it can not be shorter than wave 1 AND wave 5! (don't worry about wave 2 and 4 for now).
So, by respecting that rule we can assume that wave (v) must no be more than 78% otherwise this wave count is incorrect and we have to consider a more aggressively bullish view. (look at my previous post about Bitcoin).
So, in that case, the wave count gets invalidated if price goes above 108k.
By measuring different lengths of current rise using the Fibonacci projections and retracements, we get some cluster zones where different measures come together. Those zones, we can expect, are the most likely to act as resistance and that price will slow down and consolidate or simply reverse from those.
(Remember, support and resistance levels are always hypothetical, we can only be sure once they are established!!!)
Here, according to my measures, the most likely levels are
and .
For those who like it, by also studying the expected rise on a smaller time frame coming days, (remember, markets are fractal), we can again use the Fib measures to better pinpoint the potential reversal zone(s) of the move.
Depending on your entry, risk appetite and simply your trading time frame, consider it for yourself if micromanaging the position is worth it.
Thank you for reading my post, hope it's helpful.
PS : sorry if the chart isn't very clear, I'm on the road and don't have my computers with me but wanted to still share my opinion on this one.
PS :

BITCOIN FAIR PRICE (Upper) Until June 23. #BTCUSD : $71,375BITCOIN FAIR PRICE (Upper) Until June 23. #BTCUSD : $71,375
Overbought (sell signal) above: $73,068
Oversold (Buy signal) below: $69,682

I suspect a breakout is imminent Price has managed to hold this range for the past two weeks. Therefore it can said that there has been enough time for active sellers to sell. Spot flows are bullish. The perp market is not yet overextended.
It seems most probable that equilibrium is higher.

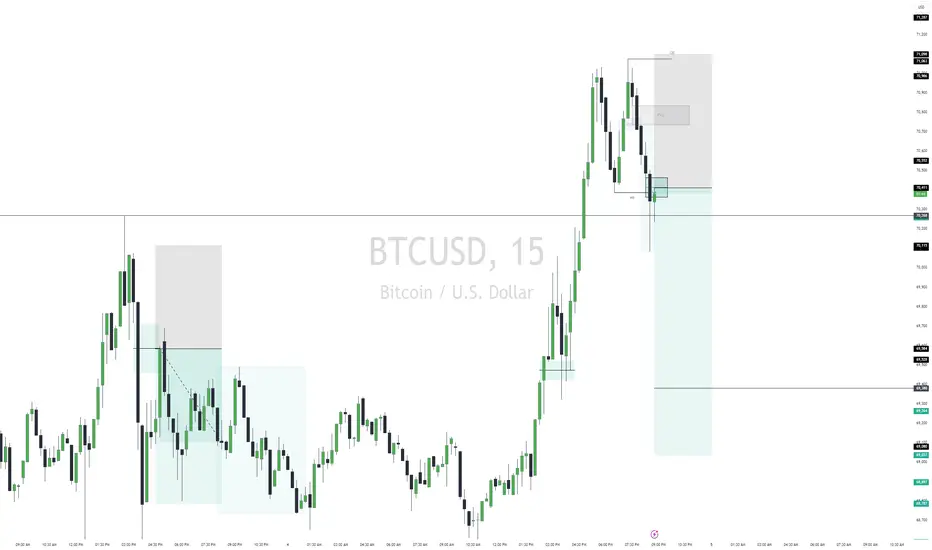
BTCUSD Sellwe are selling, looking at the chart we can see sweep of PDH and ARH we have displacement and IMB along with MSS we enter off the IMB and target 1:2 lets see how it goes.
BTCUSD Long: To the moon?Context:
Currently trading above previous high from Nov. 2021 with bullish FVGs on monthly chart - but we are now in a consolidation, but with upwards tendency. Same for the weekly chart - we just took out the previous week high.
Idea:
• Entry between prev. week high and prev. day high after 4h close above bearish FVG.
• Entry in mentioned area preffered with a lower timeframe setup like a reversal candle on 30min.
• Approach of the entry should be without FVGs on 30min. Otherwise wait for bearish 30min FVG to be closed.
Stop: Below your 30min entry setup
→ 1st TP: Around ATH / 73500
→ 2nd TP: trailing stop: "sky is the limit"
When does this scenario become invalidated? If the current 4h candle becomes a confirmed reversal candle. Then we could rally lower to at least 69000.

Bearish engulfing Candle patternLots of info how to trade this, just sharing here incase you missed it - food for thought

+4R Textbook trade breakdown☝️Do not act based on my analysis, do your own research!!
The main purpose of my resources is free, actionable education for anyone who wants to learn trading and improve mental and technical trading skills. Learn from hundreds of videos and the real story of a particular trader, with all the mistakes and pain on the way to consistency. I'm always glad to discuss and answer questions. 🙌
☝️ALL ideas and videos here are for sharing my experience purposes only, not financial advice, NOT A SIGNAL. YOUR TRADES ARE YOUR COMPLETE RESPONSIBILITY. Everything here should be treated as a simulated, educational environment. Important disclaimer - this idea is just a possibility and my extremely subjective opinion. Do not act based on my analysis, do your own research!!

Bitcoin (BTCUSD Coinbase) Cup and handle to 85k or chaos? This is a cup and handle and projected breakout should be around 85k. Our recent correction hit the .5 fib and bounced back up to 70k then hit 71k earlier Monday. This price action completed the handle of the cup. Bitcoin looks to be close to be pushing against the shorts and this should power the next big breakout. It it fails I think we drop down the the golden pocket between the .68 and the .65 fib and then we try breakout again.
As this all plays out this Bitcoin bull run has a huge headwind with traditional markets sputtering and seem to be in a topping formation over last year and a half. This adds a huge risk to Bitcoin and could crash the price if these markets start to tumble. This risk didn't exist in the past Bitcoin bull markets making this run unique. We will have to wait to find out the next moves as data becomes available. Cheers

BTCUSD - CUP AND HANDLE WEEKLY CHARTThis chart is only for educational purpose and it is not a recommendation for trading.
This study is only based on past chart patterns which have been studied by various technical analyst.

hey there elliotwave analysehello< i am targetting wave 3 around 130k will take profits there... have a nice one and stick to the plan what you made ;)
