BULLUSD trade ideas

BTC / m1the massive HS on BTCUSD/M1
M1 is the money supply that encompasses physical currency and coin, demand deposits, traveler's checks, and other checkable deposits.
For a few years ive been very curious about this way to look at things.
It looks very very bullihs, and so does SPX/M1 as I link to here :
It all can fit as a new dot.com boom featuring AI and crypto.
I mean.. isnt that coming ?

Bitcoin - Hot coffee cup - Jun 2024Enjoy the Bitcoin - Hot coffee cup for Jun 2024....... fuel collected...rockets ready...etfs done.... LFG !!!!!!

Bitcoin - a Project of the Federal Reserve? Conspiracy timeThe Bitcoin cycles are determined by halving - we all know this. It happens every 4 years, just like drum roll = U.S. presidential elections.
Let's start with history.
The Great Financial Crisis of 2007-2008 turned the global economy upside down, making everyone realize that the system needed a change.
The Fed began to sharply lower the U.S. interest rate (a lower rate = cheaper loans, money and mortgages become more accessible, and markets start to grow).
Barack Obama became President in November 2008.
The Fed brought the rate to its minimum by December 2008.
Attention!
In January 2009 (one month after the rate was lowered to the minimum and two months after the U.S. elections), the first Bitcoin block was mined.
When was the first Bitcoin halving?
In November 2012, right after Barack Obama's re-election.
Bull run!
When was the second Bitcoin halving?
In July 2016, Trump was elected in November.
Bitcoin with its halving started to outpace the presidential elections because the hash rate increased and attention to Bitcoin grew.
Bull run!
The gap between the halving and the elections became roughly 4 months.
When was the third Bitcoin halving?
In May 2020, Biden was elected in November.
The gap between the halving and the elections became 6 months.
When was the fourth Bitcoin halving?
In April 2024, a new president will be elected in November 2024.
The gap between the halving and the elections will be roughly 7 months.
Is Bitcoin a project of the U.S. government?
Are they hedging in it, realizing that the dollar will eventually come to an end?
I don’t have answers to all these questions. I’m just looking at the charts, reading smart books, and sharing this madness with you.

BTC/USD Long TradeThis trade involves a bullish flag pattern on the 4H timeframe within an overall bullish trend. The risk to reward ratio is excellent at 1:4. With an anticipated post-halving move approaching, it offers a strong potential for significant gains relative to the risk taken.

The cost of BTC after halving (May '24)At the moment, the cost of BTC is about $39K. After halving the cost will be about 88K for the best miner at an electric power price of $0.10 per kWh

BTCUSD is clearing its way for bullish to reach $73000.00.BTCUSD is clearing its way for bullish to reach $73000.00. BITSTAMP:BTCUSD
BTCUSD is expected to reach $73000.00 as per the technical analysis for BTCUSD Futures Contract (May 2024) and Bitcoin (BITSTAMP:BTCUSD) as of May 1, 2024. The analysis uses indicators such as Moving Averages, Oscillators, and Pivots. Key indicators include Relative Strength Index (RSI), Stochastic %K, Commodity Channel Index (CCI), Average Directional Index (ADX), Awesome Oscillator, Momentum, MACD Level, Stochastic RSI Fast, Williams Percent Range, Bull Bear Power, and Ultimate Oscillator. Moving Averages are not specified, and the information provided is not personalized investment advice. It is recommended to conduct research and consider risk tolerance before making any trading decisions. BITSTAMP:BTCUSD
BITSTAMP:BTCUSD LIKE👍, COMMENT 💬 & FOLLOW ➕, these figures can encourage me to analyze more efficiently for you. My all followers are requested to support me, comment my ideas and share your thoughts in comment box and new comers are invited to follow and support me.

#BTC/USD Forecasts Suggest a Rally to $85,000 in Q3!📊 BTC/USDT Technical Analysis by Cryptorphic 📊
As of June 3, 2024, BTC/USDT is showing promising signs of a potential breakout. The price action is currently testing the upper boundary of the bullish flag in weekly, with significant support levels around $62000.
🔍 Key Levels:
- Support: $62,959.01
- Resistance: $69,001.80 (Current Price)
The 200 EMA has acted as strong support, with the price bouncing off the highlighted support zone multiple times. The recent bullish momentum suggests a breakout could be imminent.
🟢 Bullish Scenario:
- A breakout above the current resistance of around $69,000 could propel BTC towards the next psychological level of $72,000 and beyond.
According to Fibonacci extension levels, BTC could reach approximately $86,700 within the next 6-8 weeks.
🔴 Bearish Scenario:
- Failure to break above the resistance may lead to a retest of the $62,959.01 support level.
Stay tuned for more updates and trade wisely! 📈
Please hit the like button if you like my charts.
Thank you
#PEACE

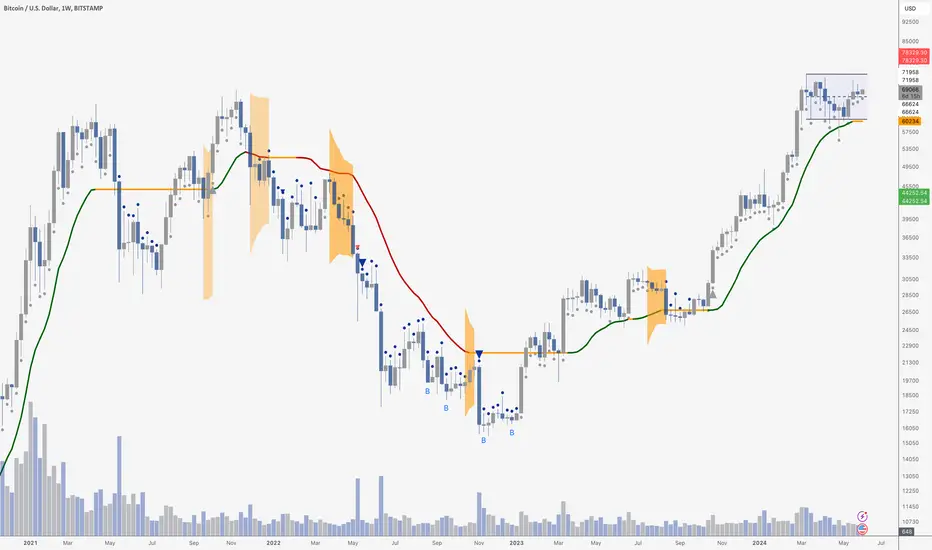
BTC LOOKS STRONGIt is essential to occasionally zoom out.
Taking a look at the weekly chart gives us an astounding picture of Bitcoin’s move. This consolidation looks like almost nothing after this run up from $15,000 - just the expected chop after the halving.
As you can see, we are trading in the top half of the blue range, which means we should eventually visit the range highs. A break above send us back into price discovery,
Be patient - everything still look exceptionally strong.
BTC simple analysis: Volume correctionElliot Wave on recent bearish trend finished. High volume candles where left behind. Waiting for volume correction.
Chart bounced on 300% E.W. fibo. . Fibo is between 2 and 4 peaks of E.W.
Expecting to reach at least, cloose to the top of closest H volume candle.

BTCUSD Short: Completion of Wave 2Update to my idea previous where I mentioned that I expect a wave B down and then a wave C up. Now that I expect this wave 2 to have completed, it is time to short BTCUSD.

May 31 Bitcoin Bybit chart analysisHello
It's a Bitcoinguide.
If you have a "follower"
You can receive comment notifications on real-time travel routes and major sections.
If my analysis is helpful,
Please would like one booster button at the bottom.
Bitcoin 30-minute chart.
Nasdaq has an indicator announcement at 9:30.
Today is bit and tether dominance
It is really difficult to analyze because both sides are imminent.
The possibility of a sideways move is very high.
Tether dominance in patterns or flows
It is more likely to rise than beat.
Nasdaq is also in a situation where a rebound is unlikely.
We created a strategy that was as safe as possible based on sideways movements.
*Sky blue finger movement path
Long position strategy
1. $67676.5 long position entry area / stop loss when breaking out of the light blue support line
2. $69,008 long position primary target -> Top secondary target
Section 1 at the bottom is
The major support line is 12 + the daily support zone.
There is a very high probability that you will come down to this section today.
So, I took the stop loss at a breakaway from the light blue support line.
In this section, the rebound is weak or
If there is a further decline in Nasdaq
Bottom -> Section 2 at the bottom
Please note that it may continue to flow throughout the weekend.
Because there are no danger signals
There was no final short position operation today.
If today's strategy succeeds, over the weekend [
It looks like Bitcoin will surpass 100 million again.
If you drag the analysis text up or down,
I have left the main support and resistance prices above and below.
I think it would be a good idea to use it as a reference.
Please note that my analysis up to this point is merely for reference and use.
I hope you operate safely with principled trading and stop loss required.
thank you

Bitcoin is fake breakoutHello dear friends,
Bitcoin can correct after a fake breakout and touch $74500 to the target of $49600 and follow the path of the picture.


uptrend As long as the price fluctuates above the support range, the continuation of the upward trend is likely.
There is also a possibility of rising to the level of 138%

BITCOIN BEARS WILL DOMINATE THE MARKET|SHORT
Hello,Friends!
BITCOIN pair is trading in a local uptrend which we know by looking at the previous 1W candle which is green. On the 1D timeframe the pair is going up too. The pair is overbought because the price is close to the upper band of the BB indicator. So we are looking to sell the pair with the upper BB line acting as resistance. The next target is 58579 area.
✅LIKE AND COMMENT MY IDEAS✅

BTC ready for the pump??As I marked out you can see a descending channel followed by a bullish pendent that's breaking out. I've also marked out key levels that price bounces from. As of today price has reacted of the range of 67500 (Each level being marked 2500 apart). I believe we can be seeing prices reaching 82500 pretty soon! Hope everyone is having a successful trading day so far. BTC to the Moon. good luck everyone

BTCUSD SMALL RISK ENTRYI cancelled the previous short position and put a limit on the chart above. Just my own analysis
TYOR!!!

BTC: tight consolidation, preparing for a big pump aheadBTC: tight consolidation, preparing for a big pump ahead
-BTC is shaping various chart patterns, maybe
-Triangle/ Inside Bars.
-Inversed HnS.
-Bull flag.
-Cup n Handle.
.
US STOCKS- WALL STREET DREAM- LET'S THE MARKET SPEAK!

(BTC) bitcoin "rsi divergence"Bitcoin rsi divergence levels have reached a very low range based on a custom measurement and custom input source. Either way the price of bitcoin moved flat based on a previous low, leading into a bullish trend forming and the price travelling higher.

BTC BreakdownWe could see a breakdown of CRYPTO:BTCUSD into the $64,000 range where it will find a strog support zone.
From there, as long as we can respect the current trendline, we could see accumulation and start to gain some momentum, continuing the push to the upside.
BTC will likely chase the Liquidity that sit's in the $72,000 range from the open short interests.
imgur.com
If BTC does chase the liquidity it could potentially set a new ATH while breaking out of the Cup & Handle formation, making it a very bullish situation.
$75,000 and $55,000 are the zones to watch out for.

Bitcoin: Push Back To 70Ks?Bitcoin support at the 66K area continues to hold and may be the higher low (wave (iv)) that may lead to a higher high over the coming weeks (see illustration). In order for a dramatic new high like 80K to be tested, price needs to prove itself by clearing 73K first. The key to navigating this is to WAIT for the market to provide evidence (confirmation), NOT get stuck on an opinion about the future. Even though the broader trend is bullish, UNTIL it breaks out, it is within reason to expect the consolidation to continue.
Recognizing the support/resistance levels within broader consolidations can help to uncover numerous opportunities, especially on smaller time frames. For example, while I consider the 66K area a minor support on this time frame (see arrow), this location is a great spot to anticipate longs on day trade time frames like the 1 or 5 minute chart.
When using such levels as a form of context to guide decisions, traders often do not understand how to shape expectations relative to the magnitude of the time frame. For instance, price movements on a 1 minute chart are typically smaller than a 5 minute or 1 hour chart. Knowing this should shape expectations in terms of reward/risk. This is one of the problems I aimed to solve when coming up with the idea for Trade Scanner Pro by automating the exit points using the average true range (ATR).
The same can be said about the 70K whole number resistance area. This is an ideal location to WAIT for sell signals, whether to take profit or an aggressive counter trend trade short. Again the location provides a point of reference where we can anticipate a particular price behavior or opportunity. It is up to the MARKET to confirm and even then, there is a chance it can get stopped out (markets are mostly RANDOM).
My analysis is meant to shed light on a select range of possibilities over the coming week for day and swing traders. I have to remind people of this because many come to these articles expecting to gain knowledge of the future. It will take some time to realize effective risk management has NOTHING to do with where price will be in the future. There is no way to forecast the future accurately, ESPECIALLY using the limited information that is available on charts.
The idea is to help you prepare for potential opportunities that I believe have a greater probability of a positive outcome because of the price location relative to the trend. The MARKET decides what scenario will play out, not me or anyone else. To align with the market, we must have a passive mindset, good listening skills and the ability to admit being wrong QUICKLY, especially on smaller time frames.
So here is how to prepare of the coming week: IF the low 66Ks are tested, look for longs, IF 66K breaks, avoid longs and reevaluate new levels. IF 70K is tested, look to take profits, or consider aggressive shorts (counter trend). IF 70K is cleared, watch for test of 73K. How you navigate your positions is a function of your risk tolerance and personal style. Most importantly, let the market do the THINKING, you simply adjust to the new information as it appears.
Thank you for your considering my analysis and perspective.

BRIEFING Week #22 : Rotation Signaling is HereHere's your weekly update ! Brought to you each weekend with years of track-record history..
Don't forget to hit the like/follow button if you feel like this post deserves it ;)
That's the best way to support me and help pushing this content to other users.
Kindly,
Phil
