USD/CAD BEARISH?I thought it would bounce off the support on this head and shoulders but did break now I think it will retest and go bearish
CADUSD trade ideas

USDCADlong position idea, OS on the 4hr with rejection of daily support. 1hr MA price cross confirmation. COT and fundamentals align. RR is 1/2

USDCAD - Oil drop, CAD weakenFundamental
Crude oil prices fell sharply after regional tensions eased. With crude oil export output to the US, falling oil prices will cause CAD to weaken
Technically, USDCAD has headed towards the 1.3569 support zone, the strengthening of the USD is starting to make an impact, the USDCAD trend may reverse.

usdcad → is it the end of an upward?hello guys...
as you can see a wedge pattern formed and the price broke it up!
consider it the price touched the target of pattern and I mention it on the chart!
now if you check the 4h timeframe:
you can see a head and shoulders pattern formed but the neckline has not broken yet! if the neckline breaks you can get a short position to the s&d area!
this area is also a potential area for starting an upward movement!
___________________________
✓✓✓ always do your research.
❒❒❒ If you have any questions, you can write them in the comments below, and I will answer them.
❤︎ ❤︎ ❤︎And please don't forget to support this idea with your likes and comment

USD/CAD H4 | Approaching pullback supportUSD/CAD is falling towards a pullback support and could potentially bounce off this level to climb higher.
Buy entry is at 1.3702 which is a pullback support that aligns with the 38.2% Fibonacci retracement level.
Stop loss is at 1.3608 which is a level that lies underneath a pullback support and the 61.8% Fibonacci retracement level.
Take profit is at 1.3828 which is a pullback resistance.
High Risk Investment Warning
Trading Forex/CFDs on margin carries a high level of risk and may not be suitable for all investors. Leverage can work against you.
Stratos Markets Limited (www.fxcm.com):
CFDs are complex instruments and come with a high risk of losing money rapidly due to leverage. 66% of retail investor accounts lose money when trading CFDs with this provider. You should consider whether you understand how CFDs work and whether you can afford to take the high risk of losing your money.
Stratos Europe Ltd, previously FXCM EU Ltd (www.fxcm.com):
CFDs are complex instruments and come with a high risk of losing money rapidly due to leverage. 70% of retail investor accounts lose money when trading CFDs with this provider. You should consider whether you understand how CFDs work and whether you can afford to take the high risk of losing your money.
Stratos Trading Pty. Limited (www.fxcm.com):
Trading FX/CFDs carries significant risks. FXCM AU (AFSL 309763), please read the Financial Services Guide, Product Disclosure Statement, Target Market Determination and Terms of Business at www.fxcm.com
Stratos Global LLC (www.fxcm.com):
Losses can exceed deposits.
Please be advised that the information presented on TradingView is provided to FXCM (‘Company’, ‘we’) by a third-party provider (‘TFA Global Pte Ltd’). Please be reminded that you are solely responsible for the trading decisions on your account. There is a very high degree of risk involved in trading. Any information and/or content is intended entirely for research, educational and informational purposes only and does not constitute investment or consultation advice or investment strategy. The information is not tailored to the investment needs of any specific person and therefore does not involve a consideration of any of the investment objectives, financial situation or needs of any viewer that may receive it. Kindly also note that past performance is not a reliable indicator of future results. Actual results may differ materially from those anticipated in forward-looking or past performance statements. We assume no liability as to the accuracy or completeness of any of the information and/or content provided herein and the Company cannot be held responsible for any omission, mistake nor for any loss or damage including without limitation to any loss of profit which may arise from reliance on any information supplied by TFA Global Pte Ltd.
The speaker(s) is neither an employee, agent nor representative of FXCM and is therefore acting independently. The opinions given are their own, constitute general market commentary, and do not constitute the opinion or advice of FXCM or any form of personal or investment advice. FXCM neither endorses nor guarantees offerings of third-party speakers, nor is FXCM responsible for the content, veracity or opinions of third-party speakers, presenters or participants.

USDCAD getting strong support and might be heading up to 1.3850 USDCAD Price : 1.3750
Trend : UP on daily chart and the prices got support at the daily level 1.37250
Transaction: Buy
Reasons : mentioned on charts ( Daily chart left side , H1 chart right side )
Technical analysis failure at level : 1.37000
Technical analysis success at level : : 1.38500

USDCAD- Short IdeaEntry: Price broke through the swing low and the trendline with volume. Entry at the bearish zone.
Stop Loss: Slightly above the bearish zone. Give stop loss some room to breathe.
Take Profit: At TP, the nearish bullish zone.

Hand-To-Mouth Trading: Boredom in Trading, Weekly AnalisysIn this episode I share my results in the two week competition I'm participating in. I talk about changes to The Leap competition and also discuss the ways I avoid boredom while trading.


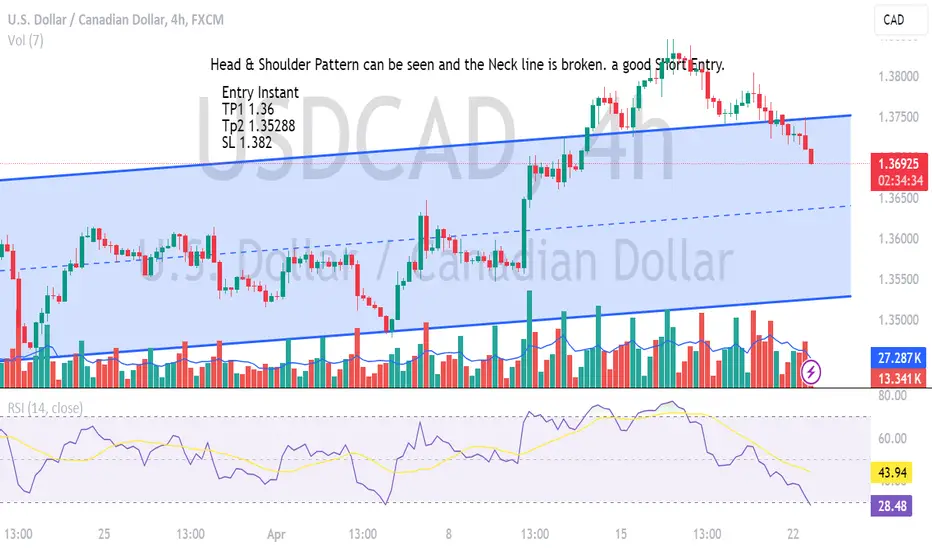
USDCAD Head & Shoulder Pattern with Neckline BrokenA Head & Shoulder Pattern at 4h TF of USDCAD. A good Short Entry. This is not a financial advice Please DYOR
usdcad chartUSD/CAD is the forex ticker that represents the US Dollar-Canadian Dollar currency pair. The USD/CAD rate, as indicated on the live chart, shows traders how many Canadian Dollars are required to buy one US Dollar. Follow the USD/CAD chart for live prices and stay up to date with the latest USD/CAD news, forecasts and analysis. Our expert industry insights will give you the edge to conduct thorough fundamental and technical analysis to trade this popular currency pair. usdcad confirm signal

USD/CAD bull or bearUSD/CAD has a low rsi right now and we seen some rejection off support I believe this will make a bullish play but what do you guys think?

USDCAD - Trend Reversal - Forecasting Price 1.36080USDCAD - Trend Reversal - Forecasting Price 1.36080.
Indication of trend reversal and start of bearish trend forming Head and Shoulder pattern with bearish divergence.

USDCADOn the #USDCAD currency pair, it is expected that the price trend will be bearish in the short term, depending on the technical outlook of the market.

USDCAD shortd1: into strong supply zone, then it made a bearish engulfing
h1: it's retest the ob d1 and ob h1
then 1-2-3 down wave is created with 2 high volume bearish engulfing.
Because it's a short and i have buy limit gu then i open a short usdcad by market price

usdcad short i don't talk more about big picture because this is addition position
add more position because h1 create 1 pinbar and one bearish engulfing after retest h1 key level
it also touch opening price then fall down. so all more short position


USD/CAD Will Drop Down Soon With This Reversal Patternthe price is standing at a strong area of resistance since Oct 2022 this area pushes the price each time very strongly. the second entry reason is that the price created this reversal head and shoulders pattern so we can enter a sell trade directly around the neckline

usdcad up trendIt seems that the symbole is going to change the movement of the trend and it goes up

usdcad keep selling and buy the imblance The current USD/CAD exchange rate has entered a selling zone This suggests a favorable opportunity to sell the USD against the CAD. Traders may consider setting their take profit levels at imblance, indicating the points at which they aim to exit the trade with profits. Additionally, This strategy aims to capitalize on anticipated downward movements in the USD/CAD pair, offering a structured approach to managing risk and maximizing returns in the foreign exchange market. By strategically setting take profit and stop loss levels, traders can execute their trades with confidence and discipline .

USDCAD OUTLOOKThere are a couple of reasons why i think this is possible.
1. Price is expensive
2. Price is moving in a channel, and is currently at key level. (WTF)
3. Buy Side Liquidity has been taken
4. 4hr TF chart pattern suggests price could be dropping soon.
What do you think?
Follow if you find value here.

USDCAD April 22, 2024: Waiting to Break To 52-Week HighOn April 22, 2024, OANDA:USDCAD is trading near the 6-month high (the white line) and the 52-week high (the yellow line)
A break above the yellow resistance would trigger a buy signal with a target price at the red line shown on the chart, which has the same distance to the yellow resistance as from the July bottom of 2023.

UsdCad 4HFX:USDCAD it looks like it will retest the last resistance on the 4h chart and will it be the new support...let's wait for it to reach the marked area to go long... keep an eye on this pair
www.instagram.com
